Save 23% ($351) & Get a Free 1-1 Call with our Team ⏰ : 0d 2h 59m 43s
Bitcoin support and resistance levels: Will we see a breakout?
Today, we dive into the recent Bitcoin price action, unpacking the drama of open interest drawdowns and market resets.
But that's just the beginning - we'll explore how Big Tech earnings could shake up the stock market, why small caps might be the dark horse to watch - and, more importantly, what this means for crypto.
With crucial jobs data and a Fed meeting on the horizon, we're in for a week of potential market-moving events. Will Bitcoin break out or pull back?
Let's dive in.
Key questions
- What caused Bitcoin's recent volatility, and how has it reshaped the market's health?
- Could Big Tech earnings reports be the catalyst for a major market shift this week?
- How might today's jobs data and tomorrow's Fed meeting create unexpected market waves?
- Is Bitcoin coiling for a breakout, or are we in for more turbulence?
- What key support levels should traders be watching if volatility strikes again?
Disclaimer: This is not financial or investment advice. You are responsible for any capital-related decisions you make, and only you are accountable for the results. "One Glance" by Cryptonary sometimes uses the RR trading tool to help you quickly understand our analysis. These are not signals, and they are not financial advice.
Open interest drawdown
We commented yesterday that Open Interest had substantially ramped up and that it would likely create more volatility in the market, as a highly leveraged market is more vulnerable to whipsawing price action.We then had Spot supply be sold into price at $70k, with the selling then increasing upon the breaking news that the US (Democrats) had moved $2b worth of BTC (presumably to be sold). This was the same BTC that, just days prior, former President Trump had pledged to use as part of a Strategic Asset Reserve.
This resulted in further spot selling, large long liquidations, and a more than 10% decrease in the total amount of open interest. The Funding Rate reset to around 0.005%, which is historically a healthy level. Yesterday's flushing out was a healthy reset.
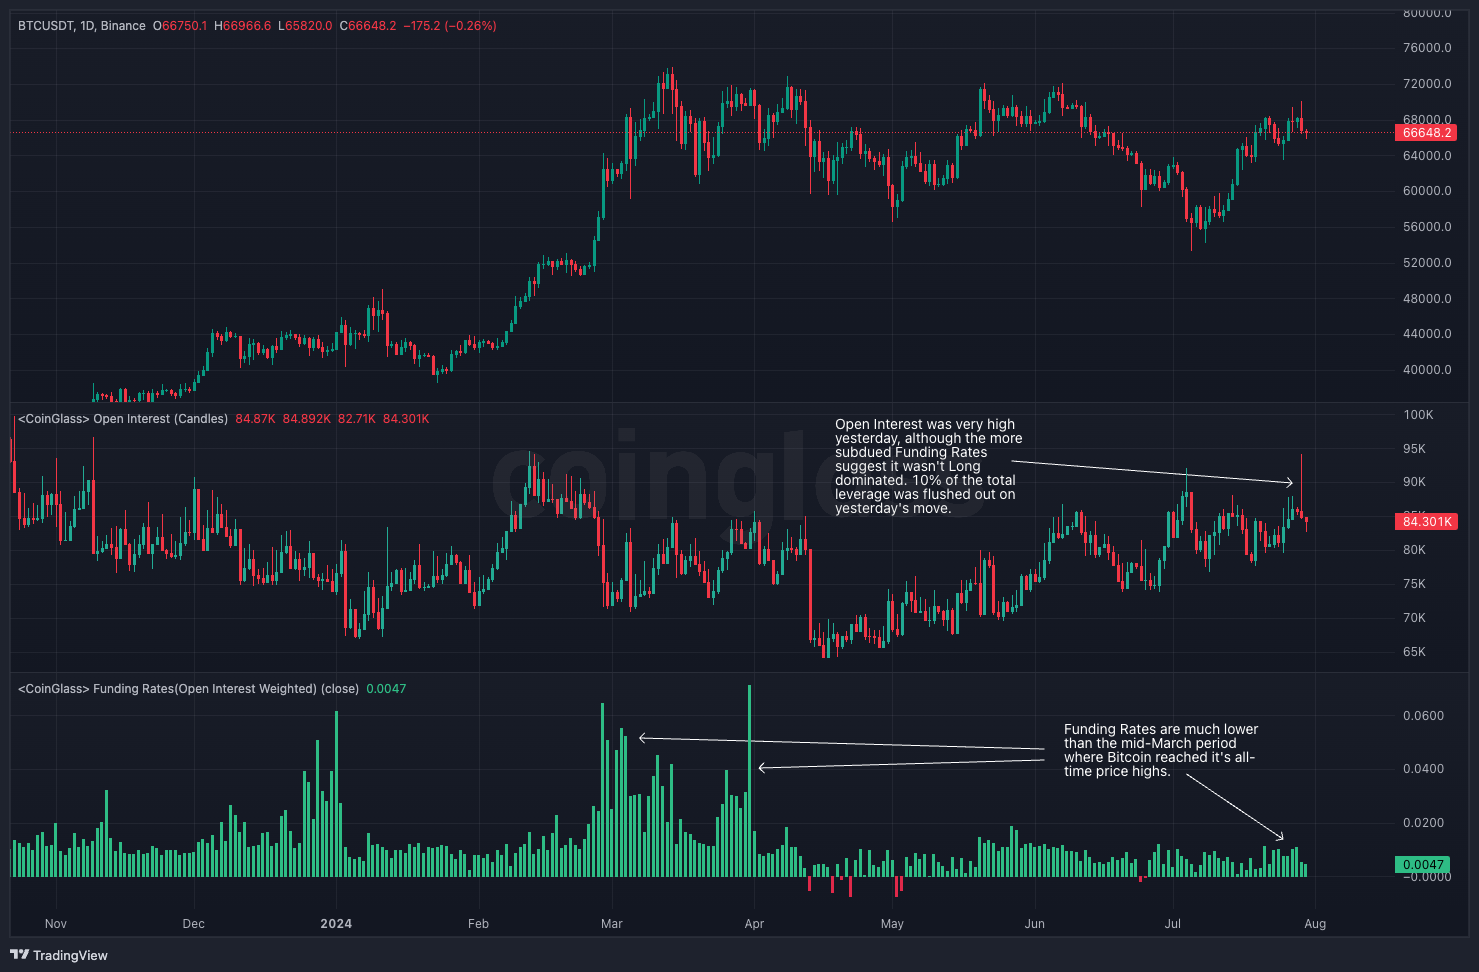
The image below shows that yesterday's Open Interest (OI) reset has resulted in a much healthier leverage market. This is particularly noteworthy when compared to Bitcoin's all-time high in March when annualised funding rates reached around 70%. This meant that traders in long positions were effectively paying 70% per year for the premium of being long in mid-March—an unhealthy setup overall.
BTC Open Interest and Funding Rate:
Corporate earnings this week
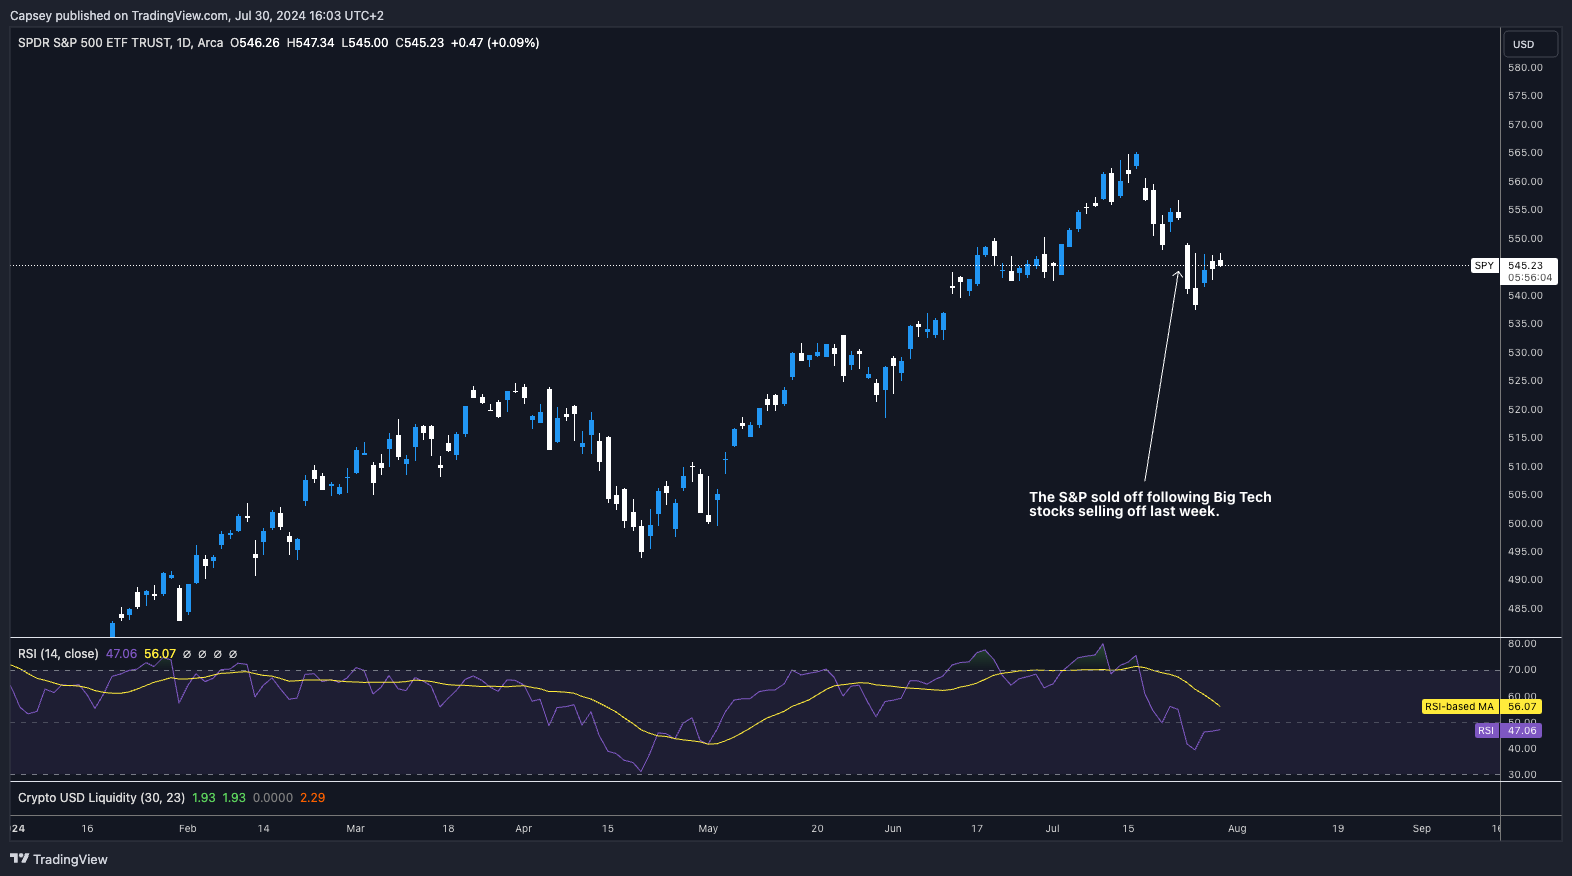
So far, a small number of companies have reported earnings. One of the more notable companies was McDonald's, which saw sales drop for the first time since 2020. The company's CEO suggested that consumers are becoming more 'discriminating with their spend'. However, this week's focus will be on Big Tech companies reporting: Amazon, Apple, Meta, and Microsoft.Last week, we saw Tesla and Alphabet report, with their stock prices punished following big capital expenditures on AI, even though their overall earnings were very positive. However, the 'cap ex' spend perhaps doesn't seem justified when looking at the earnings, even though AI is likely benefitting Big Tech companies in other ways for the time being, like increased productivity.
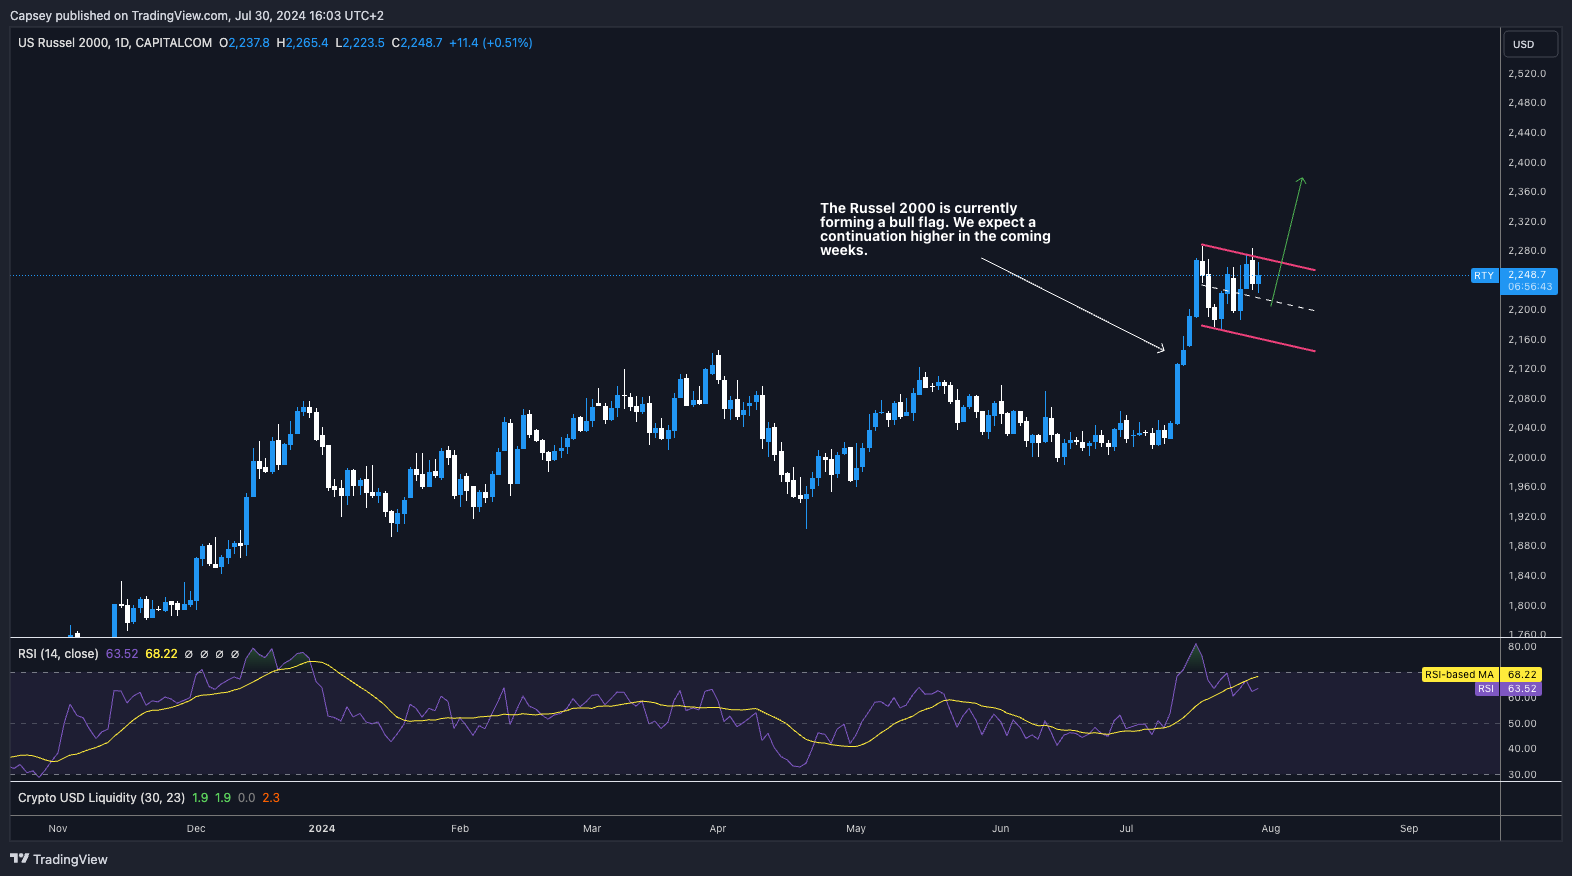
The markets punished Tesla and Alphabet last week, both seeing major sell-offs that resulted in substantial pullbacks for the indexes (S&P and Nasdaq) and a rotation into Small Caps—which were also fuelled by the Interest Rate cuts narrative. We expect the Russell 2000 (small-cap companies Index) to continue outperforming. By the way, it is now also forming a bull flag on the chart.
However, if Big Tech can hold up in this week's earnings - and again, we expect the earnings to be very positive - then we'd expect the indexes (S&P and Nasdaq) to see a more substantial bounce over the next fortnight. The rotation trade should also be positive for crypto, particularly if the broadening out continues, but it should also be matched by a bounce in the S&P and Nasdaq.
Russel 2000 1D Chart:
S&P 1D Chart:
Today's Jobs data and tomorrow's Fed meeting
Today, we have the JOLT's Job Openings data. This came in at 8.18m, which was slightly less than last month's 8.23m and well above the 8.03m that was forecasted. This suggests that the labour market is still holding up, and Employers are still actively hiring. However, we await the Unemployment Rate and Non-Farm Payrolls data on Friday for further data.Tomorrow, the Fed is widely expected to keep the Interest Rate the same but for Chair Powell to forward guide a rate cut for September's Meeting. The market expects a dovish tone from Powell tomorrow, so the risk is that he's not too committed to a September rate cut. This opens the door for a more negative surprise for markets.
Powell could use the Jackson Hole Meeting in mid-August to potentially forward-guide a September rate cut. He has used Jackson Hole previously to drop bombs; think of 2022's 'bring some pain', but we expect Jackson Hole to be more subdued next month.
In summary, the market is potentially vulnerable to a non-committal J Powell on Wednesday if he doesn't strongly hint at a September Interest Rate cut. This may provide some headwinds for markets in the coming week.
BTC
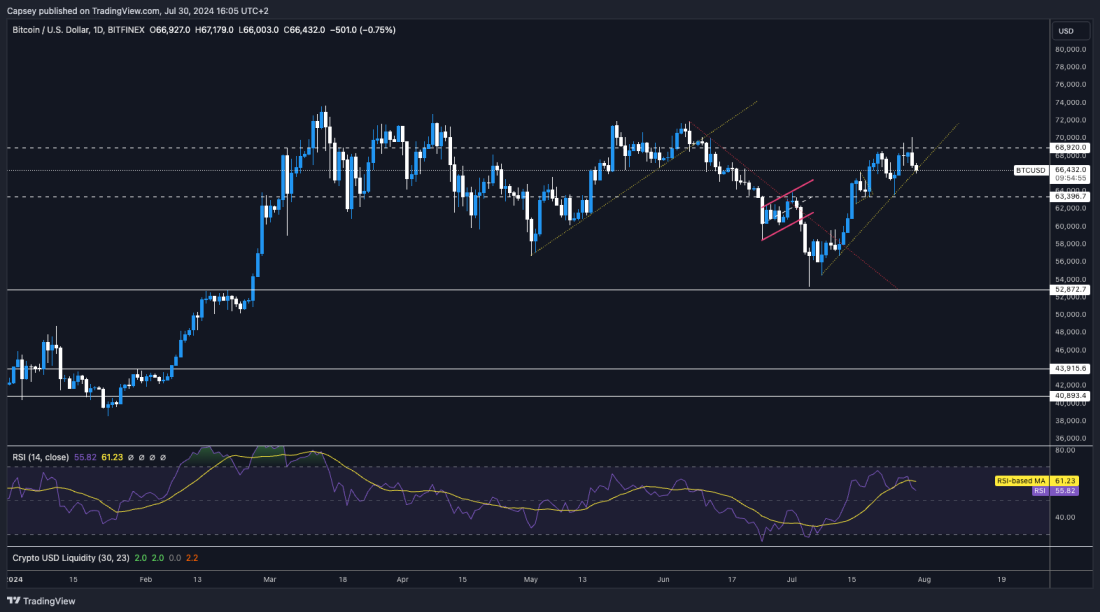
In a short-term timeframe, Bitcoin is squeezing into a pinpoint horizontal resistance of $68,900 and the local uptrend line. With some major macro data and events this week, we wouldn't be surprised if Bitcoin sees a lot of volatility this week, particularly as Open Interest is still quite high despite yesterday's more than 10% drawdown.If price is shaken around, we wouldn't be surprised to see a retest of the horizontal support of $63,400, with the $61k to $63k zone as an attractive area to bid. Although I'm not expecting this area to be retested as my base case.
BTC 1D Chart:
Recommended from Cryptonary


