Save 23% ($351) & Get a Free 1-1 Call with our Team ⏰ : 0d 2h 59m 44s
FREEGAME - Candlestick Analysis
In this session, we’re diving deep into the anatomy of candlesticks—looking at the body, wicks, and the psychology they reveal. Candlestick patterns provide powerful insights into market sentiment, helping us understand who is in control, how buyers and sellers interact, and when major shifts occur. By interpreting these elements, we gain an edge in reading price action and positioning ourselves with conviction.
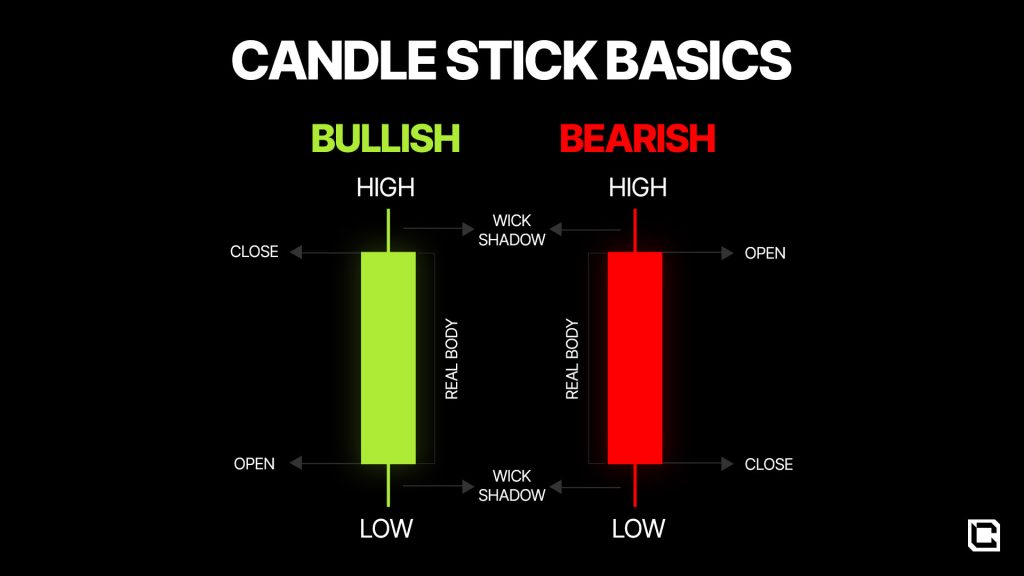
Anatomy of a Candlestick
- The Body:
- The body represents the range between the opening and closing prices for a given timeframe (e.g., daily, weekly). On TradingView, selecting a daily timeframe will show each candlestick representing one day of market action.
- Bullish Candlesticks: If the close is above the open, the candlestick body is typically green (bullish), showing upward movement.
- Bearish Candlesticks: If the close is below the open, the body is red (bearish), indicating downward movement.
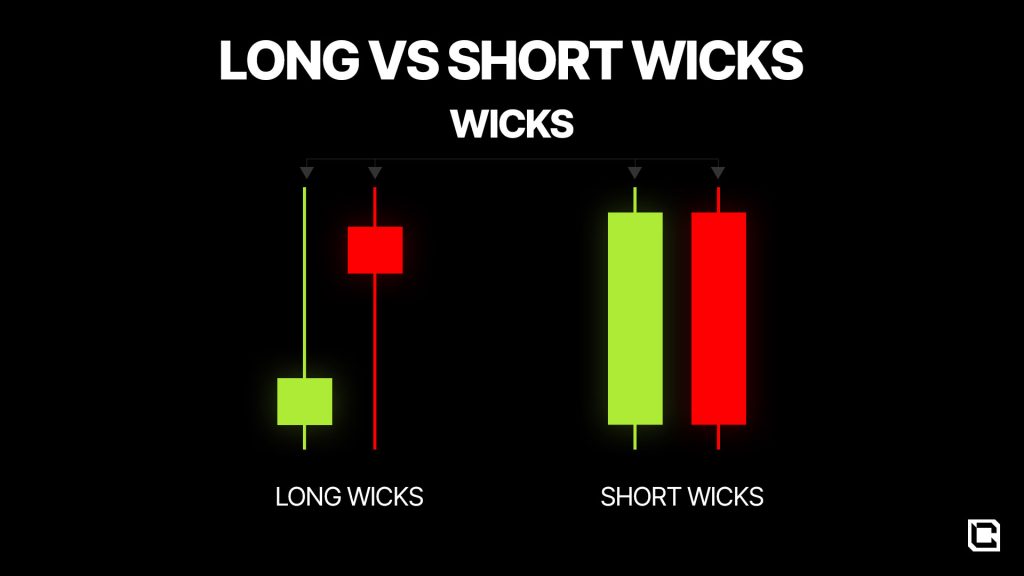
- The Wicks:
- Wicks (or shadows) show the highest and lowest points the price reached within that timeframe. Think of them as a “trail” of where price has been, reflecting any intra-period movements above or below the opening and closing prices.
- Long wicks can signal indecision, especially when paired with a small body, as they indicate price was tested in both directions.
Decoding Candlestick Patterns
When interpreting candlesticks, context is everything. Here are some classic patterns and what they tell us about market psychology:
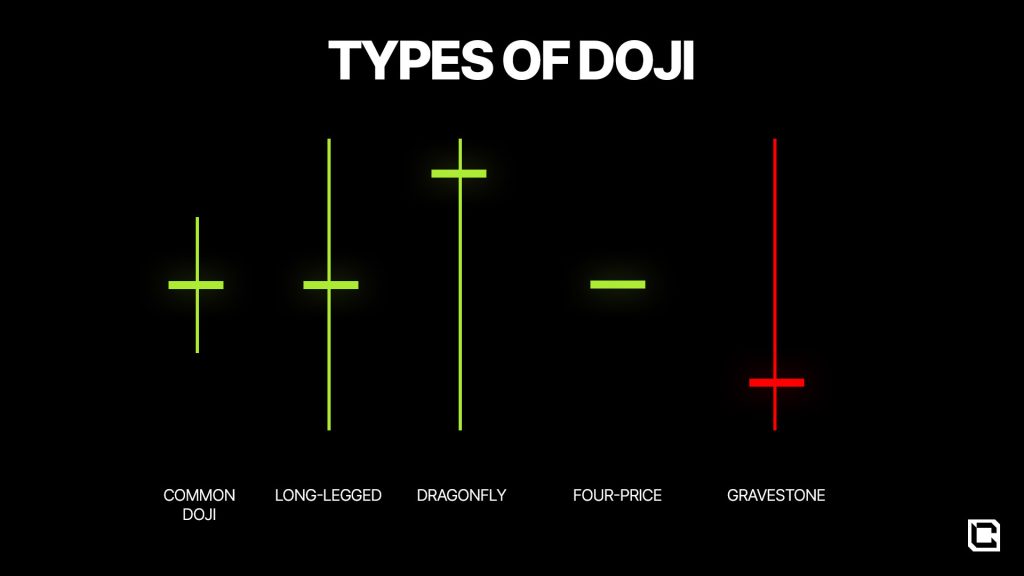
- Indecision Candlestick (Doji):
- A candlestick with a small body and long wicks on both sides is often a Doji, signaling indecision. Price was tested both higher and lower but closed around the opening level, indicating a “draw” between buyers and sellers.
- Following a Doji, watch for the next candlestick as it can signal a potential shift in market control.
- Strong Bullish or Bearish Candlesticks:
- A strong, full-bodied candlestick with minimal or no wicks shows clear market control. For a bullish candle, price opened at one level, rose steadily, and closed at the high, indicating conviction among buyers. A strong bearish candle shows a similar conviction among sellers.
- These candles are often seen after consolidation and indicate that the market has chosen a direction.
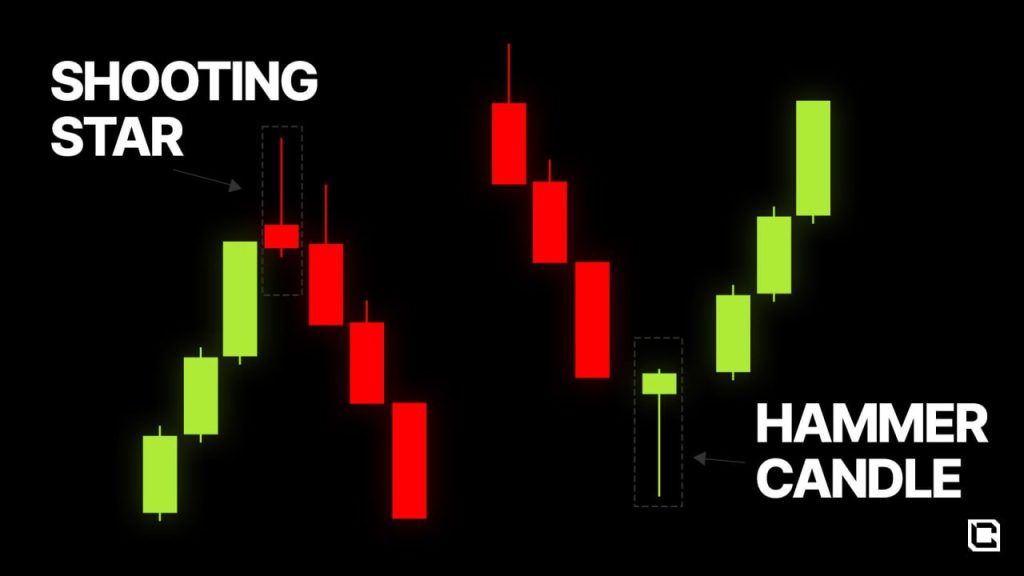
- Shooting Star and Hammer Candlesticks:
- Shooting Star: Formed after an upward move, this candlestick has a long upper wick and a small body at the bottom. At one point, the ca
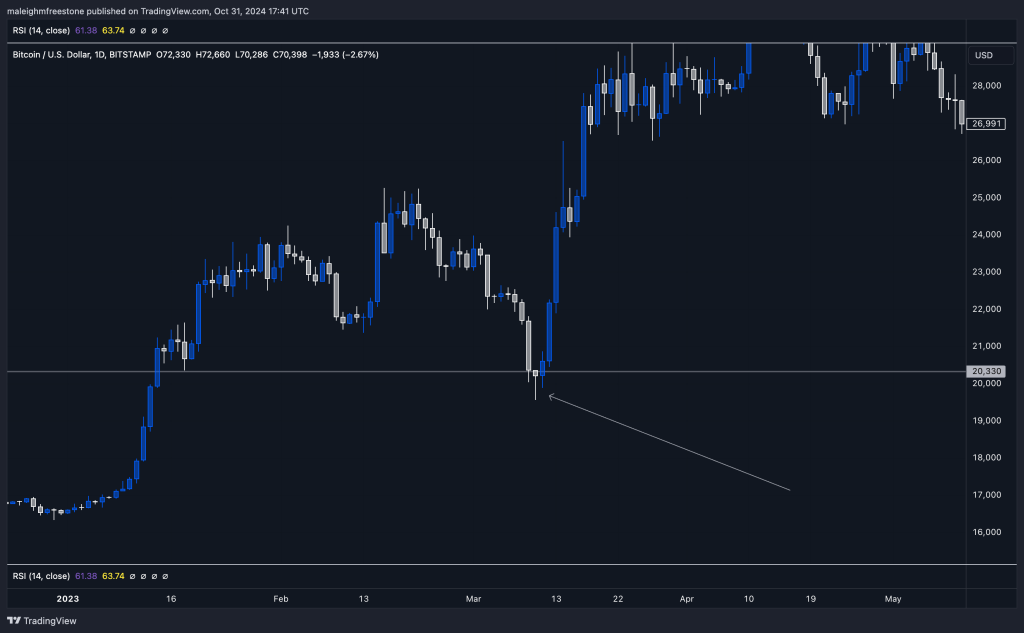
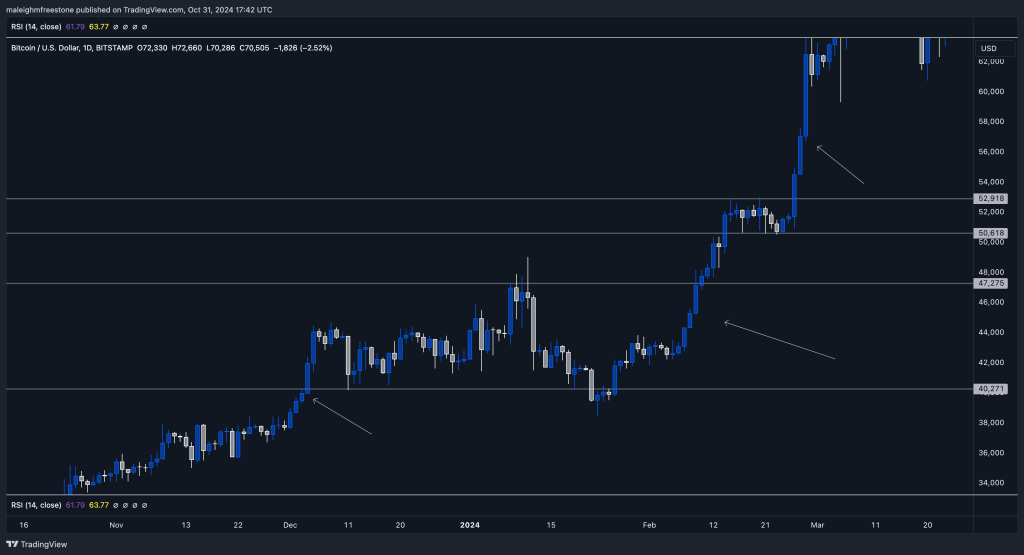
Real-World Examples and Psychology
Let’s break down some real candlestick examples to put this knowledge into action.
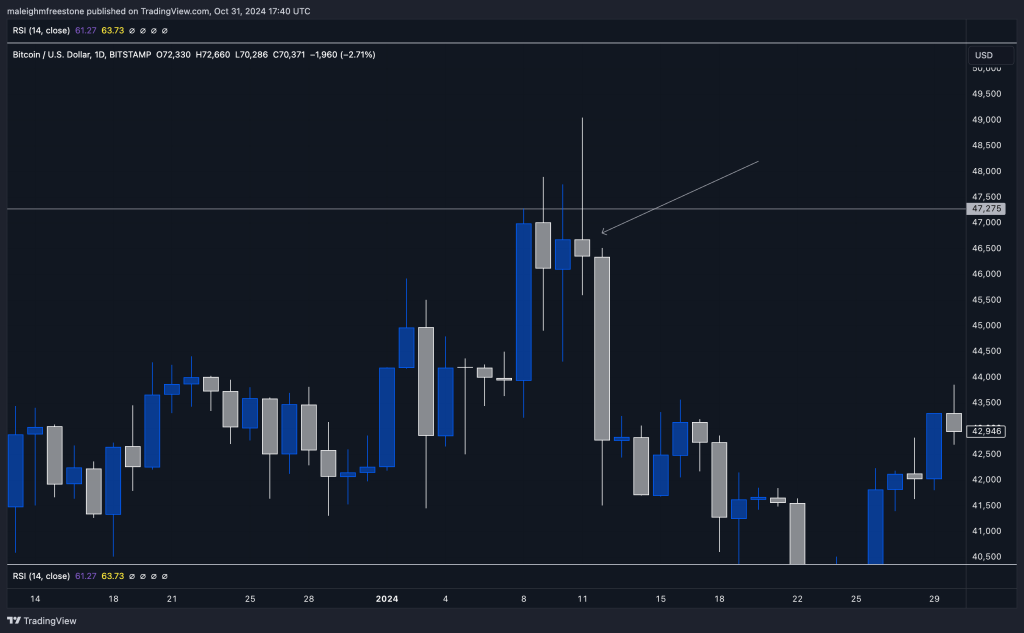
- Bullish Momentum: After a period of consolidation, a strong bullish candlestick with no wicks signals clear buyer dominance. This type of candlestick shows that buyers were in control for the entire timeframe, without interference from sellers. It’s an indication that price is likely to continue upward if no resistance is met.

- Bearish Reversal at Resistance: If a Shooting Star forms near a resistance level, it suggests that buyers attempted to push higher but couldn’t maintain control. Sellers took over, pushing price down by the close, which may signal a reversal or the beginning of a downtrend.
- Hammer at Support: A Hammer candlestick near a support level shows that while sellers initially pushed price down, buyers stepped in and closed it higher, defending the support. This candlestick often signals the end of a downtrend, especially when accompanied by strong volume.
- Trend Continuation: When multiple strong candlesticks print in the same direction, it indicates trend continuation. For instance, a series of strong bullish candles on the daily timeframe shows sustained buyer interest and the potential for further upside.
Candlesticks tell a story of buyers and sellers battling it out, but context is crucial. For example, an indecisive Doji at the end of an uptrend may signal a reversal, whereas the same Doji within consolidation might mean the market is undecided. Align candlestick patterns with all other factors to build your conviction, conext is king
- Applying Context: Look for candlestick patterns around key levels like support and resistance, as these are where sentiment shifts are most likely.
- Psychological Insight: Understanding that each candlestick represents the psychology of the market gives you an edge. Knowing whether buyers or sellers are in control helps shape your trading decisions.
Cryptonary’s Take
Mastering candlestick anatomy and understanding the psychology behind each pattern is essential for reading the market effectively. Rather than just identifying patterns, look at what each candlestick says about market participants—who’s winning the battle and at what level. It’s not just about spotting a pattern but understanding the story behind it. With this knowledge, you’ll be able to navigate the market with greater confidence and precision.
Continue reading by joining Cryptonary Pro
$1,548 $1,197/year
Get everything you need to actively manage your portfolio and stay ahead. Ideal for investors seeking regular guidance and access to tools that help make informed decisions.
For your security, all orders are processed on a secured server.
As a Cryptonary Pro subscriber, you also get:
3X Value Guarantee - If cumulative documented upside does not reach 300% during your 12-month membership, you can request a full refund. Terms
24/7 access to experts with 50+ years’ experience
All of our top token picks for 2025
On hand technical analysis on any token of your choice
Weekly livestreams & ask us anything with the team
Daily insights on Macro, Mechanics, and On-chain
Curated list of top upcoming airdrops (free money)
3X Value Guarantee
If cumulative documented upside does not reach 300% during your 12-month membership, you can request a full refund.
Our track record speaks for itself
With over 2.4M tokens and widespread misinformation in crypto, we cut through the noise and consistently find winning assets.
Our track record speaks for itself
With over 2.4M tokens and widespread misinformation in crypto, we cut
through the noise and consistently find winning assets.


Frequently Asked Questions
Can I trust Cryptonary's calls?
Yes. We've consistently identified winners across multiple cycles. Bitcoin under $1,000, Ethereum under $70, Solana under $10, WIF from $0.003 to $5, PopCat from $0.004 to $2, SPX blasting past $1.70, and our latest pick has already 200X'd since June 2025. Everything is timestamped and public record.
Do I need to be an experienced trader or investor to benefit?
No. When we founded Cryptonary in 2017 the market was new to everyone. We intentionally created content that was easy to understand and actionable. That foundational principle is the crux of Cryptonary. Taking complex ideas and opportunities and presenting them in a way a 10 year old could understand.
What makes Cryptonary different from free crypto content on YouTube or Twitter?
Signal vs noise. We filter out 99.9% of garbage projects, provide data backed analysis, and have a proven track record of finding winners. Not to mention since Cryptonary's inception in 2017 we have never taken investment, sponsorship or partnership. Compare this to pretty much everyone else, no track record, and a long list of partnerships that cloud judgements.
Why is there no trial or refund policy?
We share highly sensitive, time-critical research. Once it's out, it can't be "returned." That's why membership is annual only. Crypto success takes time and commitment. If someone is not willing to invest 12 months into their future, there is no place for them at Cryptonary.
Do I get direct access to the Cryptonary team?
Yes. You will have 24/7 to the team that bought you BTC at $1,000, ETH at $70, and SOL at $10. Through our community chats, live Q&As, and member only channels, you can ask questions and interact directly with the team. Our team has over 50 years of combined experience which you can tap into every single day.
How often is content updated?
Daily. We provide real-time updates, weekly reports, emergency alerts, and live Q&As when the markets move fast. In crypto, the market moves fast, in Cryptonary, we move faster.
How does the 3X Value Guarantee work?
We stand behind the value of our research. If the documented upside from our published research during your 12-month membership does not exceed three times (3X) the annual subscription cost, you can request a full refund. Historical context: In every completed market cycle since 2017, cumulative documented upside has exceeded 10X this threshold.
TermsRecommended from Cryptonary