Save 23% ($351) & Get a Free 1-1 Call with our Team ⏰ : 0d 2h 59m 43s

Let’s dive in…
Disclaimer: This is not financial or investment advice. You are responsible for any capital-related decisions you make, and only you are accountable for the results.
Fibonacci Retracement: How to Correctly Use It
We’re going to focus on the bull case for this cycle since we’re still buyers looking for exit points eventually.
Key Levels and Context
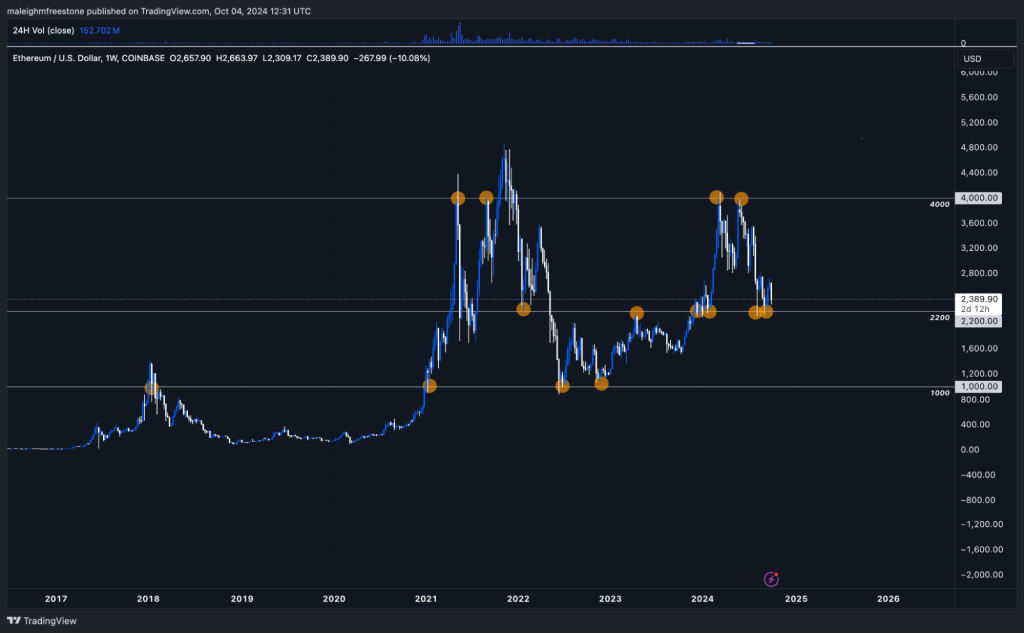
Before pulling up a Fibonacci retracement, it’s important to first identify key levels in the market. This is crucial because Fibonacci only makes sense within a given context. To do this, you need to understand that these key levels are driven by human behaviour. We’re analysing where participants in the market have consistently bought or sold.Example: If price has tested a level multiple times, it tells us that this level is significant. It could be a point where large market participants have placed significant buy or sell orders, creating strong resistance or support. These are the price points that will frame our analysis.
Identifying Significant Swing Points
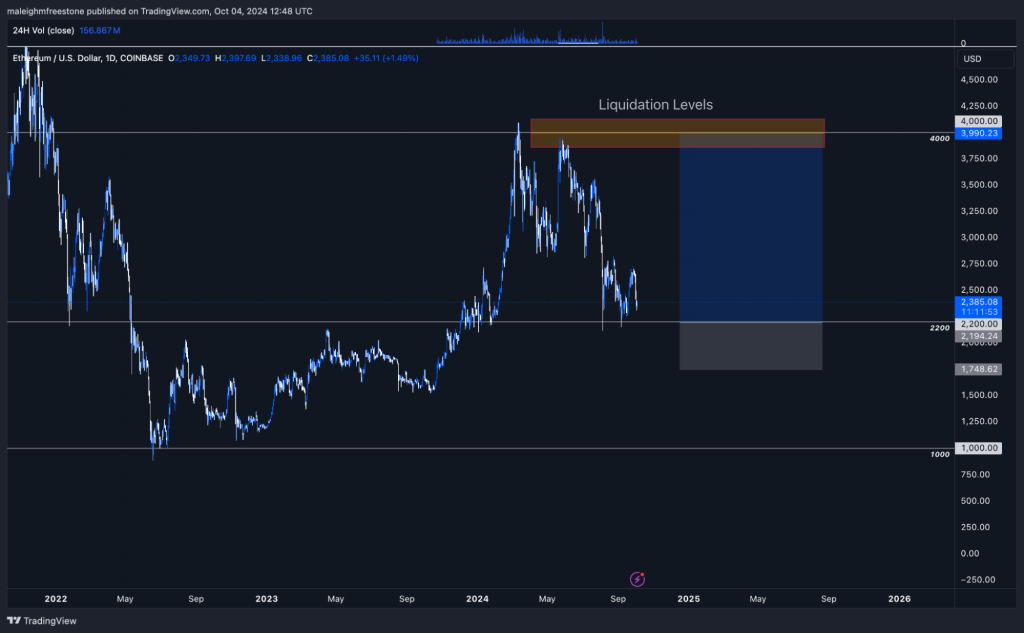
Next, we need to pick out the key swing points in the market. These are the points where significant price movements have occurred. For instance, when Ethereum hit $1,000, the market deemed it overvalued and sold off. Similarly, at $4,000, there was heavy resistance, causing the price to reject and sell down again.Rule of Thumb: Always focus on higher timeframes for stronger levels. Monthly or weekly timeframes will give you a clearer picture of major price moves, making your Fibonacci analysis more reliable.
Setting the Context for Fibonacci
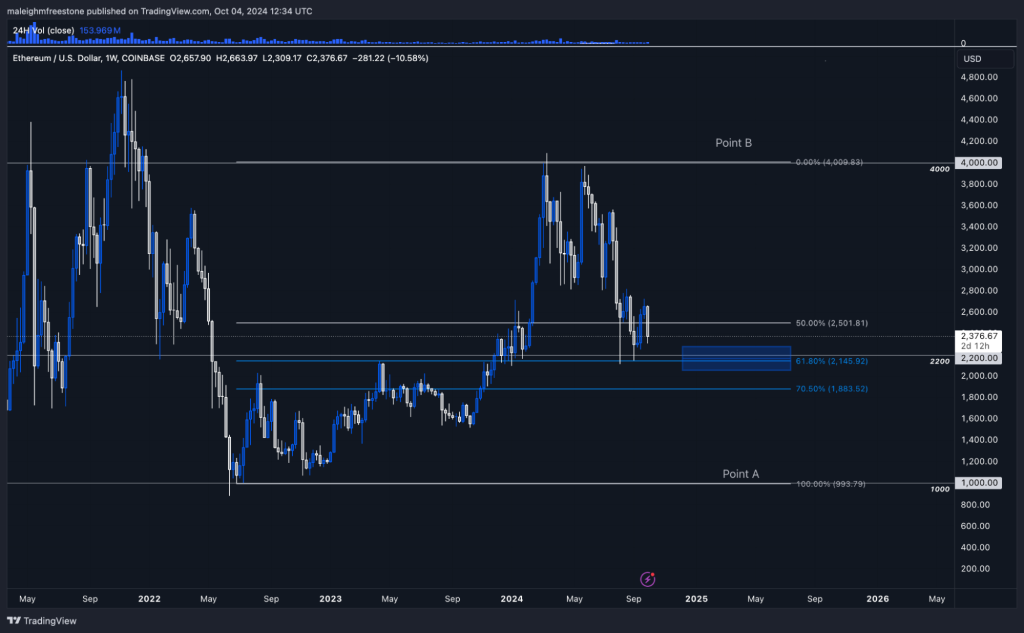
Now that we have our key levels, we can apply the Fibonacci retracement. Let’s say the price has expanded from $1,000 to $4,000—this is the context in which we’re working. The Fibonacci retracement helps us analyse the pullbacks from that move and spot potential buy opportunities.Example: The $2,200 level is another key psychological price point where buyers stepped in before, causing a reversal. When the price retraced to this level, it provided a strong buying opportunity.
How to Use Fibonacci Retracement
The Fibonacci tool calculates percentages between the swing points. For example, a 50% retracement of the $1,000 to $4,000 move would bring the price down to $2,500. However, the most crucial level to watch for in Fibonacci retracements is the 61.8% retracement. This is the level that tends to provide a healthy retracement in bullish markets and often leads to strong reversals.Rule of Thumb: If you’re bullish, pull the Fibonacci from the bottom to the top of the move. That’s how you’ll see the retracement levels, and most importantly, the 61.8% level that often signals a potential bounce.
Why 61.8% is Important
The 61.8% level is based on Fibonacci mathematics, found everywhere in nature, and it tends to show up frequently in the markets. In bullish markets, a 61.8% retracement provides a strong case for a continuation of the trend. Traders often look for prices to dip to this level before buying back in, expecting the asset to continue moving higher.Psychological Impact: The big institutional money often steps in around or below the 50% retracement mark, because they view this as a discount after a major move higher. This creates demand at those levels.
Fibonacci Settings
Here are the Fibonacci settings you should use. These are straightforward, and the key levels you need to focus on are the 61.8% and 70.5% retracements. Keep it simple, and use these levels as the basis of your analysis.If you don’t have the correct settings on your charts, screenshot these Fibonacci settings and add them to your charting tool for easy reference.

Applying Fibonacci to Real Trades
Once you’ve identified your key swing points and pulled the Fibonacci retracement, you can start looking for buy opportunities. If the price retraces to the 61.8% level, this is where you might see buying pressure build-up, especially if it aligns with other indicators like key psychological levels or support zones.Example: If Ethereum retraces from $4,000 back down to $2,500 (just below the 50% retracement), smart money might step in, and you could expect a bounce from there.
Cryptonary's take
Fibonacci retracement is a powerful tool when used correctly. The key is to ensure you are pulling it between significant swing points and using higher time frames to get a better sense of the major levels in play. Once you have those key levels and the Fibonacci tool in place, you can confidently make informed trading decisions and improve your chances of success.Profit-Taking Levels and Risk Management
Since we learnt about how to use Fibonacci, let’s now focus on how to identify profit-taking levels and how to align them with risk management to keep your trades in check. This is something we discussed in the live video, and it came with some great questions, so let’s dig into it.
Different Ways to Analyze the Market
We all analyse markets differently. Some traders use technical analysis, others use fundamental analysis, and some rely on a mix of methods. The key point is that everyone resonates with different approaches. But no matter the style you prefer, there are some fundamental principles that you can apply to identify profit-taking levels.Identifying Key Price Points
When identifying profit-taking levels, you want to find significant inflection points in the market. This is where price has reacted strongly before, and you can spot them by looking at how price interacts with resistance or support over time.Example: If you see the price hit resistance multiple times, it tells you that market participants are consistently selling at that level. Similarly, if you see price bouncing from a support level, buyers are stepping in hard at that price point. These are the key price levels you need to watch.
High-Quality Setups
When we talk about profit-taking levels, we’re usually dealing with a setup that has a high probability of success—what we call a High-Quality setup. Nothing is 100%, but this is where our risk-to-reward comes into play.
If the chances of the trade playing out in our favour are higher than the chance of it failing, that’s when we pull the trigger. Why? Because the risk is worth the potential reward, and this is what risk management is all about.
Risk Management is Key
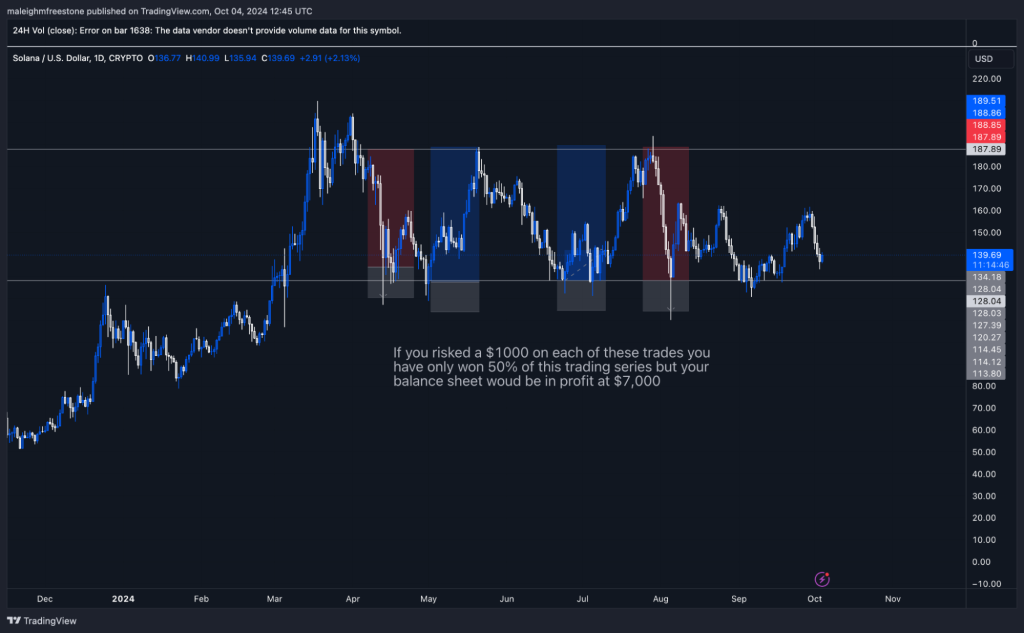
It doesn’t matter what method or system you use to analyse the market—whether it’s Fibonacci retracements, oversold RSI levels, or something more technical like market mechanics (funding rates, etc.). The system will only work if you stick to risk management.Example: Let’s say you win 7 out of 10 trades. A 70% win ratio is exceptional, but if you get overconfident and start risking too much on those last 3 trades, you could lose all your gains. That’s why consistent risk management is critical.
How Risk Ties Into Profit-Taking Levels
So, how does this connect to profit-taking? Your take profit level should align with the risk you’ve taken on the trade. Let’s say you’re risking $2,000. You don’t want to take a profit just to make $2,000—it wouldn’t justify the risk. Instead, you want a 3:1 or 4:1 return on that risk. That way, if you lose a few trades, your winners still more than makeup for it.
Example: You enter a trade risking $2,000. Based on your analysis, the setup has a solid chance of playing out. You’d only take the trade if your technicals suggest that you could make at least $8,000 (4x your risk) if the trade goes as expected.
Liquidation Levels and Market Makers
A key point to remember when deciding on profit-taking levels is the influence of liquidation levels. Exchanges are market makers, and they make a lot of money from liquidating traders’ positions.
When you see a buildup of liquidation levels around a price point, it’s a good sign that the market might push the price toward that level. For example, on Ethereum, let’s say there are a lot of liquidation levels clustered just below $4,000. When the price gets close to this level, it will likely hit that mark because the exchange has an incentive to trigger those liquidations.
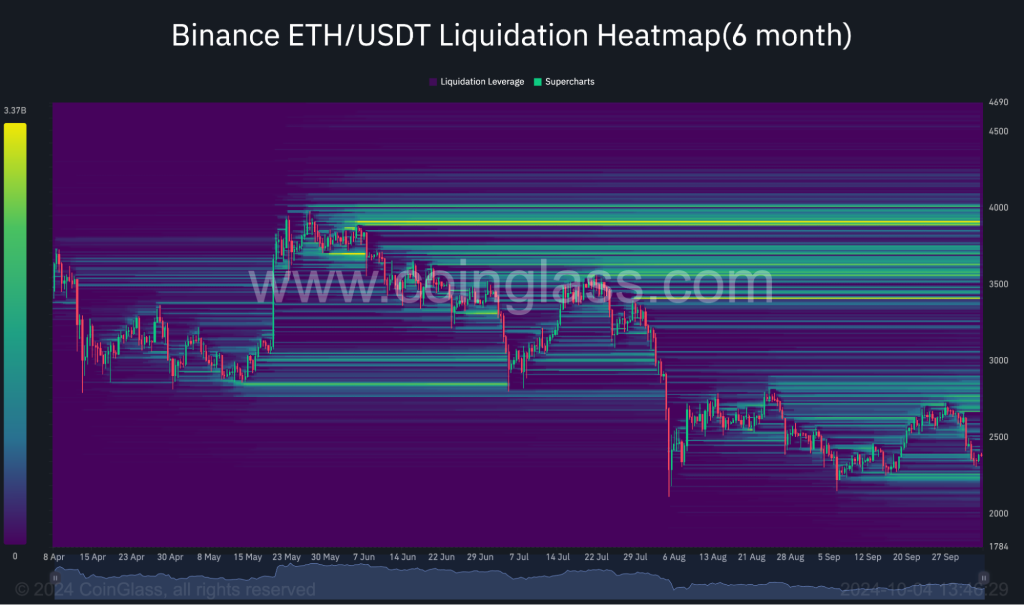
Profit-Taking Based on Inflection Points and Liquidations
When deciding where to take profits, combine your analysis of key levels and liquidation zones. You’ve already identified the important levels where buyers and sellers have acted before. Now, look at the liquidation heat map to see if there’s any clustering of liquidations at or near those levels.
By doing this, you align your profit-taking levels with where the market is likely to move next, increasing the chances of hitting your target.
Cryptonary's Take
Profit-taking levels aren’t just about where you think the market will go—they need to be aligned with your risk management and the market dynamics like liquidation levels. By sticking to these principles, you can consistently improve your trading results and avoid emotional decision-making.Recommended from Cryptonary