Log in

Home
Research
Analysis
Community
  1. Cryptonary
  2. Crypto School
  3. Freegame: Funding Rate & Open Interest
Videos

Freegame: Funding Rate & Open Interest

Updated: Oct 26, 2024
Published: Oct 25, 2024
1
Share:

Post Feature Image

Introduction

In this session, we’re covering two essential metrics in futures trading—Funding Rate and Open Interest—to help you maneuver market volatility and manage leverage. Both tools reveal key market mechanics, giving you insight into buyer/seller bias and where leveraged positions are piling up.

Spot Market vs. Futures Market

Let’s break down the basics:
  • Spot Market: When you buy Bitcoin here, you actually own the asset. You’re buying the “real” BTC, giving you ownership on the blockchain.
  • Futures Market: Here, you’re trading contracts that settle on a future date, which lets you apply margin and leverage, increasing your exposure without directly owning Bitcoin. This is where funding rate and open interest metrics come into play.

The futures and spot markets are separate. The spot market operates without leverage, while the futures market can influence market sentiment due to leveraged buying and selling. Funding Rate Mechanics

alignnone wp-image-304208 size-large

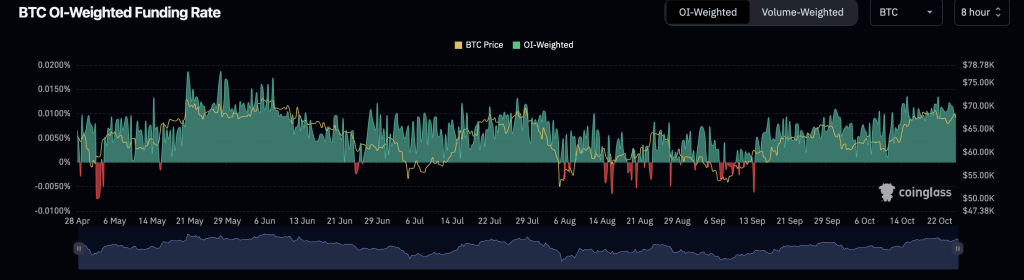
The funding rate is a mechanism exchanges use to keep futures prices aligned with spot prices. It’s a fee either paid or received, depending on market dynamics:

  • Positive Funding Rate: When buyers (longs) dominate, they pay the fee to short sellers. This reflects an excess of bullish leverage, which may push prices higher.
  • Negative Funding Rate: When sellers (shorts) dominate, they pay the fee to long buyers, signaling bearish sentiment or selling pressure.
Key Insight: The funding rate is good way to read the undertones of market sentiment. If it’s high and positive, longs are piling in; if it’s negative, shorts have the upper hand.
  1. Understanding Open Interest

alignnone wp-image-304209 size-large

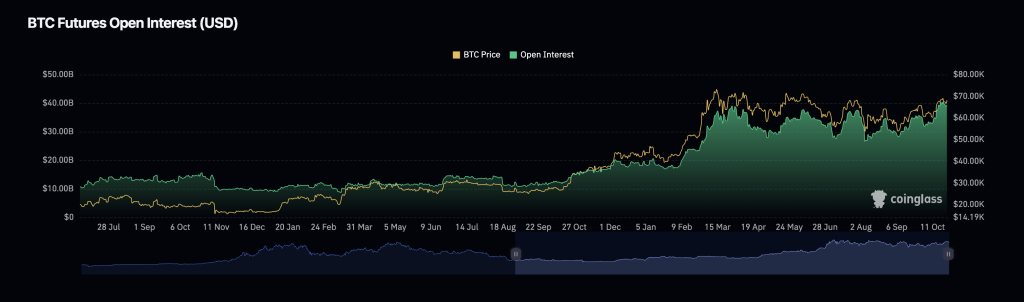
Open interest shows the total number of open futures contracts. It doesn’t distinguish between buyers and sellers but reveals how much leveraged exposure is being added to an asset like Bitcoin.

  • Rising Open Interest: Indicates growing commitment and possibly increased volatility.
  • Falling Open Interest: Signals positions being closed or liquidated.
Tip: Rising open interest with positive funding suggests strong buying interest, while rising open interest with negative funding indicates selling dominance.
  1. Using Funding Rate and Open Interest Together

alignnone wp-image-304210 size-large

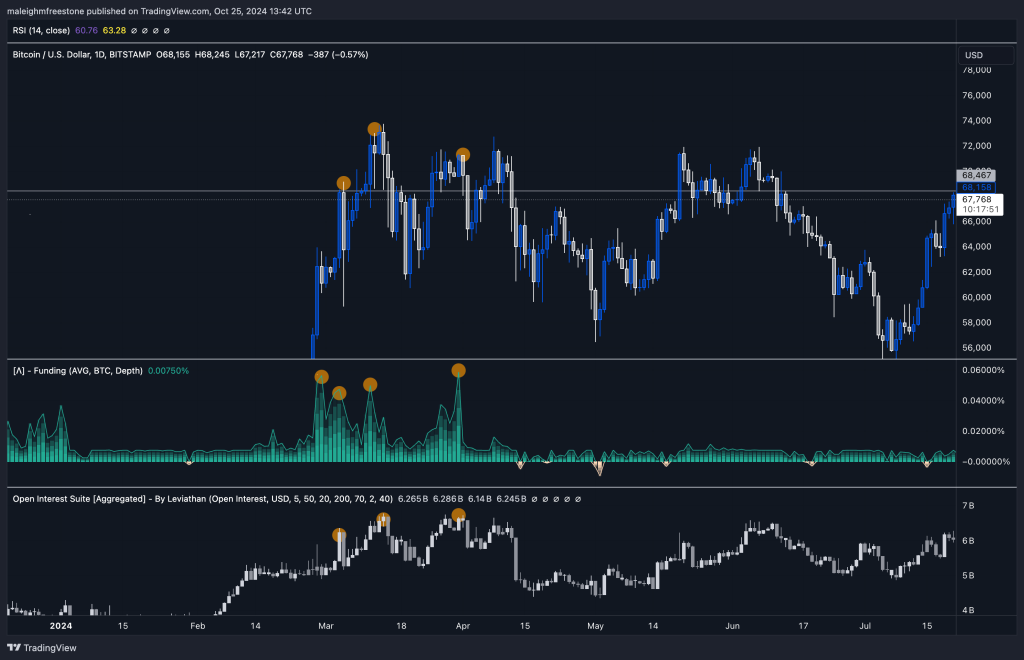
The power of these metrics lies in analyzing them together in context. Here’s how they can signal potential market moves: In the example above you can see where funding and open interest ramped up and we had pull backs on BTC as a result.

Scenario 1: Rising Open Interest + Positive Funding Rate

  • What It Means: Long traders are adding leverage, showing bullish sentiment.
  • Action: Monitor for overleveraging, which can lead to a “flush out” or correction if funding rates get too high and buyers exit en masse.
Scenario 2: Rising Open Interest + Negative Funding Rate
  • What It Means: Short traders are driving leverage, reflecting bearish sentiment.
  • Action: Consider the likelihood of a bearish move, as selling interest grows.
Scenario 3: Low Open Interest + Flat or Negative Funding Rate (especially near market bottoms)
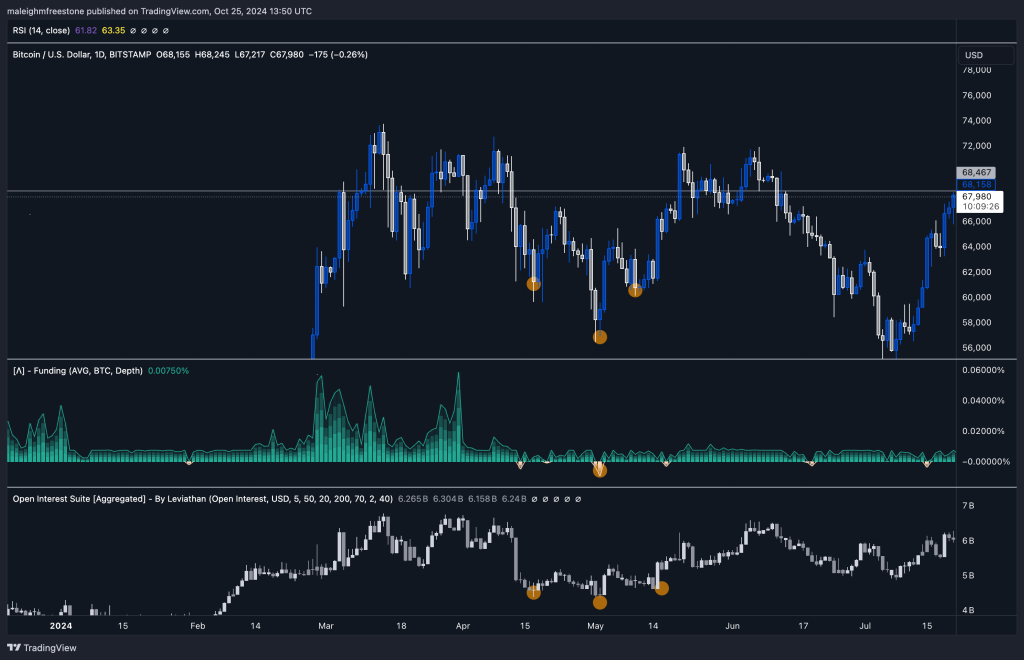
  • What It Means: This setup often indicates market equilibrium with fewer leveraged positions, which could be a good time to consider buying.
• Action: Look for entries when open interest is low, and funding is flat or negative. here is an example of this below

alignnone wp-image-304211 size-large

Our Top Picks:

DOGWIFHAT

DOGWIFHAT

120,650%

SPX6900

SPX6900

17,000%

POPCAT

POPCAT

66,567%

PENDLE

PENDLE

5,002%

SOLANA

SOLANA

2,500%

HYPE

HYPE

1,740%

Don’t miss our next 100X

Trusted by 230K+ investors

Real-World Application

alignnone wp-image-304210 size-large

Here’s an example to illustrate:

  1. All-Time Highs with High Funding Rate: Open interest and funding rates climb during euphoric times. Once funding spikes, it can lead to rapid sell-offs.
Example: Bitcoin’s all-time highs saw funding spike, followed by significant corrections as overleveraged positions were liquidated.
  1. Healthy Consolidation Zones: After a flush, funding and open interest settle back to equilibrium, creating healthier buying conditions.
  2. Bear Market Support Zones: When funding goes negative with low or flat open interest, it often aligns with market bottoms. This signals fewer leveraged traders and a more stable environment for buyers to enter.
Important: Recognize that context is everything. Funding rate and open interest should always be interpreted in relation to the overall market direction and other technical indicators.
  1. Practical Steps Using Coinglass
Tools like Coinglass provide a simple way to view funding rates and open interest data in real-time. It’s an effective way to keep funding rate and open interest separate from price charts, which can help in identifying key trends without overcrowding your screen.
  1. Go to Coinglass and select Bitcoin or any asset you’re analyzing.
  2. Monitor funding rate & open interest changes as the price approaches significant levels.
  3. Watch for spikes in these metrics that signal increased leverage.
  4. Putting It All Together
Using funding rates and open interest data is about enhancing your overall strategy. By understanding when leverage is stretched too far, you can avoid buying at market tops and instead look for high-quality entries at support levels or when funding rates turn negative.

Final Note: Look at the context of these metrics with every trade, just as you do with technical analysis. Tracking funding rates and open interest in alignment with support/resistance zones will sharpen your entries and protect against unexpected reversals.

Cryptonary’s Take:

Understanding funding rates and open interest is like seeing the market’s heartbeat. These metrics tell us who’s piling in and where leverage is stacking up, letting us spot shifts in sentiment before they hit the charts. When funding rates spike or open interest ramps up, it’s a red flag—those euphoric buyers or sellers are at risk of a flush-out, where we see big sell-offs or liquidations that clear out the overly exposed positions.

By catching these signals, we know when the market’s stretched too far and can avoid getting caught at the top. It’s all about timing our entries for when the market’s actually healthy, not when everyone else is piling in and pushing prices beyond sustainable levels. Using these metrics keeps us in sync with the market’s rhythm, letting us jump in when conditions are right and avoid the noise.

Leverage this data to sharpen your entry points, keep your risk tight, and align yourself with moves that have more room to run. It’s how we stay on the right side of market moves and keep stacking up quality trades.


Get started for free

Create your free account or log in to read the full article.

​

Germany

By signing up, you agree to our Terms & Conditions
Recommended from Cryptonary
Yield Watch: Markets Were Brutal, Our Ranges Kept Earning
Yield farming
Yield Watch: Markets Were Brutal, O...Markets have been brutal. But CLP users have been in a different position: earning fees from volatil...
5 min read
Feb 4, 2026
BTC, ETH and More: Markets Flush to Major Lows
PRO
Market Direction
BTC, ETH and More: Markets Flush to...Markets just snapped lower after BTC lost $80.5K and flushed into the $74K liquidity zone. Now we’re...
13 min read
Feb 3, 2026
Market Update: This Week's Setup
PRO
Market Updates
Market Update: This Week's SetupThis week looks calm on the surface. But underneath, the market is being pulled in two directions, a...
7 min read
Feb 2, 2026
Market Pulse: A Fundamental Look at Why Hyperliquid is Outperforming
Research Report
Market Pulse: A Fundamental Look at...Over the last couple of weeks, it’s been clear that HYPE has been the strongest asset among majors. ...
4 min read
Feb 8, 2026
BTC, ETH and More: Downside Targets Hit, All Eyes on the Recovery
PRO
Market Direction
BTC, ETH and More: Downside Targets...Bitcoin flushed into the Monthly OB at $65,650 before bouncing back, while Ethereum and Solana both ...
14 min read
Feb 6, 2026
Market Update: Bitcoin Approaches the Buy Zone
PRO
Market Updates
Market Update: Bitcoin Approaches t...Disclaimer: This is not financial or investment advice. You are responsible for any capital-related ...
9 min read
Feb 6, 2026
Yield Watch: Markets Were Brutal, Our Ranges Kept Earning
Yield farming
Yield Watch: Markets Were Brutal, O...Markets have been brutal. But CLP users have been in a different position: earning fees from volatil...
5 min read
Feb 4, 2026
BTC, ETH and More: Markets Flush to Major Lows
PRO
Market Direction
BTC, ETH and More: Markets Flush to...Markets just snapped lower after BTC lost $80.5K and flushed into the $74K liquidity zone. Now we’re...
13 min read
Feb 3, 2026
Market Update: This Week's Setup
PRO
Market Updates
Market Update: This Week's SetupThis week looks calm on the surface. But underneath, the market is being pulled in two directions, a...
7 min read
Feb 2, 2026
Research
Top PicksDeep DivesPassive IncomeAirdrop Reports
Analysis
Market UpdatesMarket DirectionMarket PulseLivestreams
Tools
Market DirectionAssets & PicksAirdropsPortfolio Tracker
Cryptonary
Affiliate programEducationPrivacy PolicyTerms & ConditionsContact UsWrite for us
Stay connected
Disclaimer: The information provided on this website is for educational and informational purposes only and does not constitute financial, investment, legal, or tax advice. Cryptonary is not a licensed financial advisor. All content is shared without any guarantee of accuracy or completeness. You are solely responsible for your investment decisions. Always do your own research and consult with a licensed professional before making financial choices. Past performance is not indicative of future results.

×
popupimage
Our Latest Utility Token Research ReportPreviously locked for Pro members, now available to read in full.
  • tickThe utility token we're tracking closely
  • tickWhy we believe it's still early in the cycle
  • tickWhat we're watching to confirm a structural shift
​
Germany

No spam. No hype. Just the research.