Save 23% ($351) & Get a Free 1-1 Call with our Team ⏰ : 0d 2h 59m 43s
Freegame: Mapping Out Winning Trades And Positioning Correctly
In this session, we’re focusing on mapping out Solana and Ethereum from the top down, identifying key trade levels. We won’t go into analysing every part of the chart. Instead, we’ll focus on the most relevant levels within the current context. Let’s start with Ethereum.

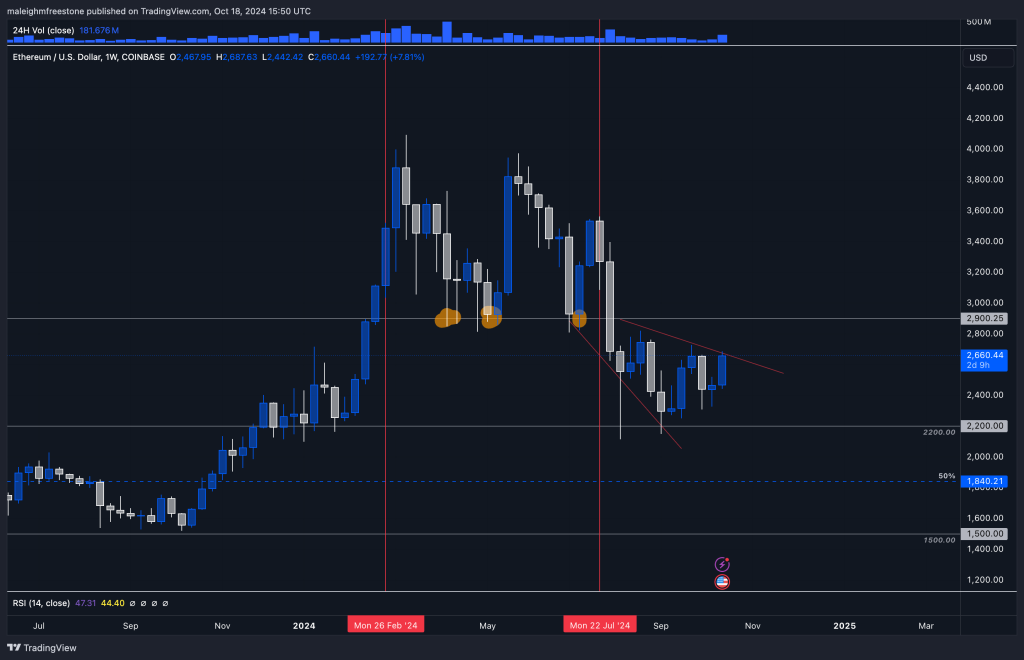
Ethereum Key Levels We’re currently trading around a significant level at $2,200. It’s important to understand why this level has had multiple reactions over time. Historically, buyers have stepped in at this price point, which we’ve seen across various timeframes, especially on the weekly timeframe. We’ve plotted this level and found that it has had multiple tests, showing significance with strong closures above it.
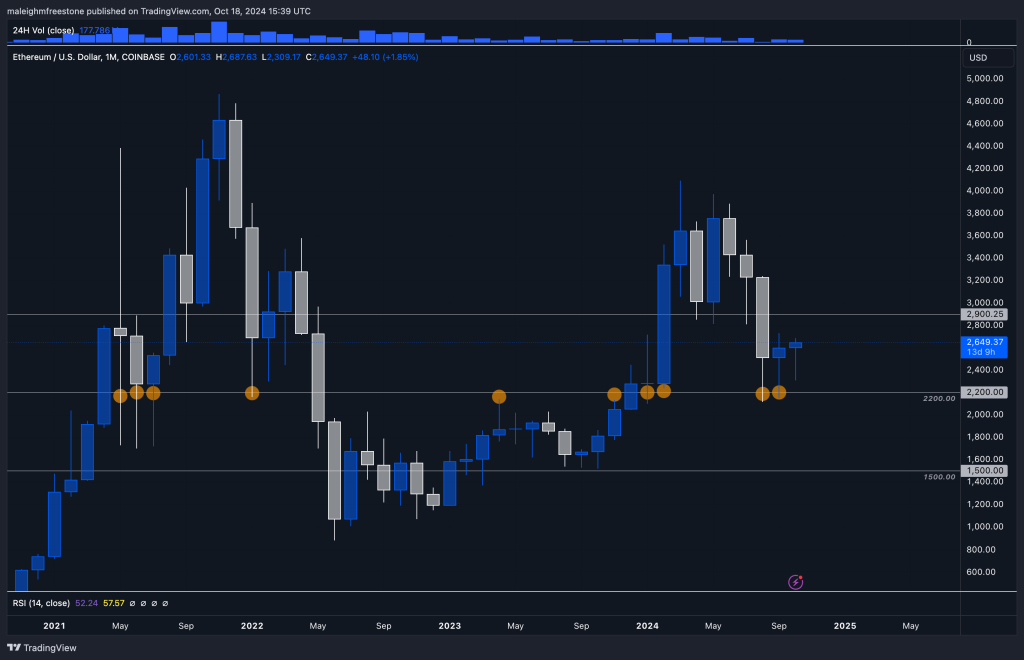
Rule of Thumb for Significant Levels (monthly time frame) When we plot a level, we look for multiple significant tests, meaning we want to see how the market reacted around that price point. A good example would be if a candlestick like a hammer formed around that level in the last 2 months, indicating that buyers pushed prices back up after sellers attempted to push them down. This is exactly what we’ve seen at $2,200.
After these tests, we saw Ethereum’s largest move of the cycle, confirming the importance of this level. As the market has reacted similarly in the past, we’ll likely continue to see a correlation around $2,200. Remember, a key level indicates where to buy and highlights the risks involved with trading around it.
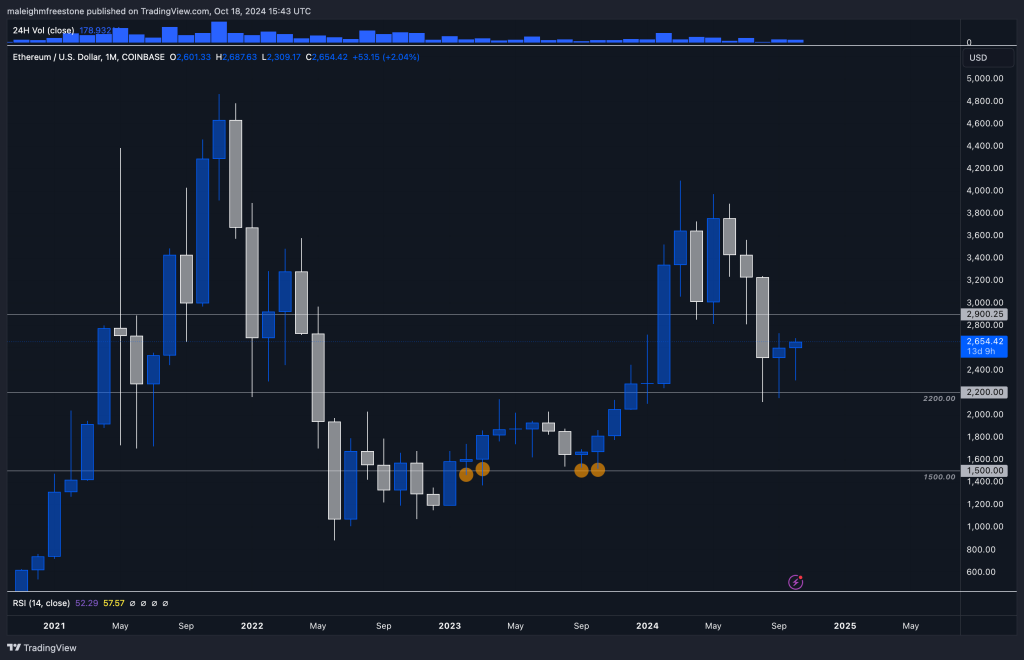
To determine further key levels, we apply our rule of thumb again and find that $1,500 is another important psychological level. Historically, this level has shown strong support and resistance.
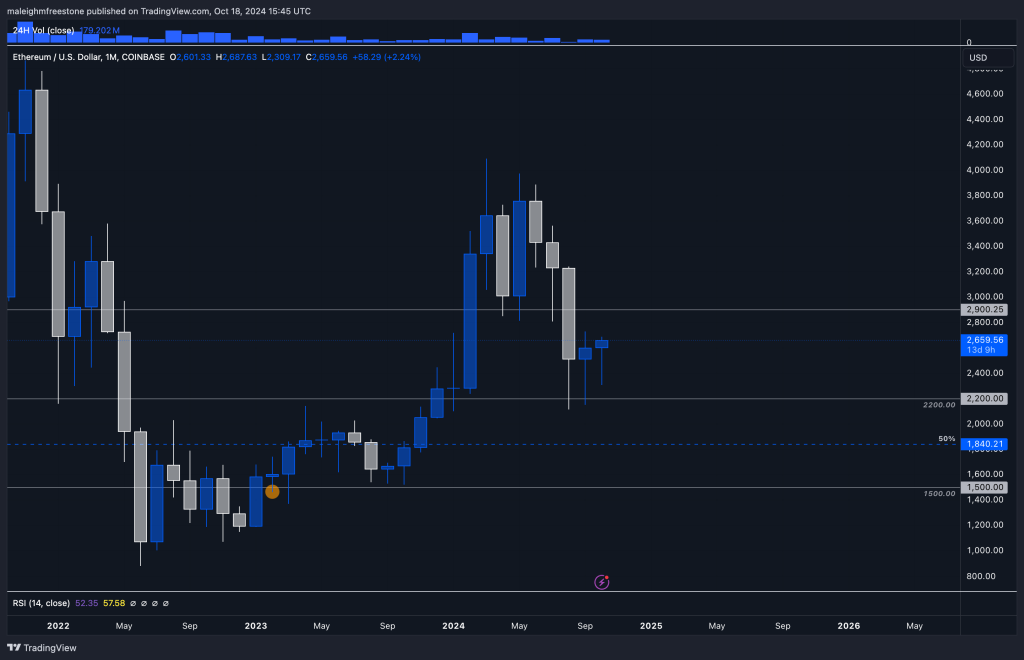
For more cautious traders, the 50% rule between these levels can also be helpful. It’s often effective to gauge where price might move next. Between $2,200 and $1,500, this gives us a mid-point that may provide additional context for traders.
Solana Key Levels
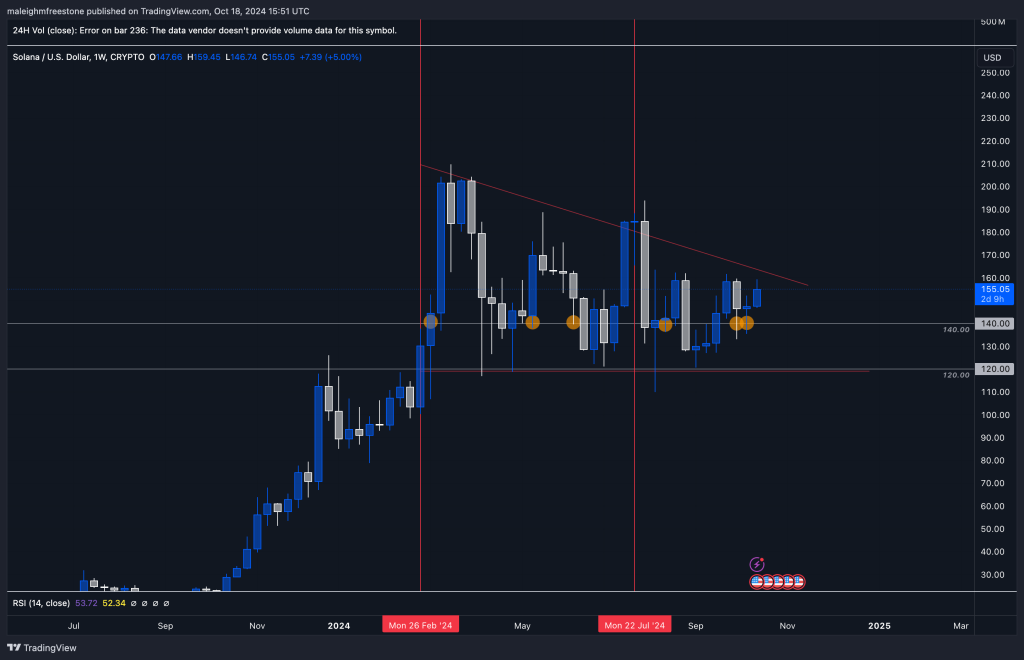
Now, let’s look at Solana. Our first major level for Solana is $120. Historically, this has been a key price point where buyers have propped up the market. It’s almost as if this level is holding the market together, as buyers continue to deem Solana valuable at $120.
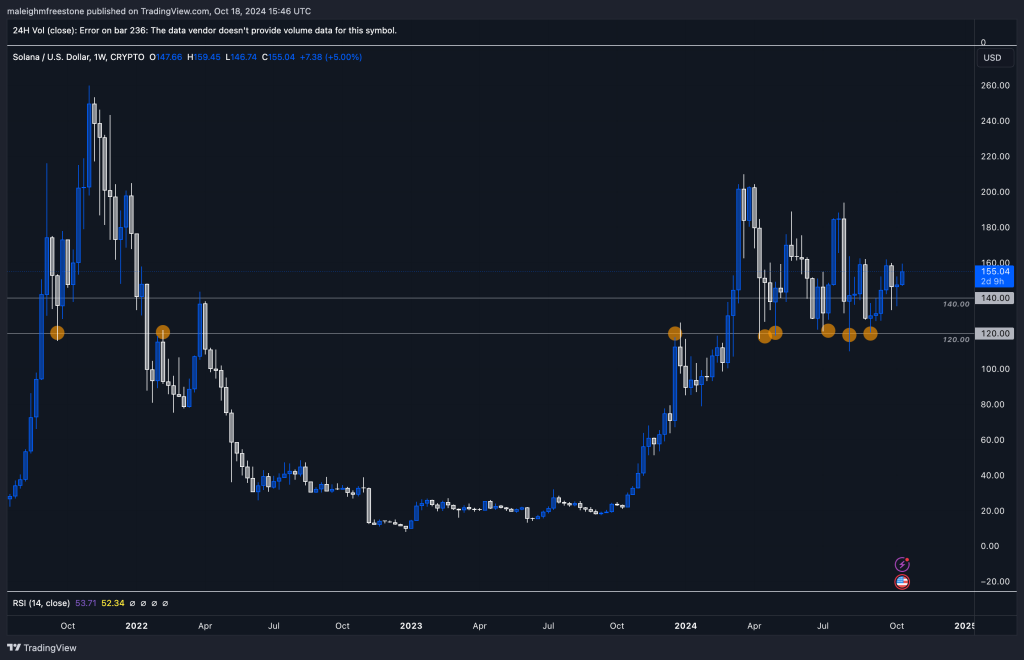
If we look closer at the daily timeframe, we can see that $140 is another key level for S
olana. The price action around this level, including wicks and double bottoms, confirms its importance.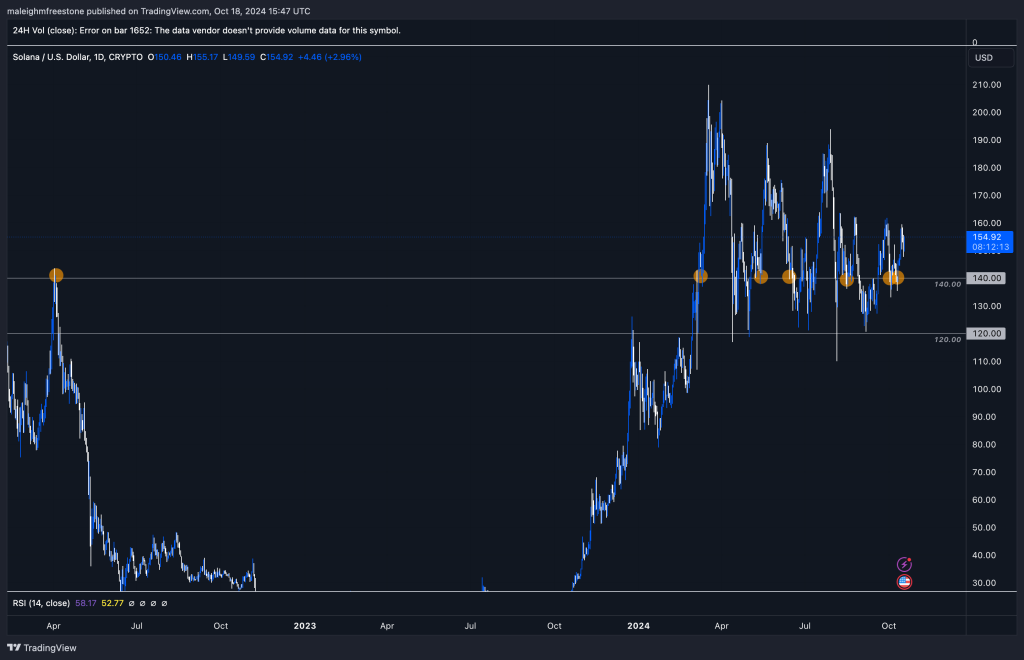
Contextualising the Markets: Ethereum vs. Solana
Now that we’ve identified key levels for both Ethereum and Solana, let’s look at how the market has traded around these levels and the context in which they’re situated.
For Ethereum, from February 24th to July 24th, we saw Ethereum trade between $2,900 and $4,000. However, after July, Ethereum fell to $2,200, marking a significant range change. In contrast, Solana’s support held around $120 during this same period, showing stronger price resilience.
Solana has demonstrated that its range bottom is $120, with the next key level being $140. These two levels are where the market has continuously found support and resistance, offering solid opportunities for positioning.
Risk Management and Trade Strategy
When trading these levels, it’s essential to factor in risk. For example, you could take a position in Ethereum at $2,200 with a 3x leverage trade, aiming for higher returns as the asset pushes back toward higher levels. On the other hand, Solana at $140 may require a more cautious approach, with a tighter stop loss to manage risk, knowing that if price drops, you may get a better entry around $120.
By using these key levels and understanding the market context, you can better position yourself to take advantage of market movements. The correlation between assets like Solana, Ethereum, and Bitcoin also helps in understanding broader market trends and applying strategies accordingly.
Conclusion: Correlation and Opportunities
Solana and Ethereum provide great opportunities this cycle, both from a risk management and a growth potential perspective. Understanding how these assets trade around their key levels and how they correlate with the wider market can help you take positions with confidence.
Remember, the goal is to manage your capital effectively, leveraging opportunities when they arise while protecting yourself from excessive downside risk.
Cryptonary’s Take
Ethereum and Solana are two assets poised for significant moves this cycle. Ethereum’s $2,200 level has proven its strength, and if this support holds, we’re likely to see further upside. Solana, with its key levels at $120 and $140, shows strong resilience, making these excellent zones for spot accumulation. While Ethereum presents a high-quality opportunity for larger allocations, Solana offers an attractive position with a tighter stop loss. The correlations between these two assets and the broader market give traders a chance to diversify strategies while managing risk efficiently. As always, managing capital wisely and positioning with precision will be the key to success in these trades.
Recommended from Cryptonary