Save 23% ($351) & Get a Free 1-1 Call with our Team ⏰ : 0d 2h 59m 43s
Freegame: Trendline Projections
Trendline projections are a powerful tool for mapping out potential future price reactions and sharpening your market view. This guide breaks down how to use trendlines to pinpoint key support and resistance levels, identify possible market movements, and level up your trading strategy.

By learning how to draw, validate, and incorporate trendline projections alongside other key analysis tools, you’ll start to see patterns that reveal where price is likely to react. Done right, trendlines give you a clearer read on where the market could be headed next.
Horizontal vs. Diagonal Levels: Understanding the Difference
In trading, the distinction between horizontal and diagonal levels is critical for developing a well-rounded strategy.- Horizontal Levels are static lines that mark areas where price consistently finds support or resistance. These levels are derived from multiple historical price interactions, making them reliable indicators for where buying or selling pressure may emerge.
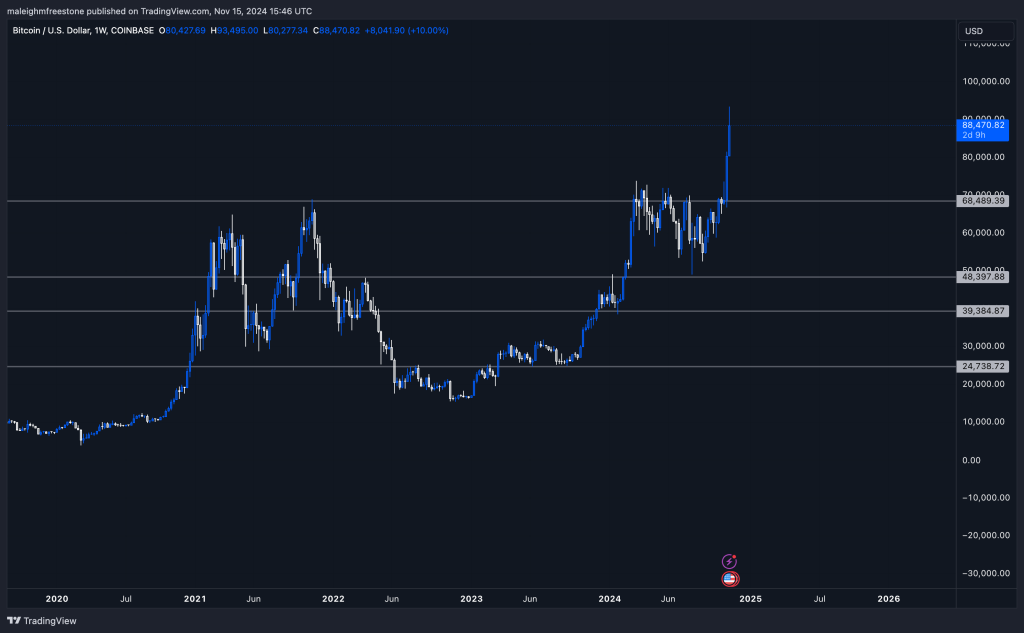
- Diagonal Levels (Trendlines), in contrast, are dynamic. They slope upward or downward, depending on the market trend, and are used to identify the direction of a trend. Diagonal levels can act as support in an uptrend or resistance in a downtrend. Unlike horizontal levels, their relevance changes with time as trendlines work best when used together.
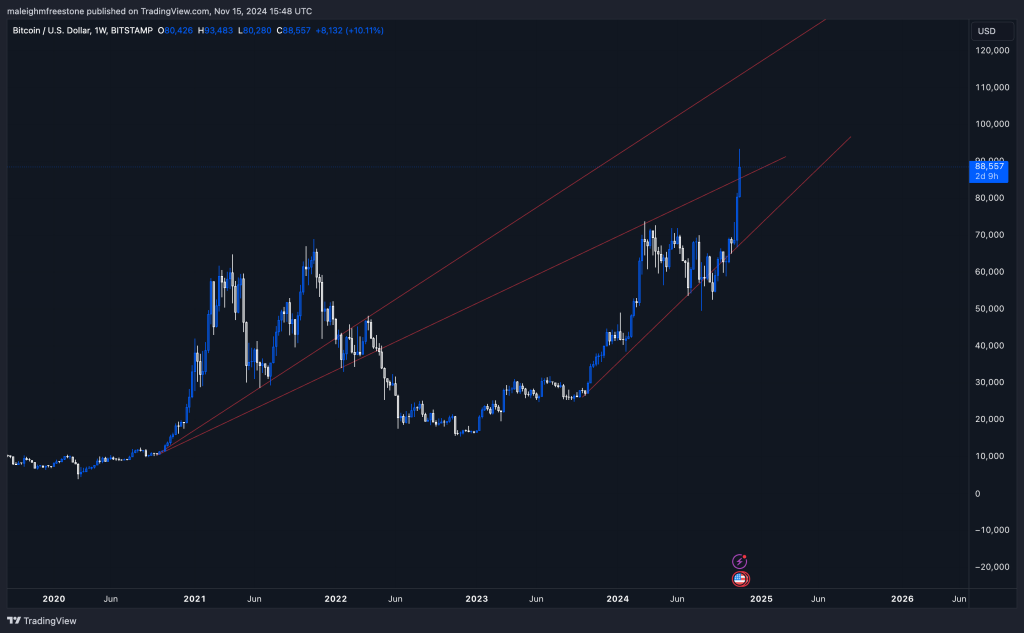 For example, an upward-sloping trendline intersecting a horizontal resistance level can provide a strong confluence point for potential market reversals or breakouts.
The Power of Trendline Projections
Trendline projections go beyond simply identifying current support and resistance. They leverage historical price behavior to map potential future levels where price may interact again. This concept is rooted in market rhythm and human behavior. Markets often "rhyme" because traders react similarly under similar circumstances, driven by collective decision-making and psychological patterns.Why Trendlines Work
- Market Rhythm: Price movements often follow patterns due to repetitive human behavior.
- Time-Relevance: Trendlines remain valid across long periods if drawn from significant swing points.
- Confluence: When trendlines align with other indicators (e.g., horizontal levels, funding rates), they become even more reliable.
How to Identify and Draw Valid Trendlines
The foundation of any trendline projection lies in identifying significant swing points—critical price levels where the market has reversed or paused. These points provide the basis for drawing accurate and meaningful trendlines.Steps to Draw a Trendline Projection
- Start at a Significant Swing Point: Identify a key level where price exhibited a meaningful reaction (e.g., a major low before a bull run or a peak before a correction).
- Connect the Points: Draw a line connecting multiple price interactions (e.g., two or more highs in a downtrend or lows in an uptrend).
- Extend into the Future: Project the line beyond the current price to identify potential future interaction points.
Trendlines often reveal their true power when viewed over extended timeframes, demonstrating how past levels remain relevant even after years.
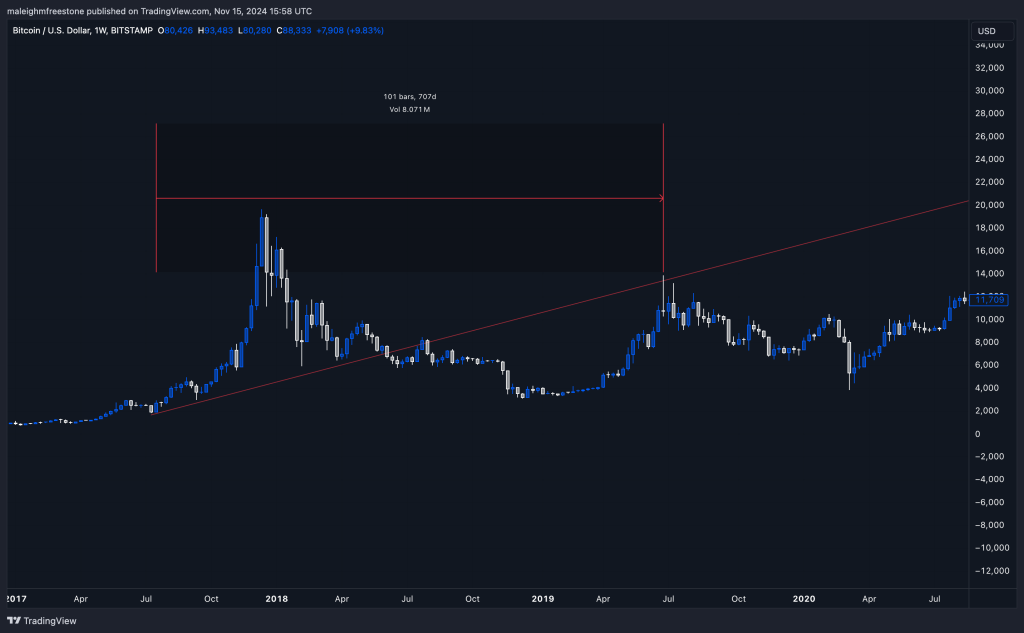
Case Study 1: The 700-Day Trendline
- Starting Point: A significant low during a previous market cycle.
- Observations: The trendline was tested multiple times as support before flipping to resistance, with the final test occurring 700 days later.
- Outcome: This projection remained relevant for nearly two years, highlighting its utility for mapping future movements.
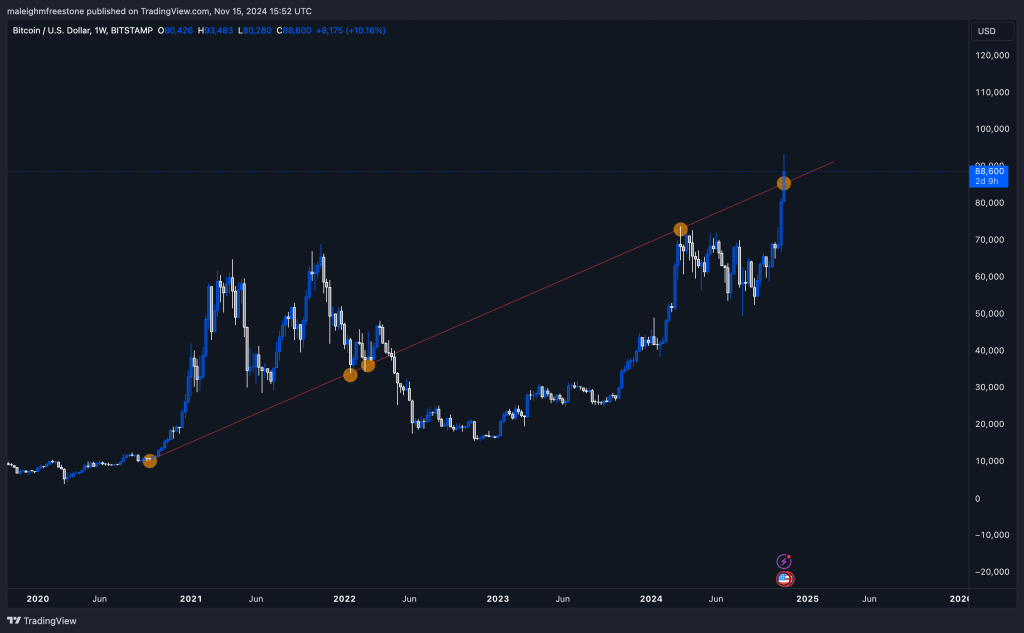
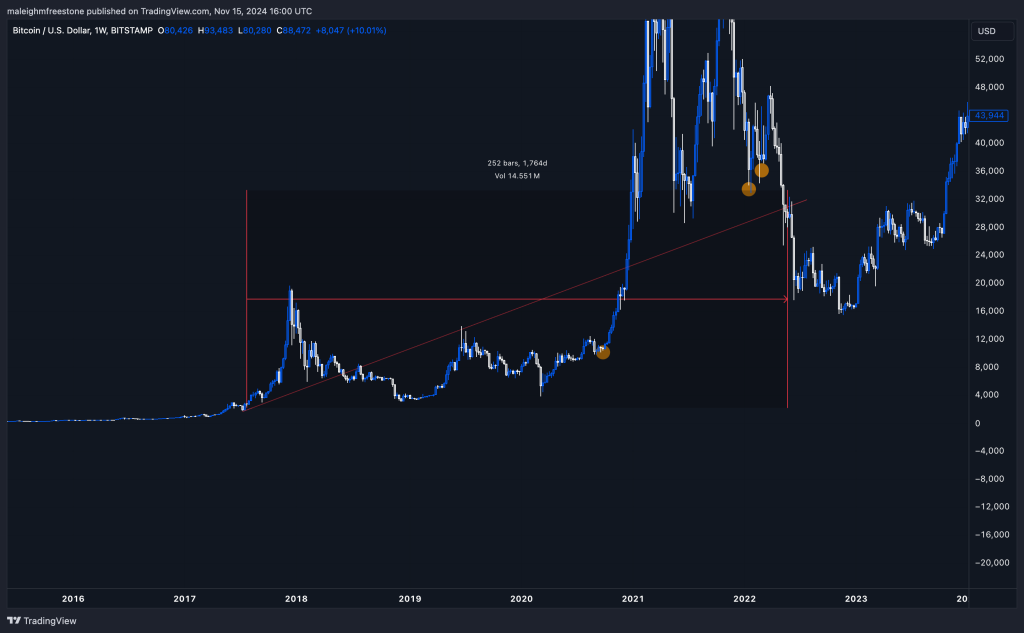
Case Study 2: The 1,700-Day Trendline
- Starting Point: A key support level during the 2021 bull run.
- Observations: The trendline accurately marked resistance and support levels across 1,700 days, demonstrating its long-term reliability.
- Outcome: Even after years, the trendline served as a guide for potential market reversals.
Combining Trendlines with Other Tools
Trendlines become exponentially more powerful when used alongside other analytical tools. For example:- Horizontal Levels: Aligning diagonal trendlines with horizontal support or resistance enhances their reliability.
- Market Mechanics: Incorporate funding rates, open interest, and liquidation levels to validate trendlines.
- Sentiment Analysis: Use trendlines within the context of broader market sentiment to ensure they align with the overall bias.
- Focus on Key Swing Points: Always draw trendlines from significant swing highs or lows for maximum accuracy.
- Use Higher Timeframes: Weekly and daily timeframes provide the most reliable trendlines.
- Keep Charts Clean: Avoid cluttering your charts with excessive projections; use only the most relevant lines.
- Revalidate Regularly: As new price data emerges, revisit and adjust your trendlines to maintain accuracy.
- Project Forward: Use past trends to hypothesize where future interactions may occur.
Future Mapping: Projections in Action
Trendline projections are not just about the past—they help map future price levels. For instance:- A trendline drawn today could align with a significant resistance level years from now.
- If market sentiment and technical indicators align with this level, it could serve as a valuable reference for profit-taking or entry decisions.
Cryptonary's Take
Trendline projections are a powerful addition to any trader’s toolkit. By starting with significant swing points and validating their relevance over time, traders can map future levels with surprising accuracy. When combined with horizontal levels, sentiment analysis, and market mechanics, trendlines offer a comprehensive approach to market mapping.Adopt these methods consistently, and you’ll discover the effectiveness of trendline projections in guiding your trades. As always, keep refining your approach and let the data inform your decisions.
Recommended from Cryptonary


