Save 23% ($351) & Get a Free 1-1 Call with our Team ⏰ : 0d 2h 59m 43s
Understanding Wedge Patterns in Trading
When looking at wedge patterns, it’s important to remember that you always want to align any pattern or candlestick formation with key levels, market context, and sentiment. Don’t just throw in a pattern if it doesn’t align with the overall case you’re building. Your goal is to build evidence that supports your initial argument. You wouldn’t try to convict someone of murder by introducing unrelated evidence, right? The same principle applies here. Everything should fit the direction and context of the market you’re analysing.Building a Case for a Wedge
Once you’ve identified your key levels and you see a wedge forming at these levels, that’s when you can start building your case. If you’ve been planning to bid from a key level and you see a wedge pattern form, it’s a strong signal that your argument to bid may be correct.But don’t force it. Don’t go looking for wedges on small timeframes just to fit your bias. That’s how you end up with analysis paralysis and stray away from your plan. Stick to the bigger picture and your initial case.
What is a Wedge Pattern?
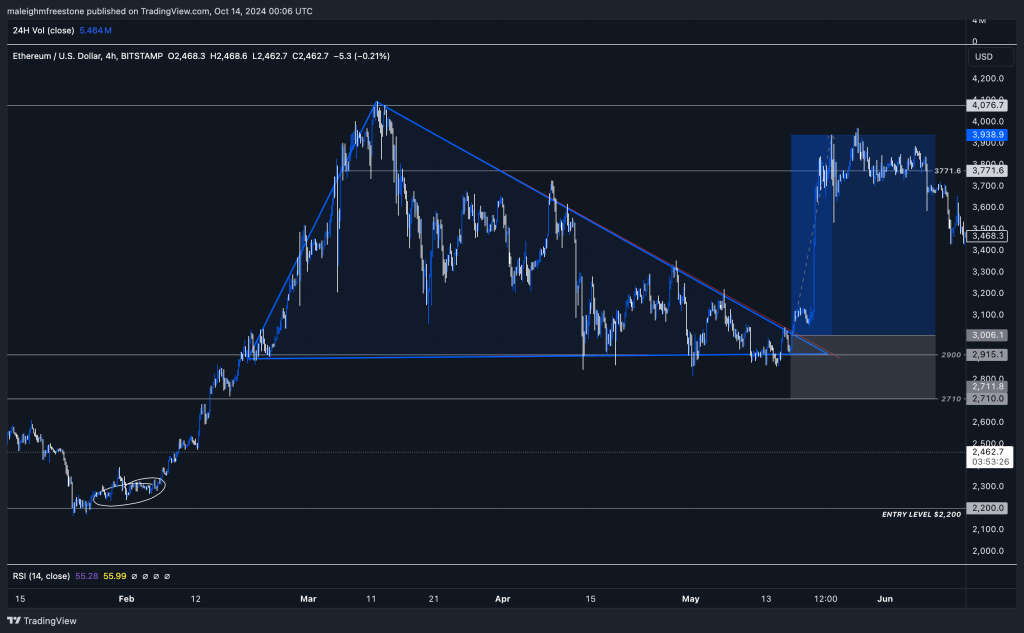
Let’s break down the psychology behind a wedge pattern. What does it represent? Essentially, a wedge pattern forms when the market comes from a bullish position, but starts to show some exhaustion. You’ll see price push out and test resistance or a key market level, fail to hold, come back down to retest, and repeat this process.What happens is the market seems like it’s in a downtrend, but you’ll notice that it isn’t forming lower lows. Buyers continue to step in at a key level, creating support. This is what forms the bottom of the wedge. Over time, pressure builds up in this tightening range, until eventually, the market breaks to the upside.
The Psychology Behind Wedges
The psychology here is clear: buyers are refusing to give up. They are consistently defending this level, and the sellers, while still active, are unable to push price lower. If the market was truly in a strong bearish trend, we would see lower highs and lower lows forming consistently. But that’s not what’s happening here.Instead, buyers are bidding consistently at a price level that they find attractive, and the market isn’t breaking lower. This leads to a consolidating pattern that eventually pops to the upside. We’ve seen this happen time and again, such as in Ethereum, where a strong wedge pattern signaled a massive reversal.
Real Examples
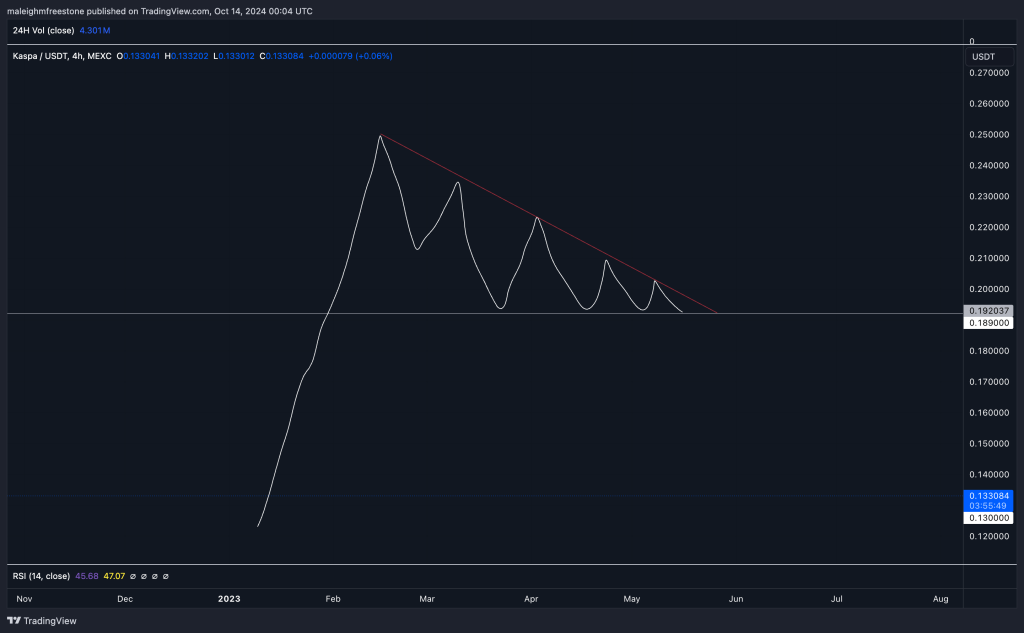
One of the best examples of a wedge pattern we’ve seen recently was in Kas. This pattern played out perfectly, with multiple tests of support, showing that buyers weren’t going anywhere. Every time sellers tried to push price lower, buyers stepped in and defended the level. Eventually, the market popped to the upside, just as expected.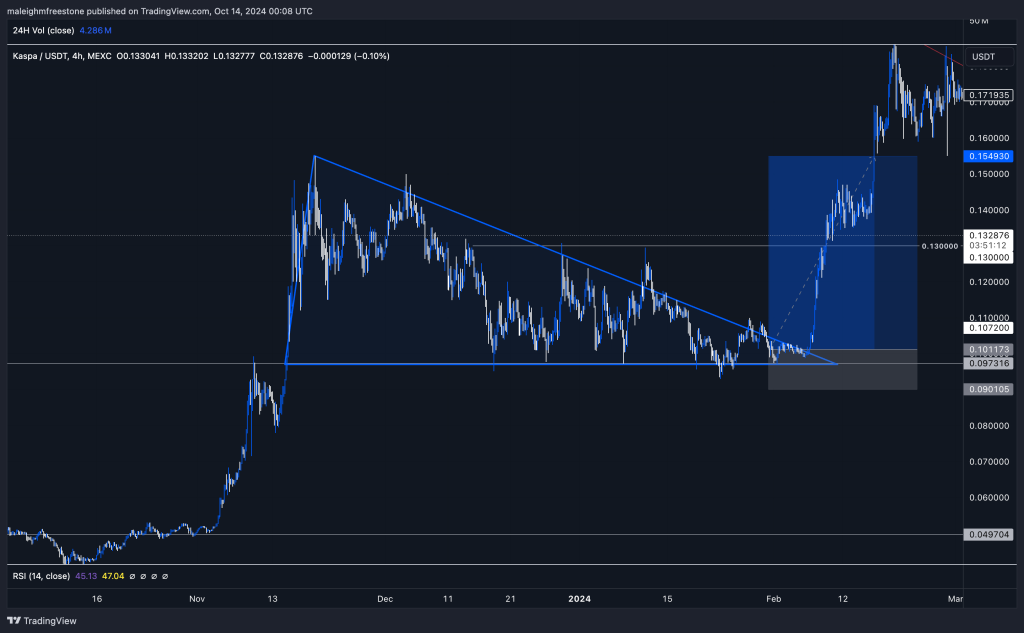
Using Wedges Effectively
Always remember to use wedge patterns in alignment with key psychological levels and your overall market context. For example, if you’re trading on a key level and you notice a wedge pattern forming after multiple tests of support, that’s a strong sign. If buyers are consistently holding the level, it suggests that they are preparing for a breakout to the upside.But don’t force things on smaller timeframes. Make sure the wedge pattern fits into the bigger picture you’ve already identified. When used correctly, wedges can be incredibly effective in spotting reversals and breakouts.
Key Takeaways
- Align wedge patterns with key levels and overall market context.
- Wedges signal buyers’ strength when price is unable to form lower lows.
- The psychology behind wedges is buyers refusing to give up, even as sellers try to push price lower.
- Look for multiple tests of support to confirm that buyers are defending the level.
- Don’t force patterns into your analysis just to fit your bias; stick to the bigger picture.
Understanding the Head and Shoulders Pattern
In this lesson, we’re diving into the Head and Shoulders pattern—why it’s significant, the market psychology behind it, and when to use it. It’s important to know when a pattern is valid and when it isn’t. The issue with the head and shoulders pattern is that it’s easy to spot, which means traders sometimes force it, thinking they’ve found a valid one when they haven’t. So, let’s break it down.Key Points for Using the Head and Shoulders
Every chart pattern or signal you identify should align with key psychological levels or other significant market levels. For example, a head and shoulders pattern only becomes useful when it’s trading into a key area where we expect a reversal. This applies not only to head and shoulders but to wedges, flags, and any other patterns you come across. Always make sure the pattern matches the key levels you’re interested in for that asset.
The Psychology Behind the Pattern
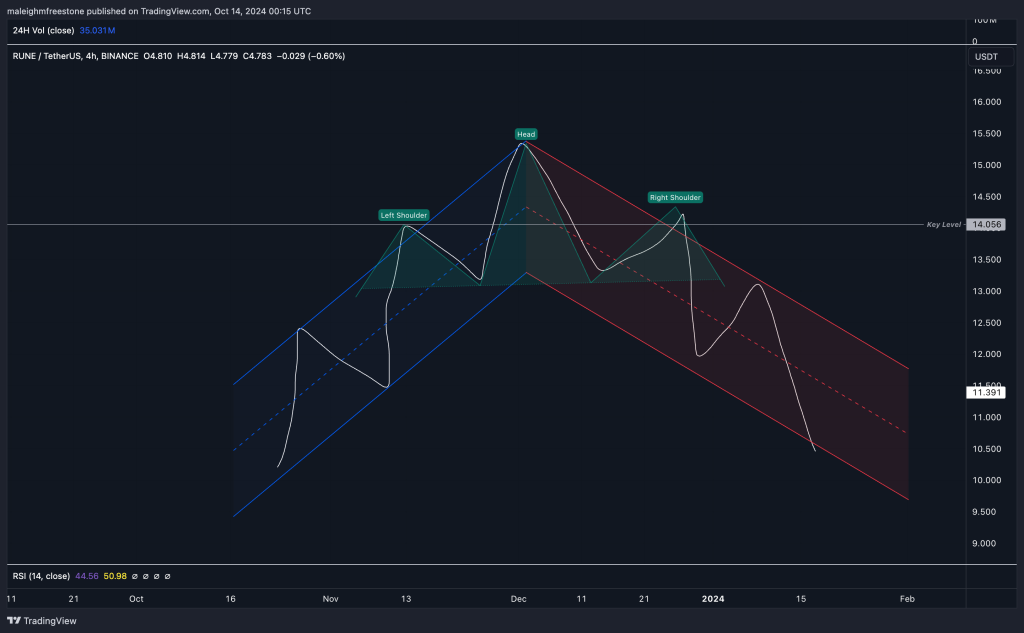
The head and shoulders is a reversal pattern, signalling a potential shift from bullish to bearish. Here’s how it works:- You have a series of higher highs and higher lows in a bullish trend.
- The head forms when price pushes to a new high but then fails to break above that level again, signalling exhaustion.
- The right shoulder is created when the price rallies but fails to reach the previous high, indicating weakening buyer strength.
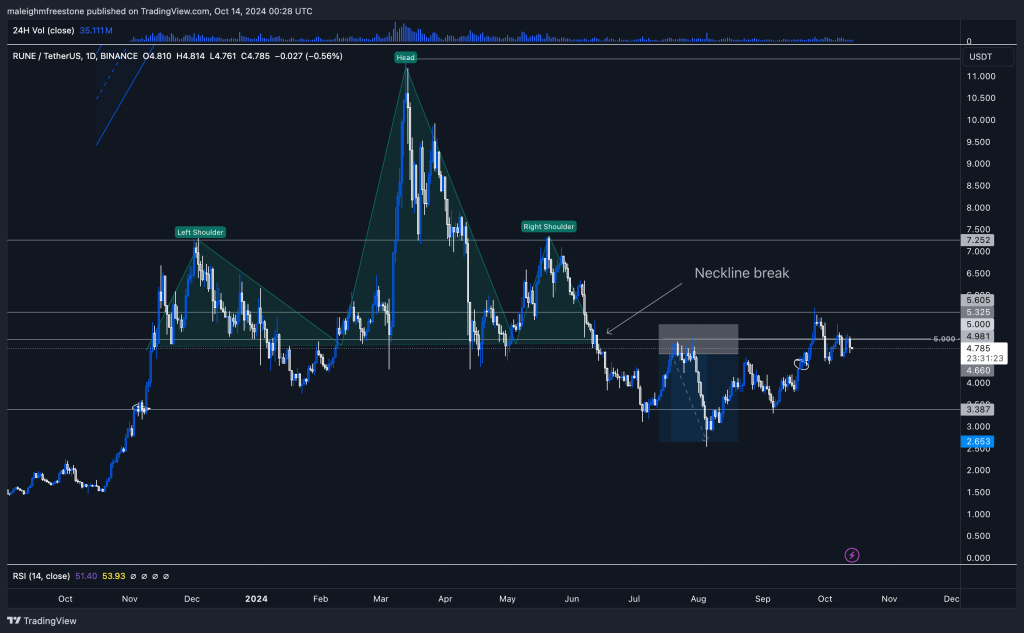
- Once the neckline breaks to the downside, the bullish trend transitions into a bearish one.
For the head and shoulders to be valid, it needs to occur around key psychological levels where a reversal is expected. For example, if price has been hitting resistance multiple times, and you notice a head and shoulders forming, the market is signaling exhaustion at that level.
However, it’s crucial to understand that not every head and shoulders pattern is going to play out. Sometimes, the market will print these patterns and continue the trend. A great example of this is in Popcat, where we saw head and shoulders form but without the neckline breaking. This shows that the market can still continue higher without confirming the reversal.
Inverted Head and Shoulders
The inverted head and shoulders works the same way, just flipped. Instead of a shift from bullish to bearish, it signals a reversal from bearish to bullish. We saw this beautifully on RUNE, where price came down, formed an inverted head and shoulders, broke the neckline, and then rallied higher.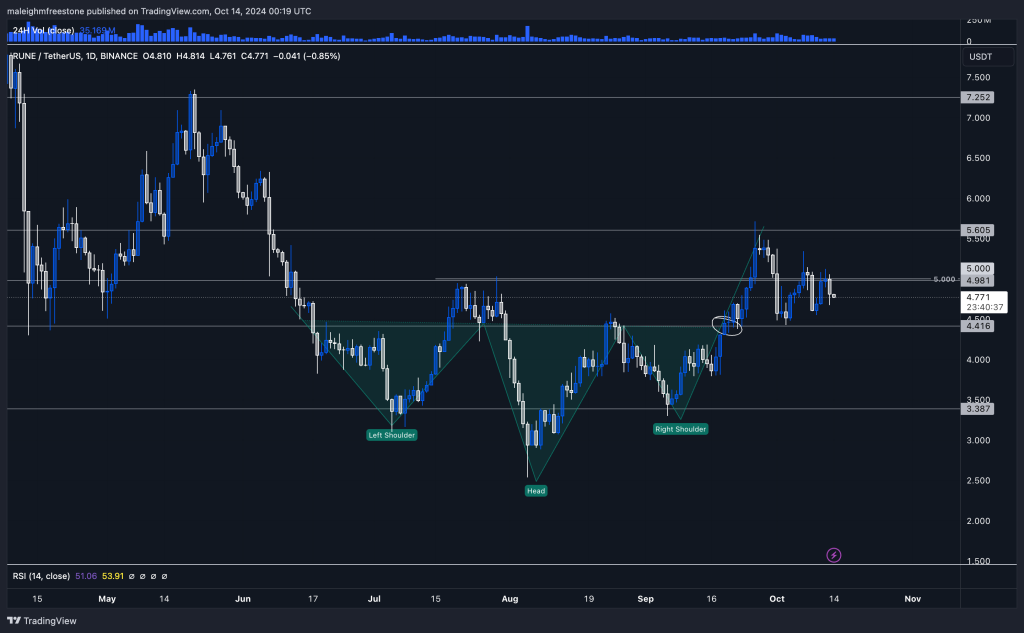
Popcat Example
Popcat printed a head and shoulders, but it never confirmed. The neckline wasn’t broken, and price continued higher after some brief consolidation. This highlights the importance of waiting for confirmation—if the neckline doesn’t break, the pattern isn’t valid.
Key Takeaways:
- The head and shoulders pattern is a powerful reversal tool, but it must align with key market levels to be valid.
- Always wait for confirmation before acting. If the neckline doesn’t break, the pattern isn’t confirmed.
- The inverted head and shoulders signals a shift from bearish to bullish, just like the regular pattern signals a shift from bullish to bearish.
- Look at the market psychology behind the pattern, not just the pattern itself. Understand what the buyers and sellers are doing at these key levels.
Continue reading by joining Cryptonary Pro
$1,548 $1,197/year
Get everything you need to actively manage your portfolio and stay ahead. Ideal for investors seeking regular guidance and access to tools that help make informed decisions.
For your security, all orders are processed on a secured server.
As a Cryptonary Pro subscriber, you also get:
3X Value Guarantee - If cumulative documented upside does not reach 300% during your 12-month membership, you can request a full refund. Terms
24/7 access to experts with 50+ years’ experience
All of our top token picks for 2025
On hand technical analysis on any token of your choice
Weekly livestreams & ask us anything with the team
Daily insights on Macro, Mechanics, and On-chain
Curated list of top upcoming airdrops (free money)
3X Value Guarantee
If cumulative documented upside does not reach 300% during your 12-month membership, you can request a full refund.
Our track record speaks for itself
With over 2.4M tokens and widespread misinformation in crypto, we cut through the noise and consistently find winning assets.
Our track record speaks for itself
With over 2.4M tokens and widespread misinformation in crypto, we cut
through the noise and consistently find winning assets.


Frequently Asked Questions
Can I trust Cryptonary's calls?
Yes. We've consistently identified winners across multiple cycles. Bitcoin under $1,000, Ethereum under $70, Solana under $10, WIF from $0.003 to $5, PopCat from $0.004 to $2, SPX blasting past $1.70, and our latest pick has already 200X'd since June 2025. Everything is timestamped and public record.
Do I need to be an experienced trader or investor to benefit?
No. When we founded Cryptonary in 2017 the market was new to everyone. We intentionally created content that was easy to understand and actionable. That foundational principle is the crux of Cryptonary. Taking complex ideas and opportunities and presenting them in a way a 10 year old could understand.
What makes Cryptonary different from free crypto content on YouTube or Twitter?
Signal vs noise. We filter out 99.9% of garbage projects, provide data backed analysis, and have a proven track record of finding winners. Not to mention since Cryptonary's inception in 2017 we have never taken investment, sponsorship or partnership. Compare this to pretty much everyone else, no track record, and a long list of partnerships that cloud judgements.
Why is there no trial or refund policy?
We share highly sensitive, time-critical research. Once it's out, it can't be "returned." That's why membership is annual only. Crypto success takes time and commitment. If someone is not willing to invest 12 months into their future, there is no place for them at Cryptonary.
Do I get direct access to the Cryptonary team?
Yes. You will have 24/7 to the team that bought you BTC at $1,000, ETH at $70, and SOL at $10. Through our community chats, live Q&As, and member only channels, you can ask questions and interact directly with the team. Our team has over 50 years of combined experience which you can tap into every single day.
How often is content updated?
Daily. We provide real-time updates, weekly reports, emergency alerts, and live Q&As when the markets move fast. In crypto, the market moves fast, in Cryptonary, we move faster.
How does the 3X Value Guarantee work?
We stand behind the value of our research. If the documented upside from our published research during your 12-month membership does not exceed three times (3X) the annual subscription cost, you can request a full refund. Historical context: In every completed market cycle since 2017, cumulative documented upside has exceeded 10X this threshold.
TermsRecommended from Cryptonary