Save 23% ($351) & Get a Free 1-1 Call with our Team ⏰ : 0d 2h 59m 43s
Tutorial: On-Chain Analysis
Thanks to blockchain technology, cryptocurrency investors have greater access to crucial information than in most other markets. This is due to the fact that blockchains, at their core, are public ledgers that anyone can access. The ability to view transaction and market data quickly and freely has led to a new area of research specific to cryptocurrency: on-chain analytics. Learning more about on-chain analysis can help even novice investors gain more insight into the crypto market.
In this tutorial, we’ll take a look at what on-chain analysis is, the different tools investors use to gather on-chain data, and walk through using Etherscan, the main tool used for on-chain analytics with the Ethereum blockchain.
What is on-chain analysis?
On-chain analysis is the use of publicly available blockchain information to inform crypto trading strategies. At its core, all it involves is tracking transactions.Blockchains contain a wealth of data, including transaction amounts, sending and receiving wallet addresses, fees, and timestamps. This information is used by analysts to predict movements of a particular coin or token in the cryptocurrency market.
How does it work?
On-chain analysis is conducted by using a blockchain explorer. Blockchain explorers can be used to confirm if a transaction has successfully gone through but can do a lot more when combined with other graphical interfaces, like Dune Analytics and Nansen AI. Tools like these help users visualize blockchain explorer data and can aggregate certain metrics together, such as the amount of ETH held on centralized exchanges.For example, just using a blockchain explorer, investors can view total market capitalization, the number of active wallet addresses, how many daily transactions are taking place, and how many unique wallets are added to a network daily. Figures like these can be used to gauge the actual use of a blockchain and the enthusiasm in the market.
On-chain analysis involves both macro and micro analysis. Macro analysis could involve looking at general charts like monthly transaction volume, while micro analysis involves combing through individual wallet addresses.
What are blockchain explorers?
Blockchain explorers are simply websites used to track the price movements, market capitalization, and other more detailed information about a blockchain. As there are numerous blockchains out there, there are different blockchain explorers, too.If you want to specifically track transactions on the Ethereum network, a well-known blockchain explorer for doing so is Etherscan. Solana holders may use Solscan. There are also blockchain explorers like BitInfoCharts that allow you to look into different blockchains on the same site.
Etherscan Tutorial
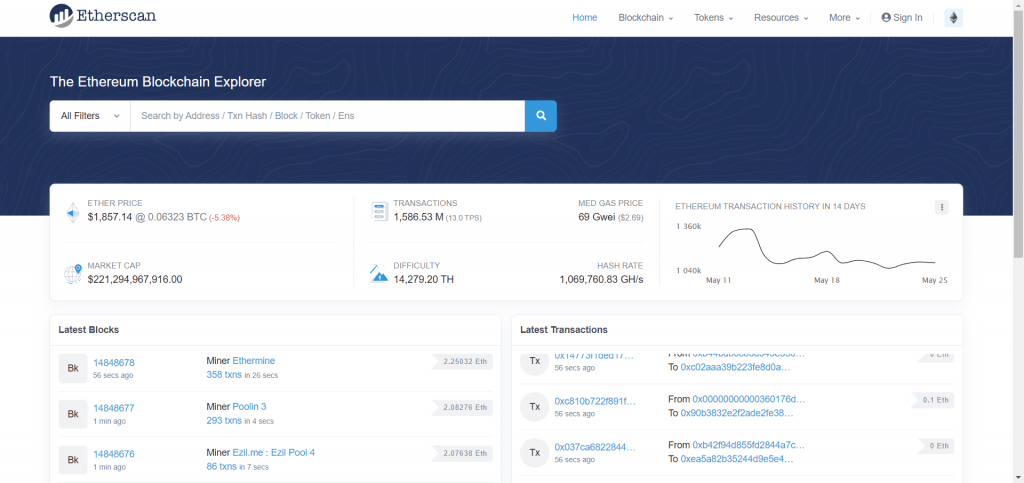
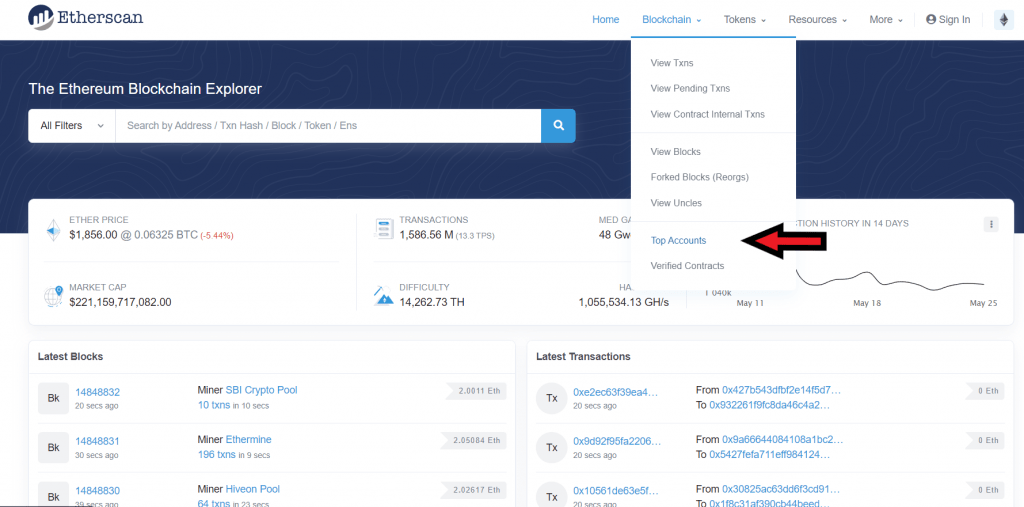
Note: The focus of this tutorial will be on Etherscan, the previously mentioned blockchain explorer for Ethereum. Many of the ideas presented here are applicable to other blockchain explorers.First, go to Etherscan’s homepage, located at etherscan.io. Presented on this homepage is a search bar for looking up individual wallet addresses and other specific values, general metrics including ETH’s current price and current market capitalization, the most recently produced blocks, and the most recent transactions.
From here, let’s take a look at the supply distribution of ETH. This can be done by hovering over ‘Blockchain’ in the navigation bar and clicking on ‘Top Accounts’ in the dropdown.
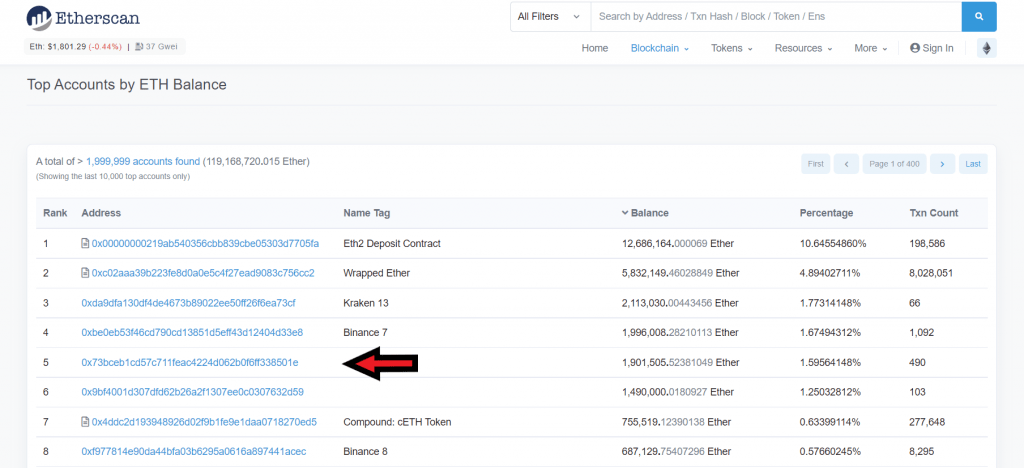
Like most other pages on Etherscan, there’s a lot of information here, but let’s focus on three columns: ‘Address,’ ‘Name Tag,’ and ‘Percentage.’
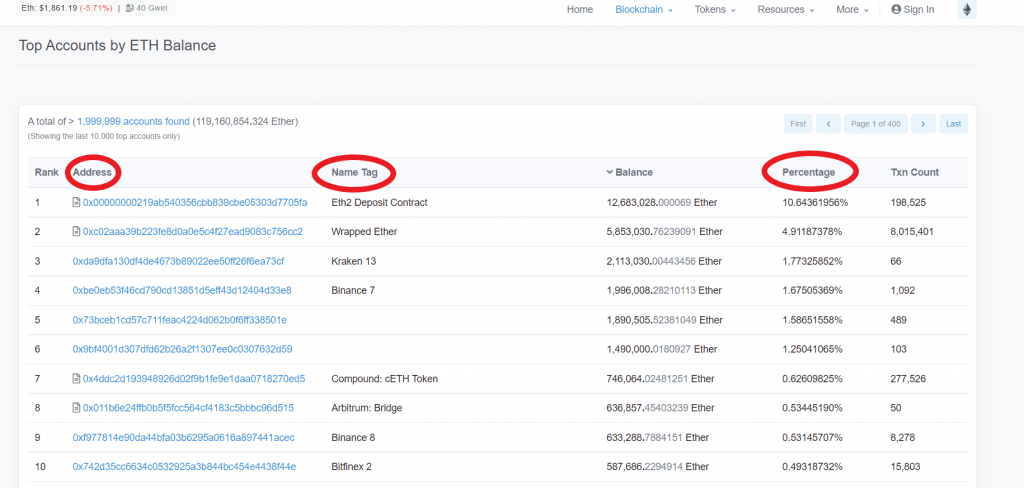
The data on this page shows the top wallets in the Ethereum network. Some of these are smart contracts (denoted by the paper icon to the left of the wallet address), some are accounts owned by large exchanges (like Kraken and Binance), and some don’t have an identity associated with them.
The percentage column is particularly important, as it shows the distribution of the current circulating supply of ETH. Over 10% of ETH is currently staked in the ETH2 Deposit Contract, meaning it can’t be unstaked and sold until after Ethereum’s transition to proof-of-stake consensus.
The fact that ETH is so well distributed means that larger investors can’t flood the market with their coins and drive the price down. Coin distribution is a key metric to keep an eye on when investing in a project.
Next, let’s explore some of the resources offered by Etherscan under the ‘Resources’ tab. Hover over it in the top navigation bar and select ‘Charts & Stats.’
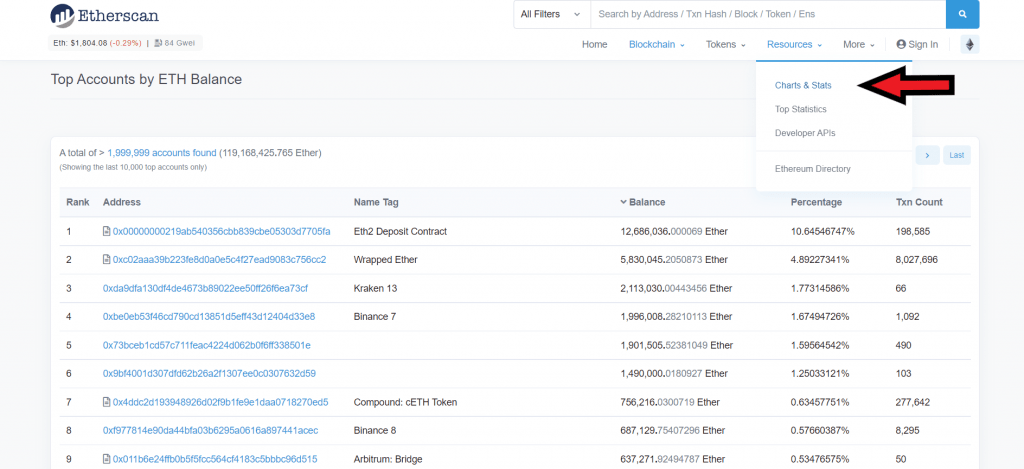
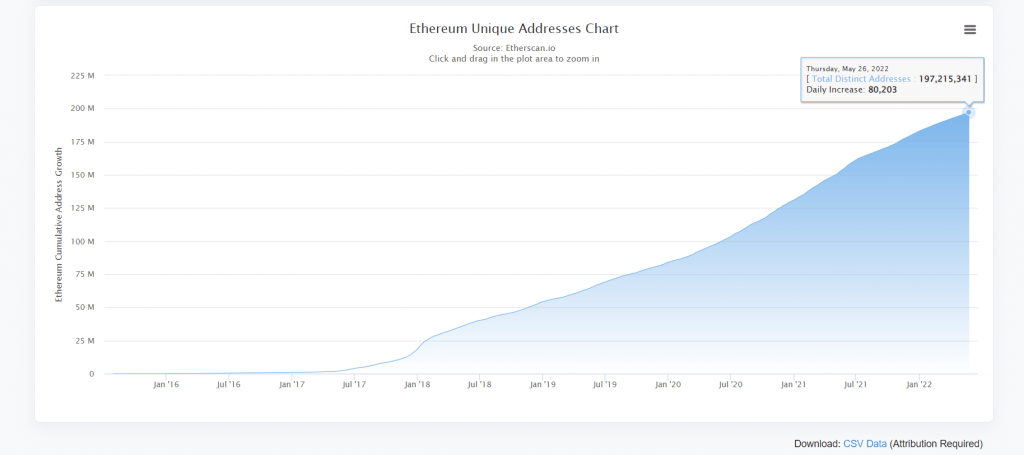
This page provides a lot of useful information such as market data and network data, but for this tutorial, we’re interested in blockchain data. Scroll down until the section ‘Blockchain Data’ appears and let’s dive into one of the charts here - ‘Unique Addresses.’
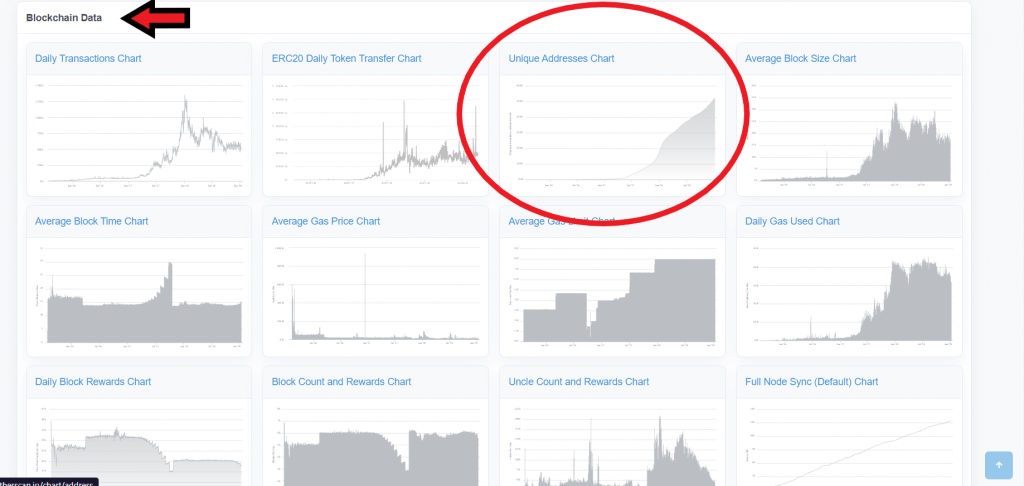
The number of unique wallet addresses being created can be seen as a measure of how quickly a network is growing. From this chart, we can see that the daily amount of new Ethereum wallet addresses is currently levelling off with numbers consistently below 100,000 per day.
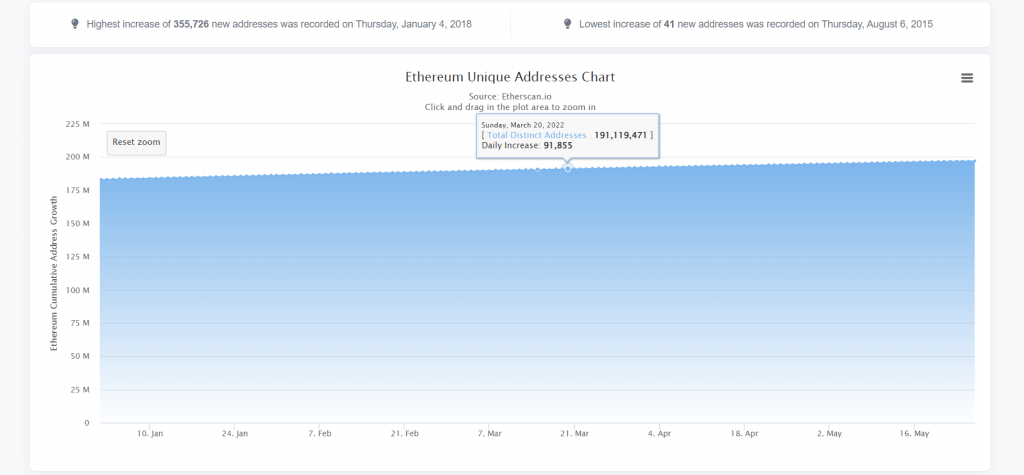
We can confirm this by zooming into the end of the chart by clicking and dragging on the portion we want to isolate. Let’s click and drag from about the ‘Jan ‘22’ point to see unique addresses created this year.
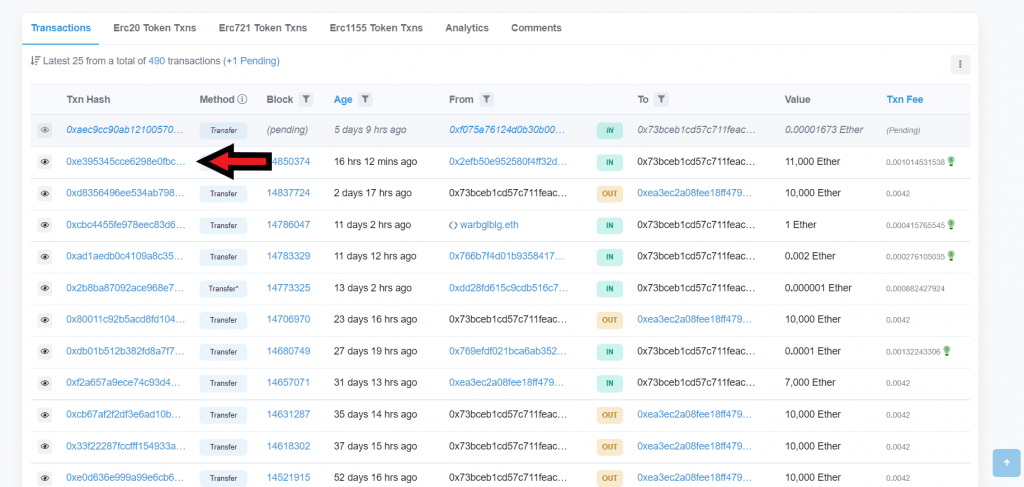
Next, let’s take a look at an individual wallet and its transactions. Navigate back to the ‘Top Accounts’ page and click on the wallet address that begins with 0x73bc. The owner of this wallet is not displayed, but given that most exchange wallets are identified, we can speculate that this wallet belongs to an individual or group outside of an exchange.
This takes us to the individual wallet page, which displays the total account balance, its value in USD, and the value of any tokens the wallet owns. It also has a list of the latest 25 transactions conducted by the wallet, where ‘IN’ means coming into the wallet and ‘OUT’ means leaving it.
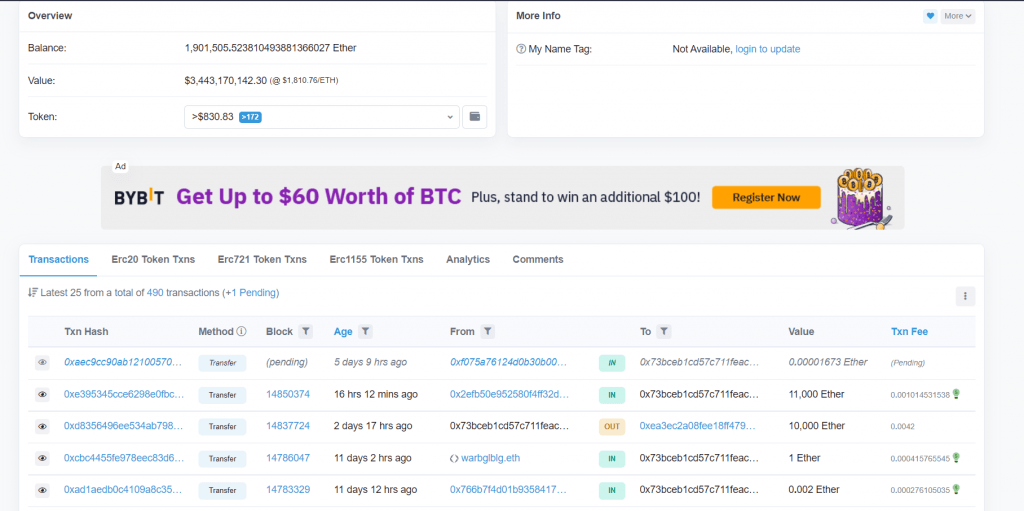
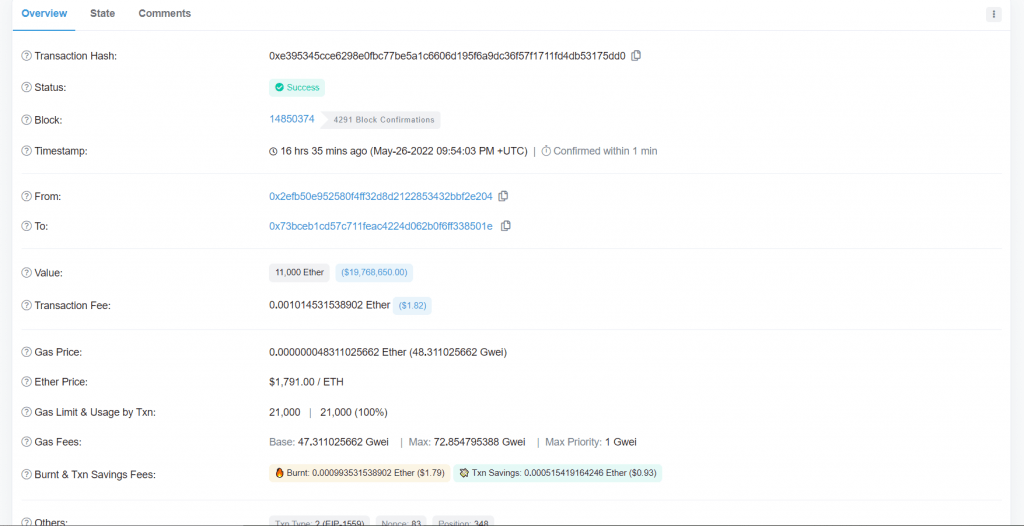
To view the details of an individual transaction, click on the transaction hash under the ‘Txn Hash’ column. For this tutorial, let’s look at the transaction that starts with 0xe39.
After arriving on the transaction’s page, click the ‘Click to see More’ link to unfold more information about the transaction. From here we can see granular details about the transaction, from its timestamp to the amount of gas that was paid to complete the transaction.
CryptoQuant Tutorial
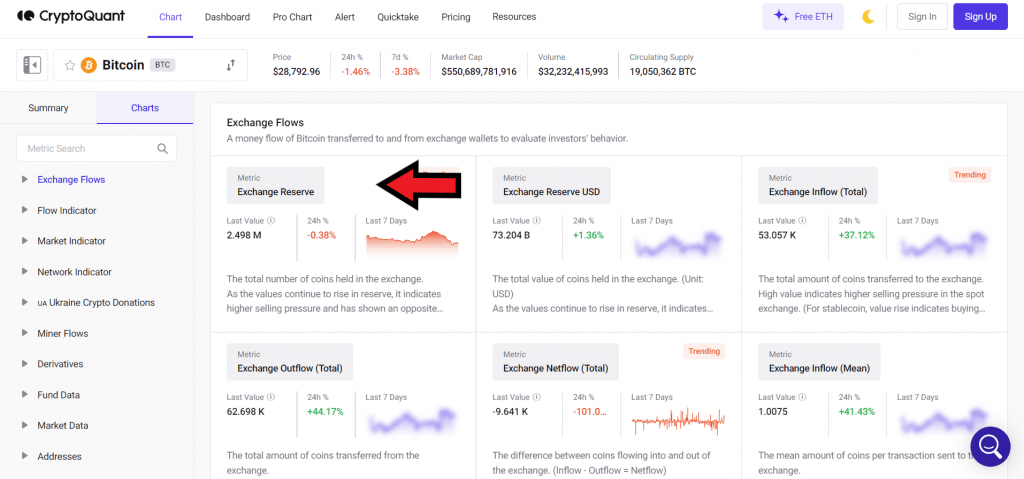
While blockchain explorers like Etherscan are extremely useful for both macro and micro analysis of blockchain data, other tools excel at looking at macro trends in the crypto market. For this tutorial, let’s briefly take a look at the default homepage of CryptoQuant.Navigate to the CryptoQuant homepage found at www.cryptoquant.com. The homepage defaults to Bitcoin metrics.
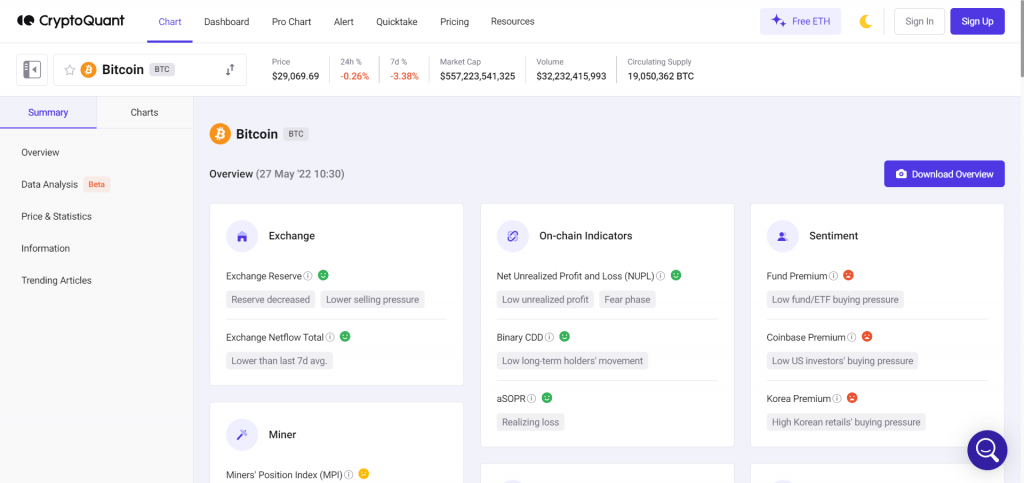
The metrics presented, such as exchange reserves and overall market sentiment, provide a quick overview of the state of the market. Specific explanations of how the metrics are derived are beyond the scope of this tutorial, but for now, let’s focus on the ‘Exchange’ section and the ‘Sentiment’ section.
The ‘Exchange’ section shows whether or not investors are moving their assets onto exchanges - a sign that could mean they are selling. The sentiment section shows the buying pressures of different market participants, like institutional investors in the US and retail investors in South Korea. You can hover over the small circle ‘i’ icon to learn more about each metric.
Clicking the ‘Charts’ tab located next to the ‘Summary’ tab allows us to see some of this information in chart form. Let’s look at the ‘Exchange Reserves’ chart by clicking on it.
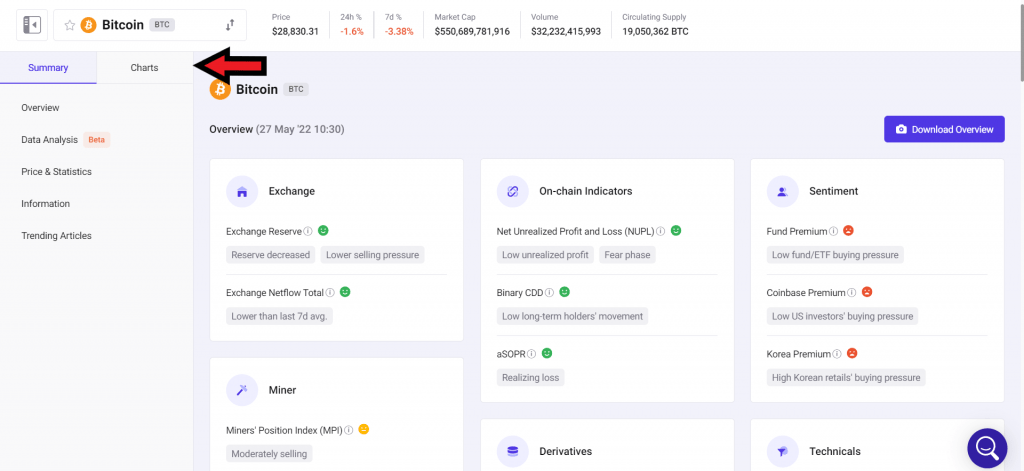
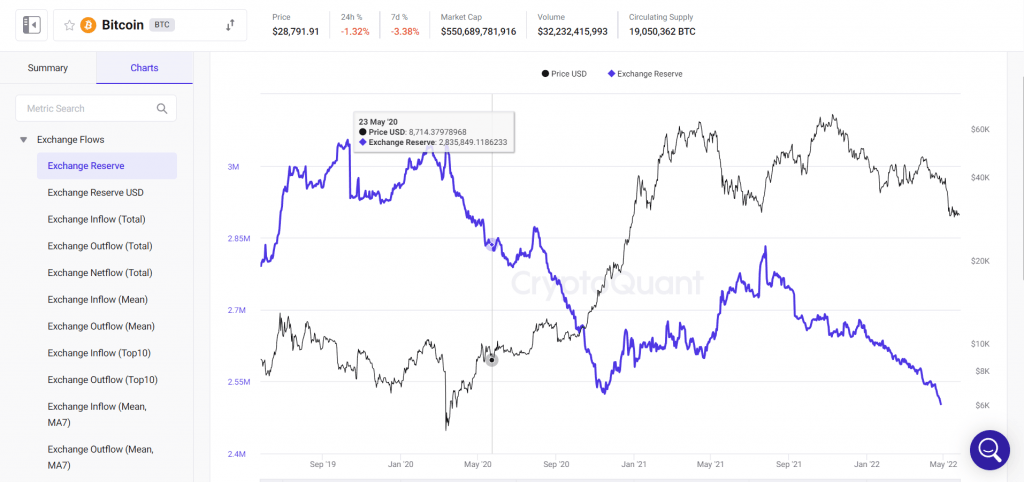
This chart represents the reserves of all cryptocurrency exchanges. Declining reserves could mean that more investors are buying and then pulling their crypto off of exchanges to put into individual wallets.
Disclaimer: THIS IS NOT FINANCIAL OR INVESTMENT ADVICE. Only you are responsible for any capital-related decisions you make, and only you are accountable for the results.
If you found this tutorial useful, make sure to comment and share! Also, let us know what tutorials you’d like to see next!
Master On-Chain Analysis & Elevate Your Crypto Game
On-chain analysis gives you a serious edge in crypto investing—but having the right insights at the right time is key. That’s where Cryptonary comes in.🚀 230,000+ investors trust our research 📊 Exclusive on-chain & market insights 📈 Actionable buy & sell signals
Start your 7-day free trial today and level up your crypto strategy! 💡🔗
Continue reading by joining Cryptonary Pro
$0
Get everything you need to actively manage your portfolio and stay ahead. Ideal for investors seeking regular guidance and access to tools that help make informed decisions.
For your security, all orders are processed on a secured server.
As a Cryptonary Pro subscriber, you also get:
3X Value Guarantee - If cumulative documented upside does not reach 300% during your 12-month membership, you can request a full refund. Terms
24/7 access to experts with 50+ years’ experience
All of our top token picks for 2025
On hand technical analysis on any token of your choice
Weekly livestreams & ask us anything with the team
Daily insights on Macro, Mechanics, and On-chain
Curated list of top upcoming airdrops (free money)
3X Value Guarantee
If cumulative documented upside does not reach 300% during your 12-month membership, you can request a full refund.
Our track record speaks for itself
With over 2.4M tokens and widespread misinformation in crypto, we cut through the noise and consistently find winning assets.
Our track record speaks for itself
With over 2.4M tokens and widespread misinformation in crypto, we cut
through the noise and consistently find winning assets.


Frequently Asked Questions
Can I trust Cryptonary's calls?
Yes. We've consistently identified winners across multiple cycles. Bitcoin under $1,000, Ethereum under $70, Solana under $10, WIF from $0.003 to $5, PopCat from $0.004 to $2, SPX blasting past $1.70, and our latest pick has already 200X'd since June 2025. Everything is timestamped and public record.
Do I need to be an experienced trader or investor to benefit?
No. When we founded Cryptonary in 2017 the market was new to everyone. We intentionally created content that was easy to understand and actionable. That foundational principle is the crux of Cryptonary. Taking complex ideas and opportunities and presenting them in a way a 10 year old could understand.
What makes Cryptonary different from free crypto content on YouTube or Twitter?
Signal vs noise. We filter out 99.9% of garbage projects, provide data backed analysis, and have a proven track record of finding winners. Not to mention since Cryptonary's inception in 2017 we have never taken investment, sponsorship or partnership. Compare this to pretty much everyone else, no track record, and a long list of partnerships that cloud judgements.
Why is there no trial or refund policy?
We share highly sensitive, time-critical research. Once it's out, it can't be "returned." That's why membership is annual only. Crypto success takes time and commitment. If someone is not willing to invest 12 months into their future, there is no place for them at Cryptonary.
Do I get direct access to the Cryptonary team?
Yes. You will have 24/7 to the team that bought you BTC at $1,000, ETH at $70, and SOL at $10. Through our community chats, live Q&As, and member only channels, you can ask questions and interact directly with the team. Our team has over 50 years of combined experience which you can tap into every single day.
How often is content updated?
Daily. We provide real-time updates, weekly reports, emergency alerts, and live Q&As when the markets move fast. In crypto, the market moves fast, in Cryptonary, we move faster.
How does the 3X Value Guarantee work?
We stand behind the value of our research. If the documented upside from our published research during your 12-month membership does not exceed three times (3X) the annual subscription cost, you can request a full refund. Historical context: In every completed market cycle since 2017, cumulative documented upside has exceeded 10X this threshold.
TermsRecommended from Cryptonary