Save 23% ($351) & Get a Free 1-1 Call with our Team ⏰ : 0d 2h 59m 43s
Guide: What is Technical Analysis (TA)?
The crypto market ebbs and flows, and seasoned traders believe that using Technical Analysis (TA) to capitalise on those patterns can lead to success. But Technical Analysis is hard, and learning to do it successfully takes a lot of time and patience. Let’s go through some of the basics.
What is Technical Analysis?
Technical analysts believe that human psychology is what drives markets. Human emotions like fear and greed follow surprisingly common patterns, and with the right analysis and use of candlestick charts, they can often be predicted.TA has proven to be a powerful trading tool, but there are other factors you need to keep in mind when developing a trading strategy, like tokenomics, network activity, use-cases, the development team, notable partnerships, and other macro-indicators.
Fundamental vs Technical Analysis
Fundamental Analysis (FA) is an objective measure of an asset’s value. Unlike FA, TA focuses almost exclusively on price action. Technical analysts believe pumps and dumps are ultimately caused by the irrational emotions of those holding the assets. It’s important to learn how to perform both TA and FA.Candlesticks
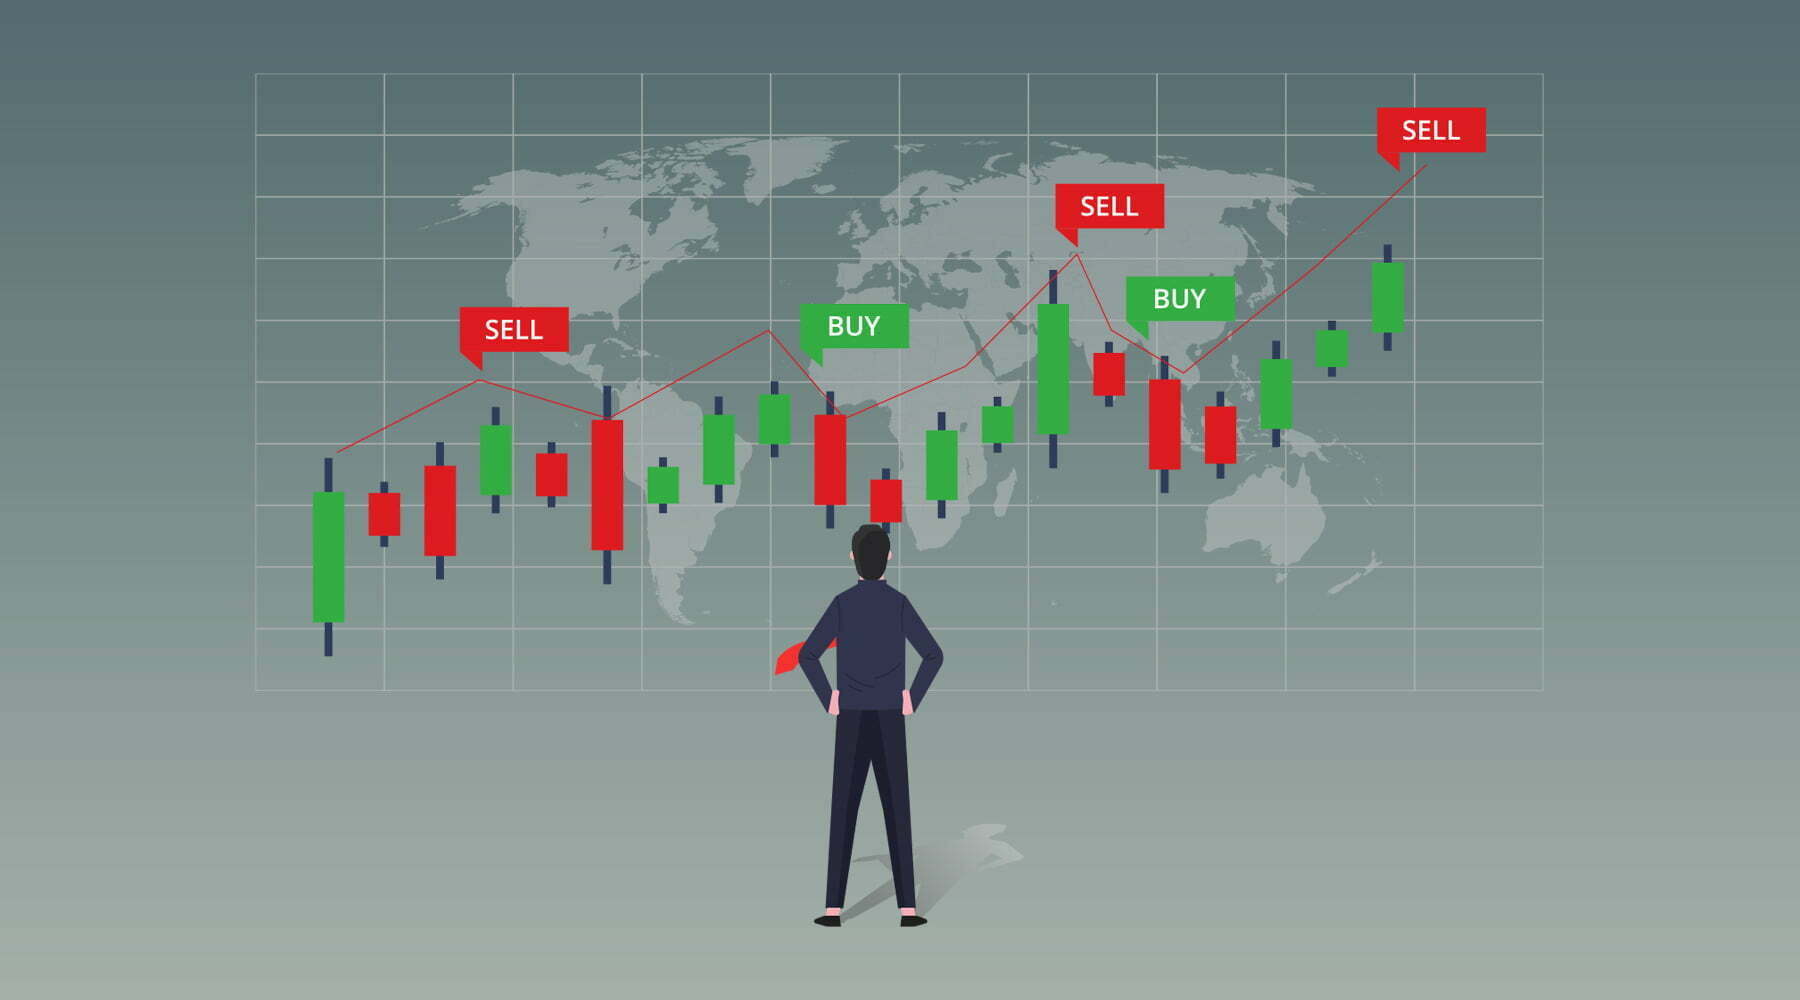
Almost everything in TA involves the candlestick chart. But what is it, and what does it show?Each candlestick shows a snapshot of the trading activity within a given unit of time. For example, if you have the chart set to 1 hour, each candle will represent one hour of trading activity. A green candle means prices went up during that period, and a red candle means prices went down.
Almost all candles will have a ‘body’ and a ‘wick.’ The body is the thicker part of the candle. The wicks are the thinner parts sticking out from the top or bottom of the body.
A candle with almost no body means that almost all of the trading during the time period took place during a very narrow price range. This means that the price did not change much during that time. When you see a candle that’s almost all body with no wicks, that means that price either moved to the upside or the downside during that period.
Wicks on a candle denote the highest and lowest prices during that trading period. Wicks are incredibly useful, as they can tell us when traders are taking profits or buying the dip.
A long wick on the bottom of the candle suggests that traders are buying the dip, meaning that the price could still be bullish. A long wick at the top suggests that traders are itching to take profits.
However, it’s only when you factor in trading volumes that you can start making price predictions with candlestick charts.
Trading Volumes
Factoring in trading volumes is essential for good technical analysis. Each volume bar you see at the bottom of a trading window shows you the amount of an asset that was traded during the time period you set.As a general rule, you want to be trading on a market that has lots of volume. Low volume tends to lead to price volatility, meaning that prices could suddenly spike up or down.
Patterns
When traders draw lines on candlestick charts, they’re usually looking for 3 things.
1. Support: refers to the lower limit of where the price of an asset could go
2. Resistance: refers to the upper limit
3. Recognisable price patterns
There are many ways to assess where the support and resistance prices could be, and more often than not, they reveal recognisable price patterns.
More indicators
There are hundreds of different indicators used in technical analysis and trading. Here are some common indicators:
- Moving Averages: determine the average price of an asset over a given period of time
- MACD (moving average convergence divergence): used to determine new trends in price and measure price volatility
- RSI (Relative Strength Index): tells you if a cryptocurrency is overvalued or undervalued.
- Bollinger Bands: Like MACD, Bollinger Bands are used to measure market volatility
Continue reading by joining Cryptonary Pro
$1,548 $1,197/year
Get everything you need to actively manage your portfolio and stay ahead. Ideal for investors seeking regular guidance and access to tools that help make informed decisions.
For your security, all orders are processed on a secured server.
As a Cryptonary Pro subscriber, you also get:
3X Value Guarantee - If cumulative documented upside does not reach 300% during your 12-month membership, you can request a full refund. Terms
24/7 access to experts with 50+ years’ experience
All of our top token picks for 2025
On hand technical analysis on any token of your choice
Weekly livestreams & ask us anything with the team
Daily insights on Macro, Mechanics, and On-chain
Curated list of top upcoming airdrops (free money)
3X Value Guarantee
If cumulative documented upside does not reach 300% during your 12-month membership, you can request a full refund.
Our track record speaks for itself
With over 2.4M tokens and widespread misinformation in crypto, we cut through the noise and consistently find winning assets.
Our track record speaks for itself
With over 2.4M tokens and widespread misinformation in crypto, we cut
through the noise and consistently find winning assets.


Frequently Asked Questions
Can I trust Cryptonary's calls?
Yes. We've consistently identified winners across multiple cycles. Bitcoin under $1,000, Ethereum under $70, Solana under $10, WIF from $0.003 to $5, PopCat from $0.004 to $2, SPX blasting past $1.70, and our latest pick has already 200X'd since June 2025. Everything is timestamped and public record.
Do I need to be an experienced trader or investor to benefit?
No. When we founded Cryptonary in 2017 the market was new to everyone. We intentionally created content that was easy to understand and actionable. That foundational principle is the crux of Cryptonary. Taking complex ideas and opportunities and presenting them in a way a 10 year old could understand.
What makes Cryptonary different from free crypto content on YouTube or Twitter?
Signal vs noise. We filter out 99.9% of garbage projects, provide data backed analysis, and have a proven track record of finding winners. Not to mention since Cryptonary's inception in 2017 we have never taken investment, sponsorship or partnership. Compare this to pretty much everyone else, no track record, and a long list of partnerships that cloud judgements.
Why is there no trial or refund policy?
We share highly sensitive, time-critical research. Once it's out, it can't be "returned." That's why membership is annual only. Crypto success takes time and commitment. If someone is not willing to invest 12 months into their future, there is no place for them at Cryptonary.
Do I get direct access to the Cryptonary team?
Yes. You will have 24/7 to the team that bought you BTC at $1,000, ETH at $70, and SOL at $10. Through our community chats, live Q&As, and member only channels, you can ask questions and interact directly with the team. Our team has over 50 years of combined experience which you can tap into every single day.
How often is content updated?
Daily. We provide real-time updates, weekly reports, emergency alerts, and live Q&As when the markets move fast. In crypto, the market moves fast, in Cryptonary, we move faster.
How does the 3X Value Guarantee work?
We stand behind the value of our research. If the documented upside from our published research during your 12-month membership does not exceed three times (3X) the annual subscription cost, you can request a full refund. Historical context: In every completed market cycle since 2017, cumulative documented upside has exceeded 10X this threshold.
TermsRecommended from Cryptonary