Save 23% ($351) & Get a Free 1-1 Call with our Team ⏰ : 0d 2h 59m 43s
Market Analysis
Disclaimer: This is not financial or investment advice. You are responsible for any capital-related decisions you make, and only you are accountable for the results.
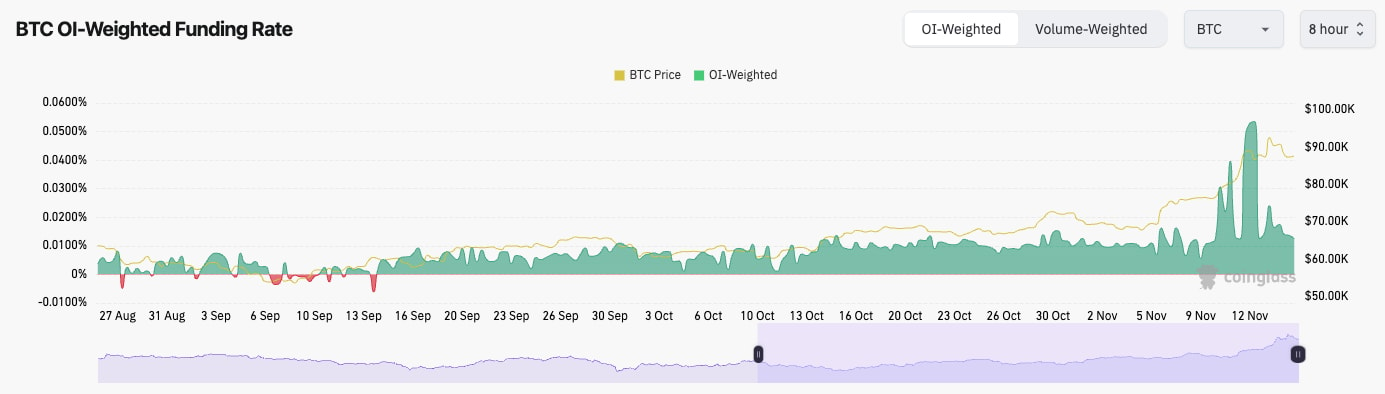
- BTC's Open Interest still remains high (as measured by the number of coins), suggesting there's still a lot of leverage in the system here.
- BTC's funding rate has been substantially reset, meaning that there is a more even balance between Longs and Shorts. This is a healthier leverage setup than when Funding was 5/6 times the current level.
Get the latest Bitcoin price prediction—dive into our detailed analysis to stay one step ahead!
Technical analysis
- For the TA, we will look to the 12-hour timeframe just to get more information, as the move-up has essentially been a straight move-up. Zooming in slightly helps us to identify levels.
- On the 12hr, BTC has formed a bearish divergence (a new high in price whilst putting in a lower high on the oscillator). This bearish divergence has also been printed in overbought territory in both the 12-hour and the daily timeframes.
- Local support is at $87,000, whilst the deeper level for a pullback might be around $82k. However, it's very hard to identify a clear, deeper level.
- To the upside, the all-time high of $93,300 is the level for the price to clear above.
- BTC is potentially forming a bullish pennant despite the bearish divergence. If this pattern played out, we'd likely see BTC break to the upside.
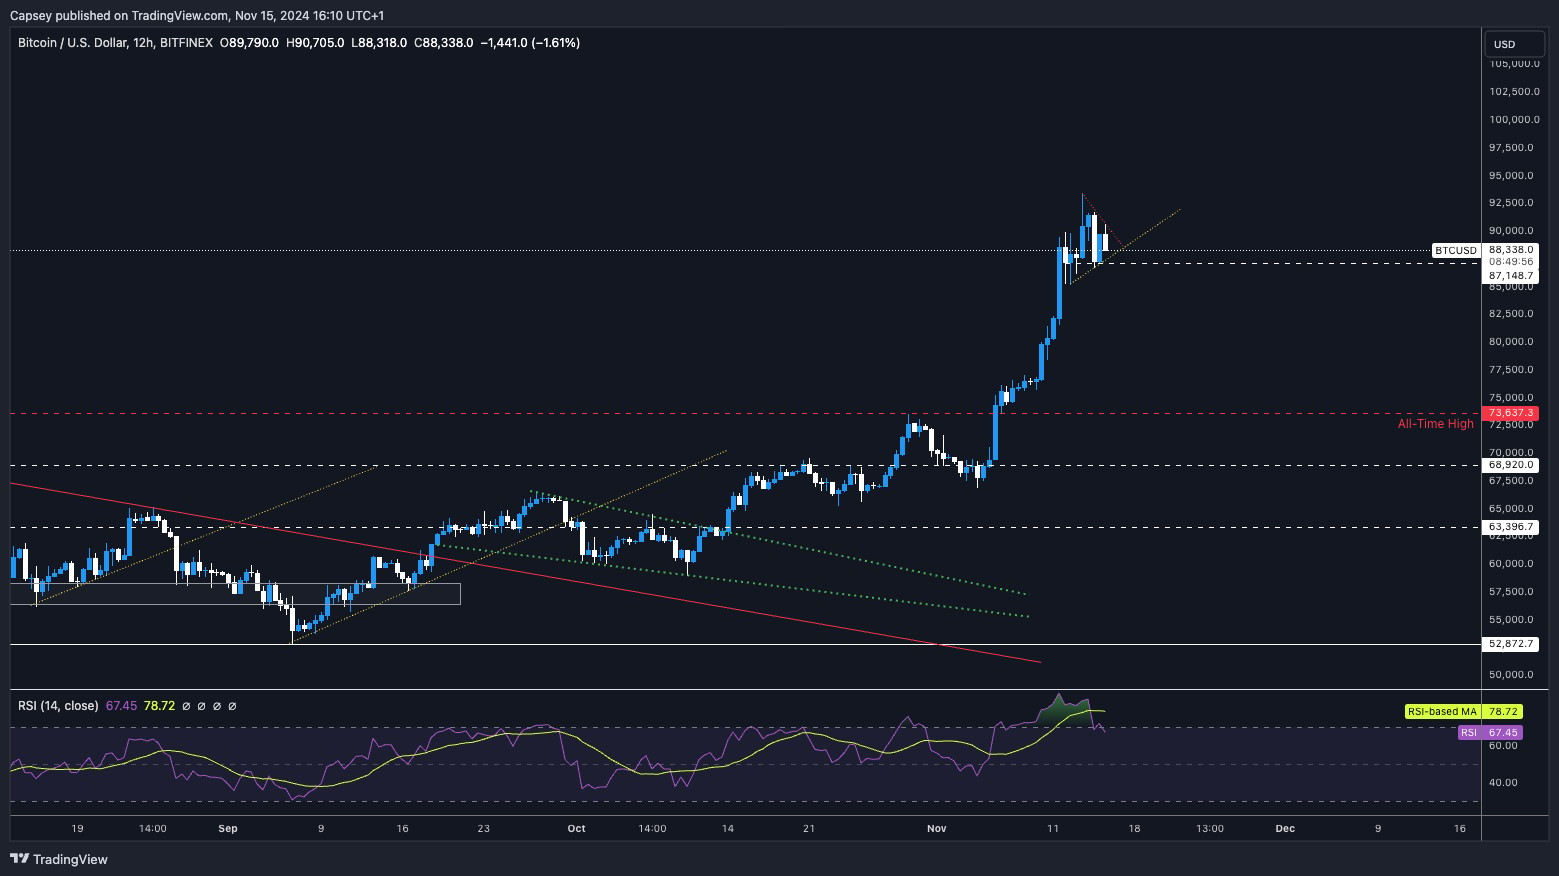
- Next Support: $87,000
- Next Resistance: $93,300
- Direction: Neutral/Bullish
- Upside Target: $93,300 (then $100k)
- Downside Target: $87,000
Cryptonary's take
There are two key contrasts here currently: the bullish pennant and the bearish divergence. Both have opposite results. Market momentum suggests more upside, but the extremity of the move suggests a small pullback. It's very difficult to know which will play out here, and unfortunately, we can't see one outcome favouring the other here. Sorry guys.Personally, I (Tom) think a pullback to $82k - $85k, somewhere in there, would be positive for us in the medium term. This would reset some of the indicators and also prolong retail piling back into the space.
A grind higher is better for higher prices than a quick cycle blow-off top. Even though a pullback might be possible, it would be extremely risky to sell Spot positions here. We're certainly not doing that. We're holding and seeing what the next days/weeks give us. We're expecting much more upside in the coming weeks, even if we have a week of consolidation.
Recommended from Cryptonary


PRO
Market Direction
11 min read
Mar 24, 2026

PRO
Market Updates
8 min read
Mar 23, 2026
PRO
Market Direction
13 min read
Mar 20, 2026
