Save 23% ($351) & Get a Free 1-1 Call with our Team ⏰ : 0d 2h 59m 43s
A foundation for a bullish Q2 is being set... | March 1st
February was a flat month for the crypto market (except for a few outperformers here and there). With only 30 days left until the end of Q1, we’re diving into the foundation for Q2 and whether the next quarter will be bullish or not.

Disclaimer: Not financial or investment advice. You are responsible for any capital-related decisions you make, and only you are accountable for the results.
2022 Summary
- Total Market Cap: +1.07%
- Altcoins Market Cap: +1.86%
- Bitcoin: +0.07%
- Ether: +1.22%
- Solana: -8.24%
TLDR
- The Total Market Cap closed as a Doji candle in February. This suggests we may see an indecisive March as we finish the quarter (with a few exceptions).
- Although March may be indecisive for the market, Q2 looks bullish.
- The Altcoins Market Cap remains above support ($550B). From a technical standpoint, we could see the index rising higher in March.
- RUNE closed February under support ($1.67). We might visit $1.43 in March.
- $2.50 has been flipped into support on the monthly timeframe for SNX. Our first target is now $3.50.
- DYDX will reach the $4 - $4.40 resistance area in March (~+36%).
Total Market Cap
The Total Market Cap index represents the entire valuation of the cryptocurrency market. We track this index to understand where the market is now and to predict where it will likely go next.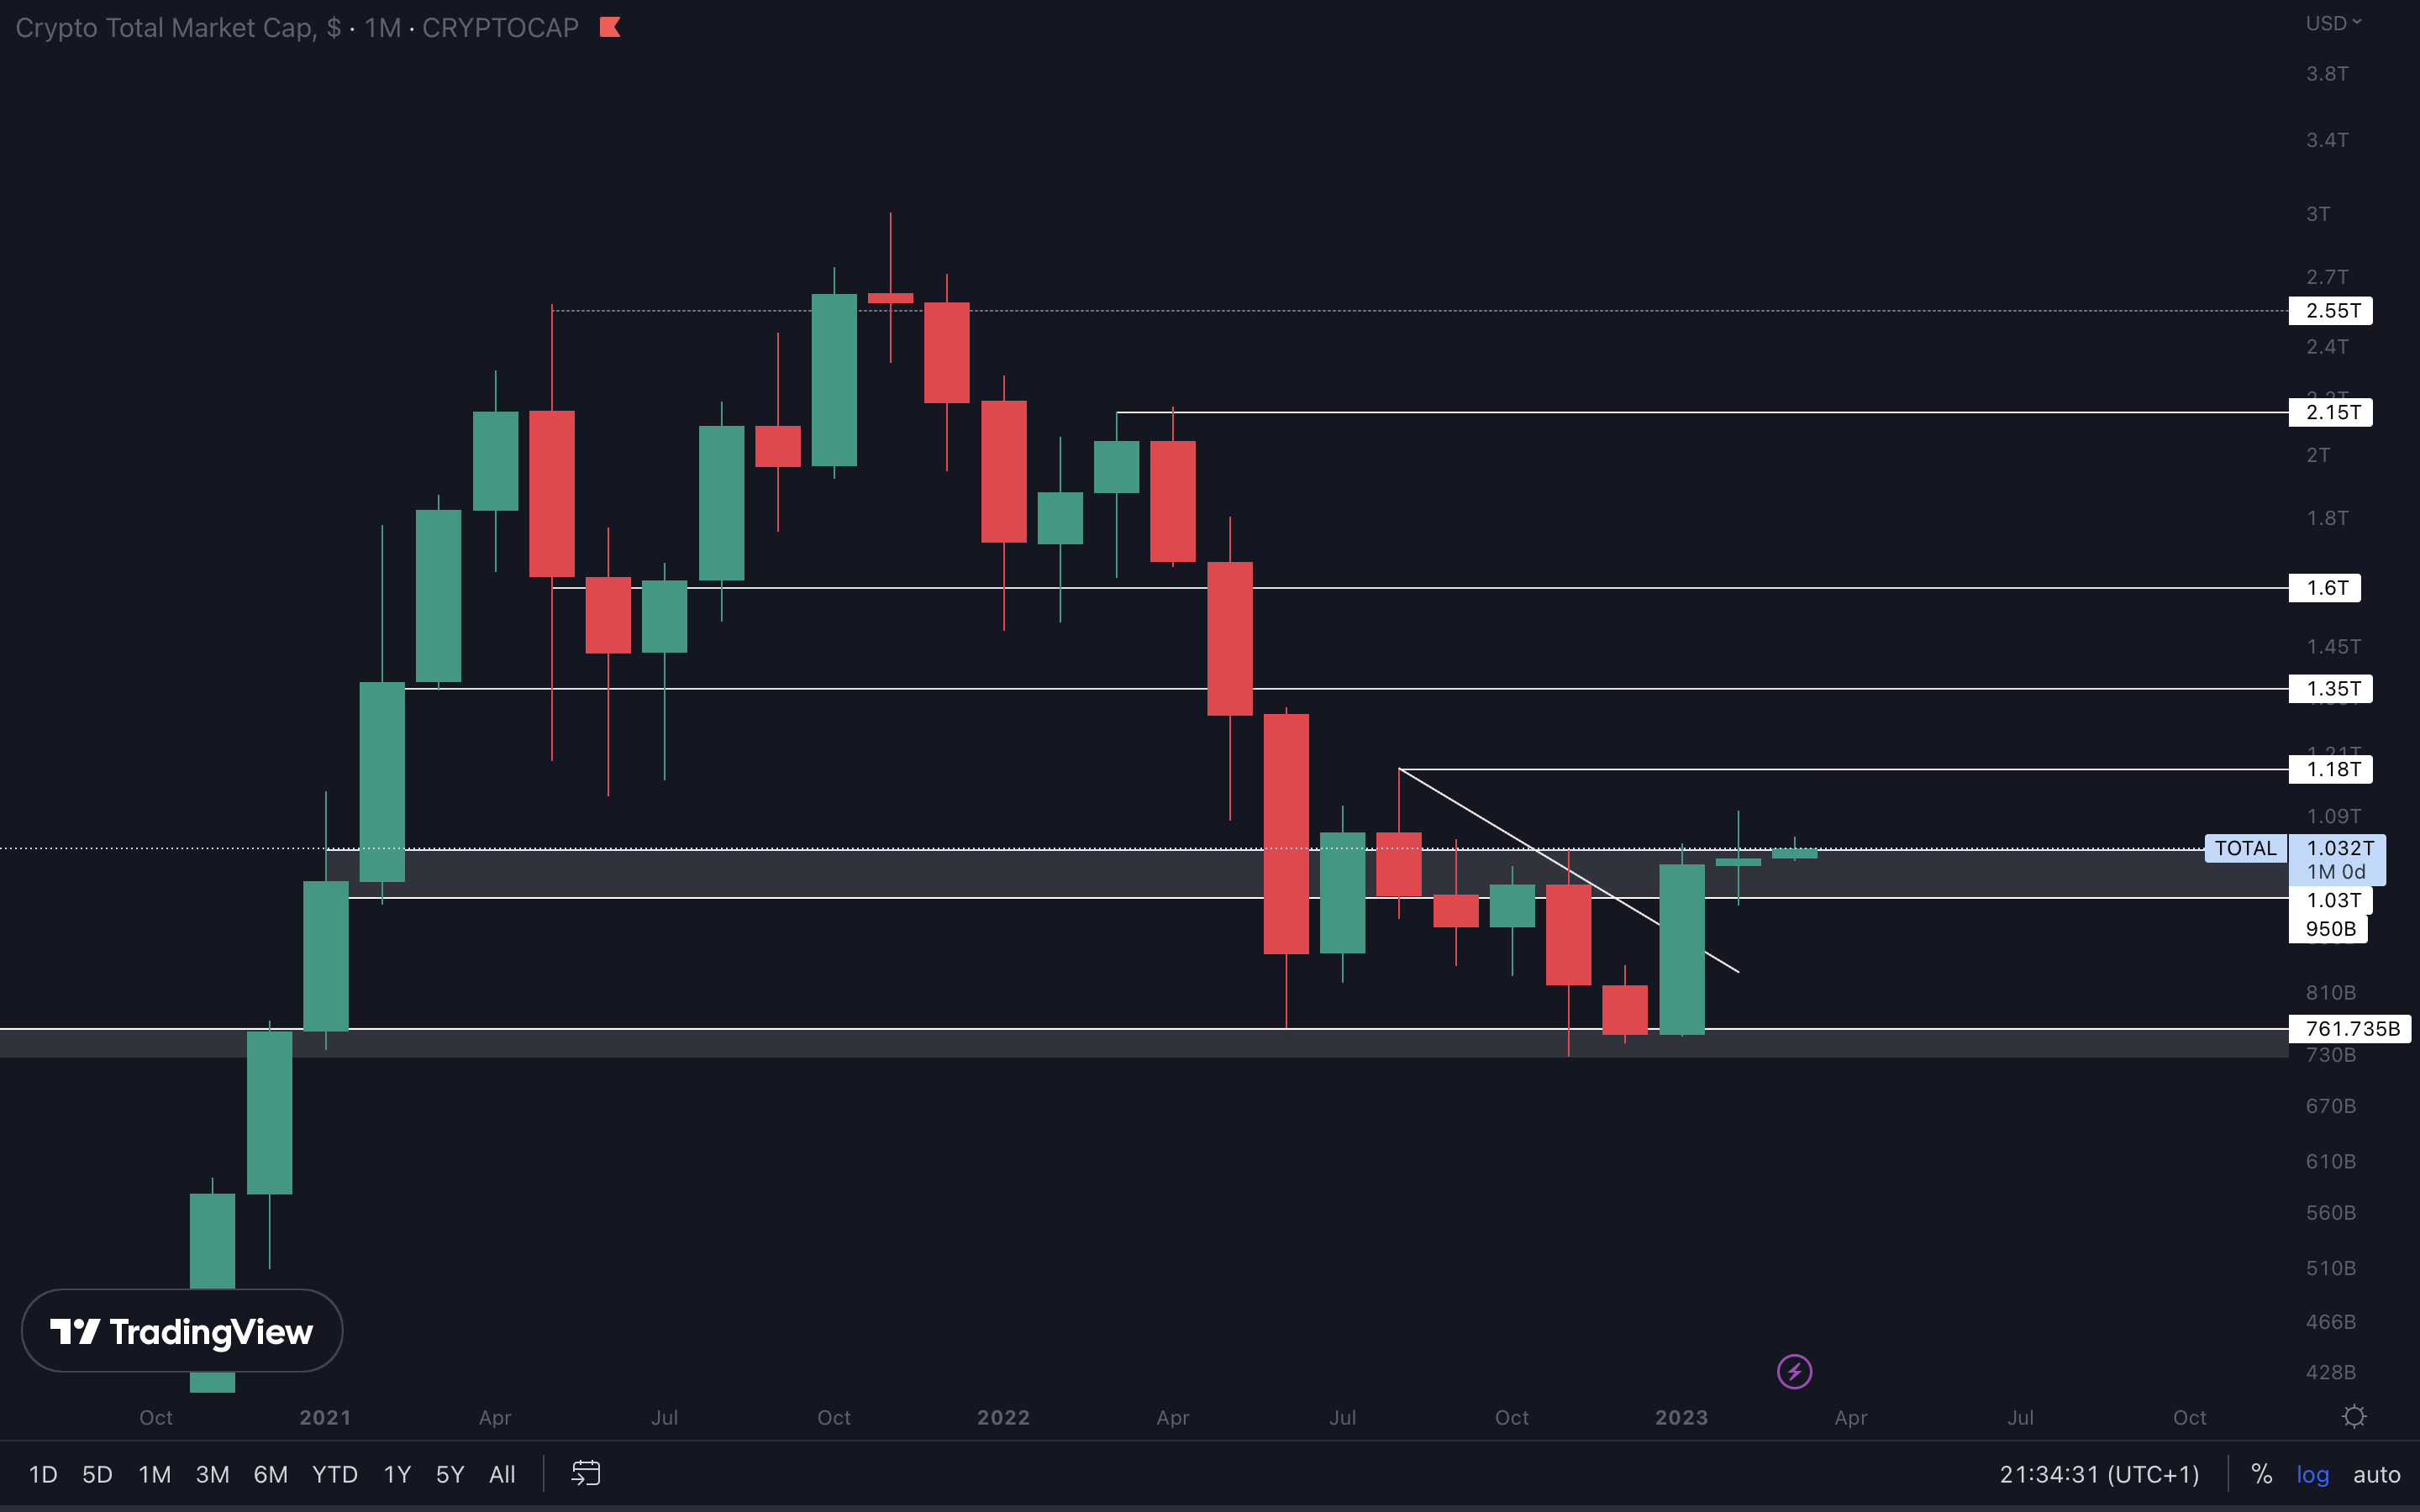
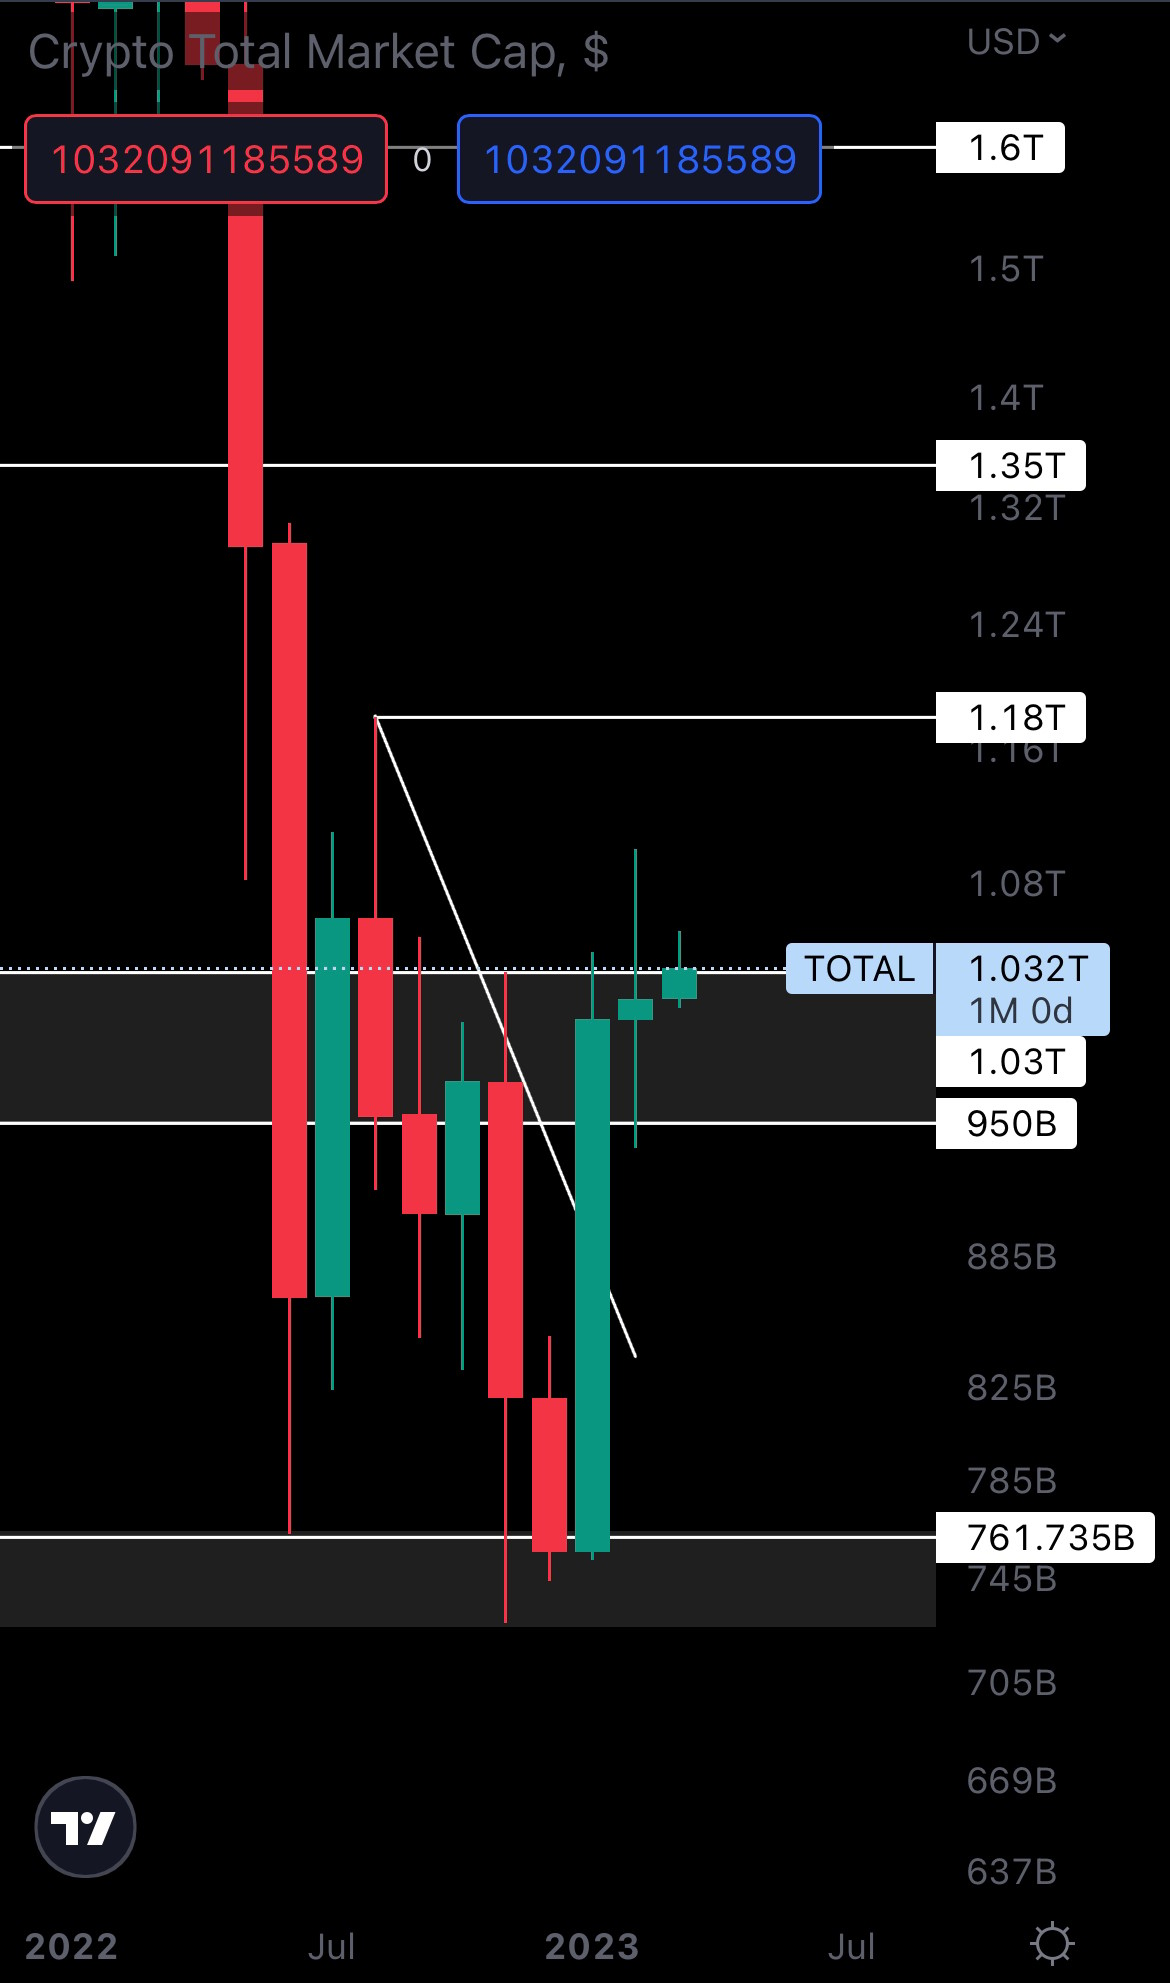
The reason we believe March is indecisive for the crypto market is on this chart. Last month, The Total Market Cap index closed its candle as a Doji. A Doji’s main trait is indecisiveness, created by buyers and sellers countering each other during the formation of the candle. There’s no telling where the market will go during March, but we do believe Q2 will be bullish, and here’s why
Total Market Cap (3M Timeframe)
This is the 3M (three months) timeframe for the Total Market Cap.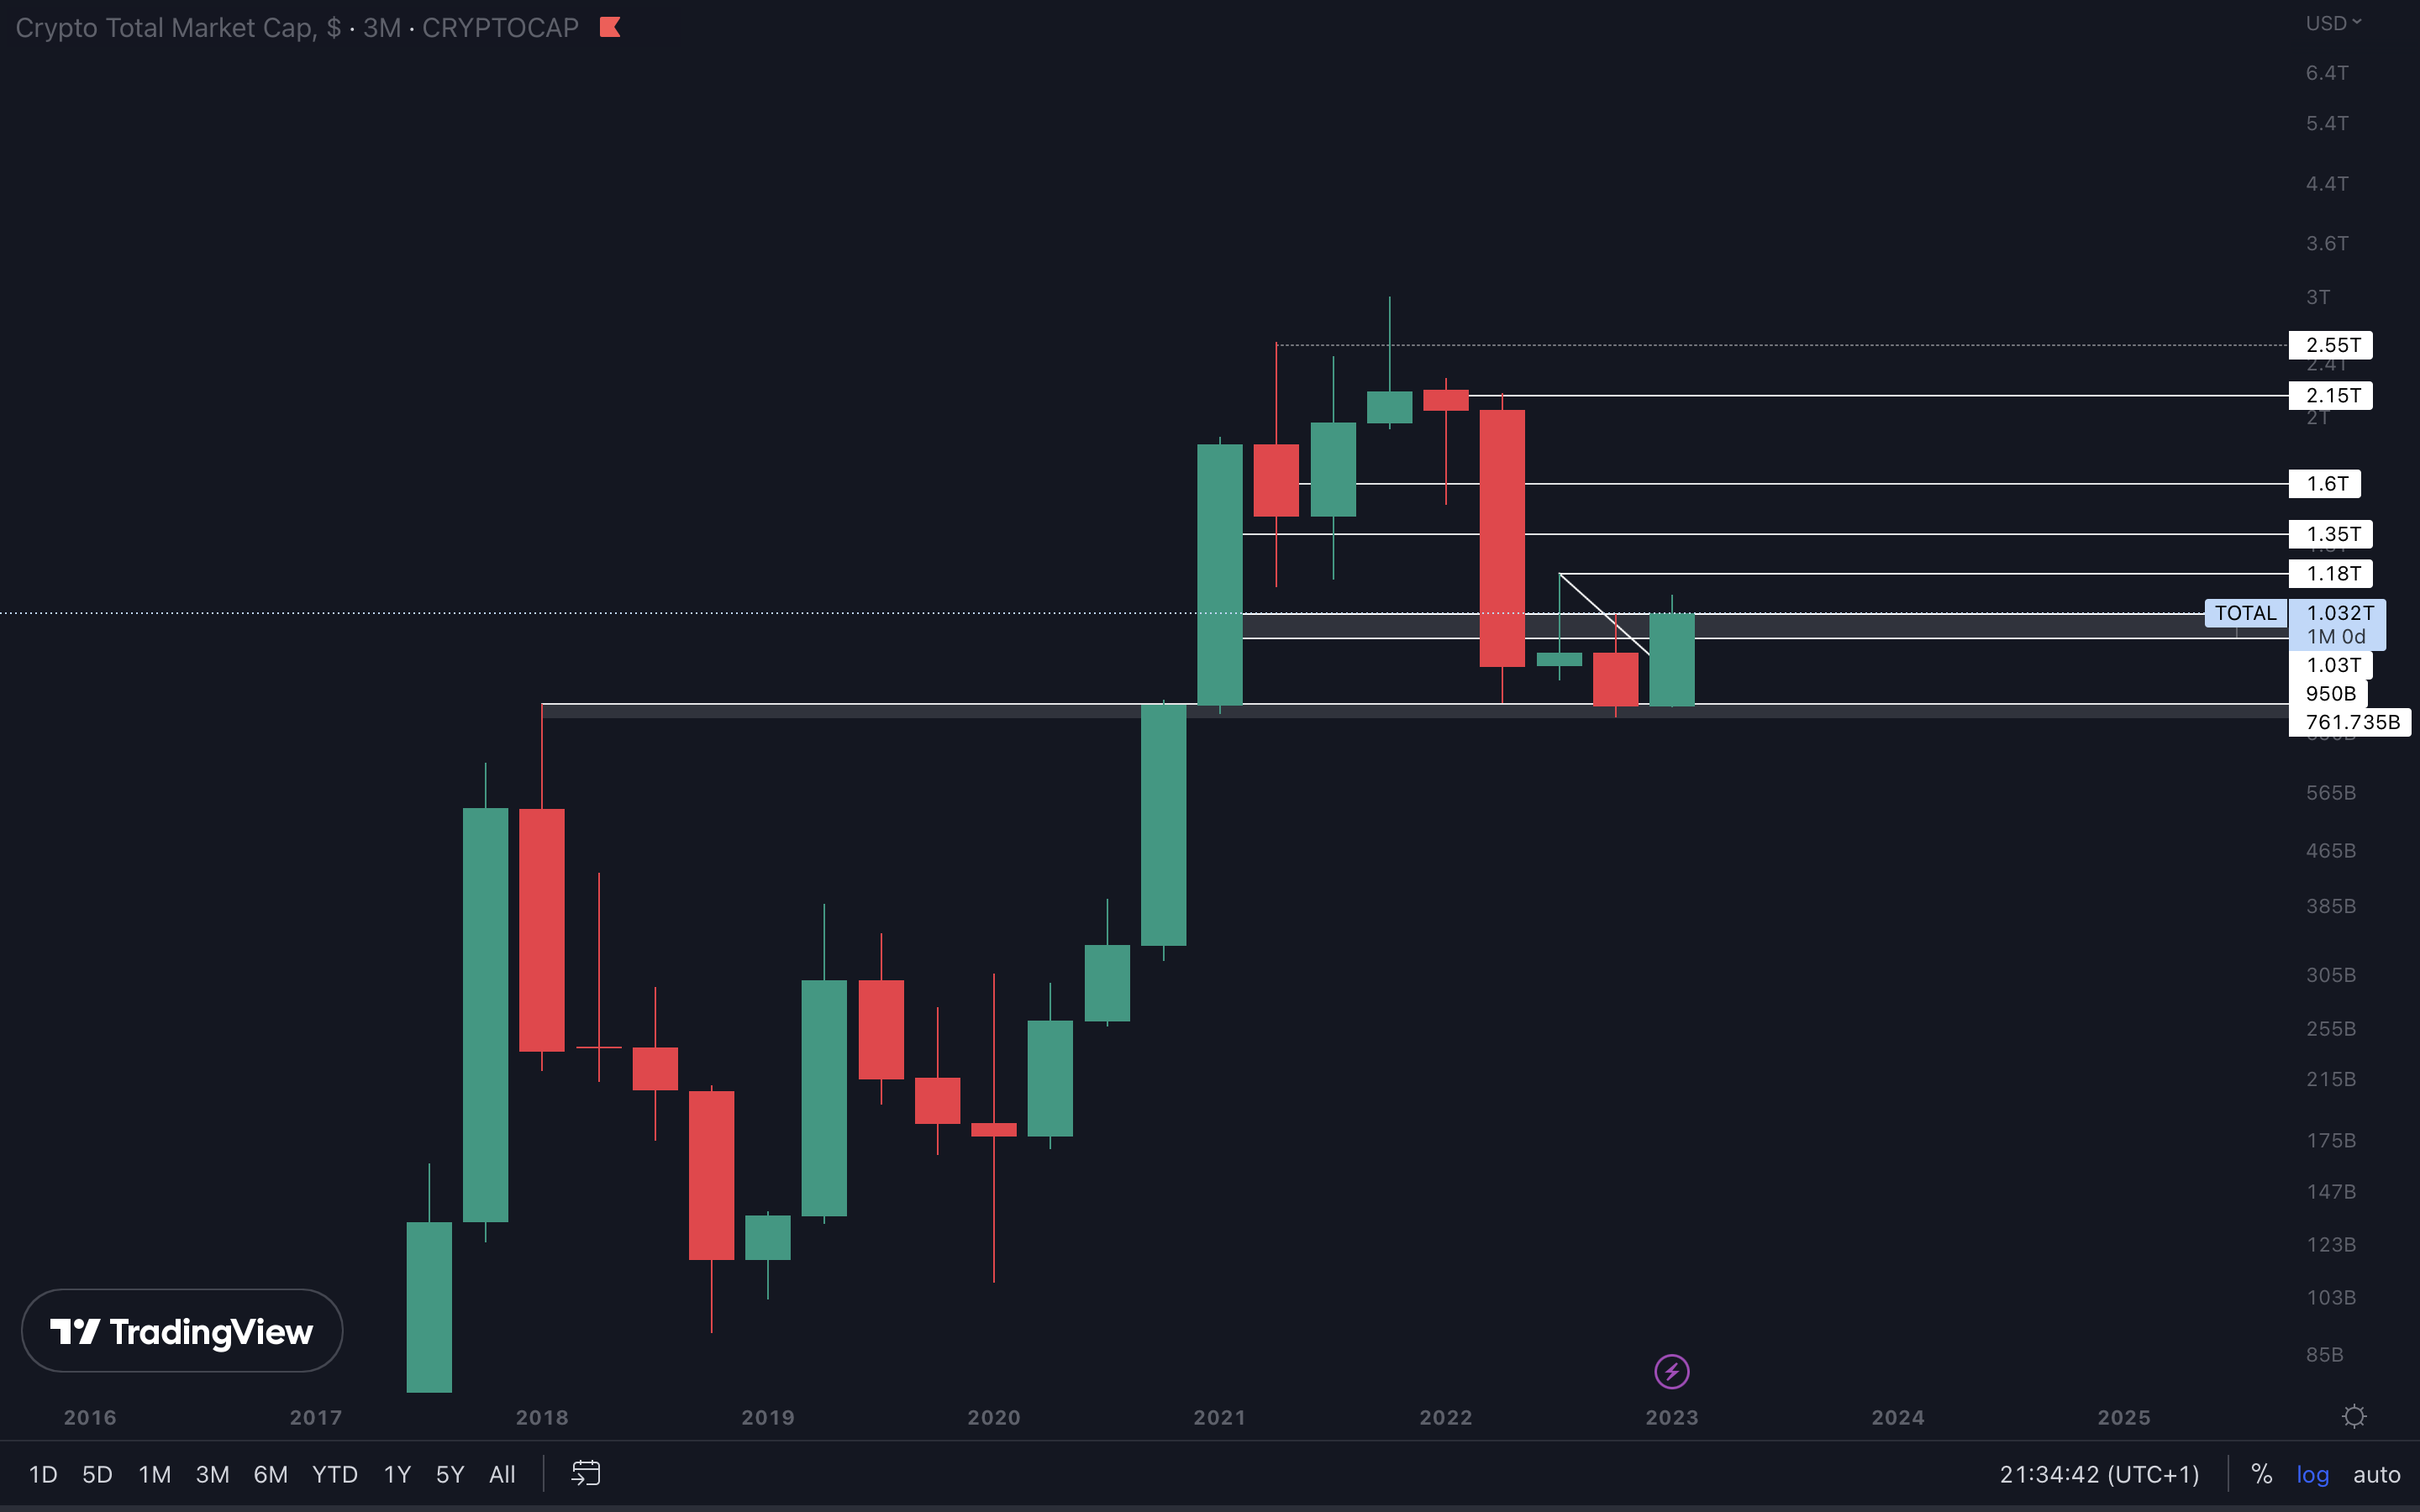
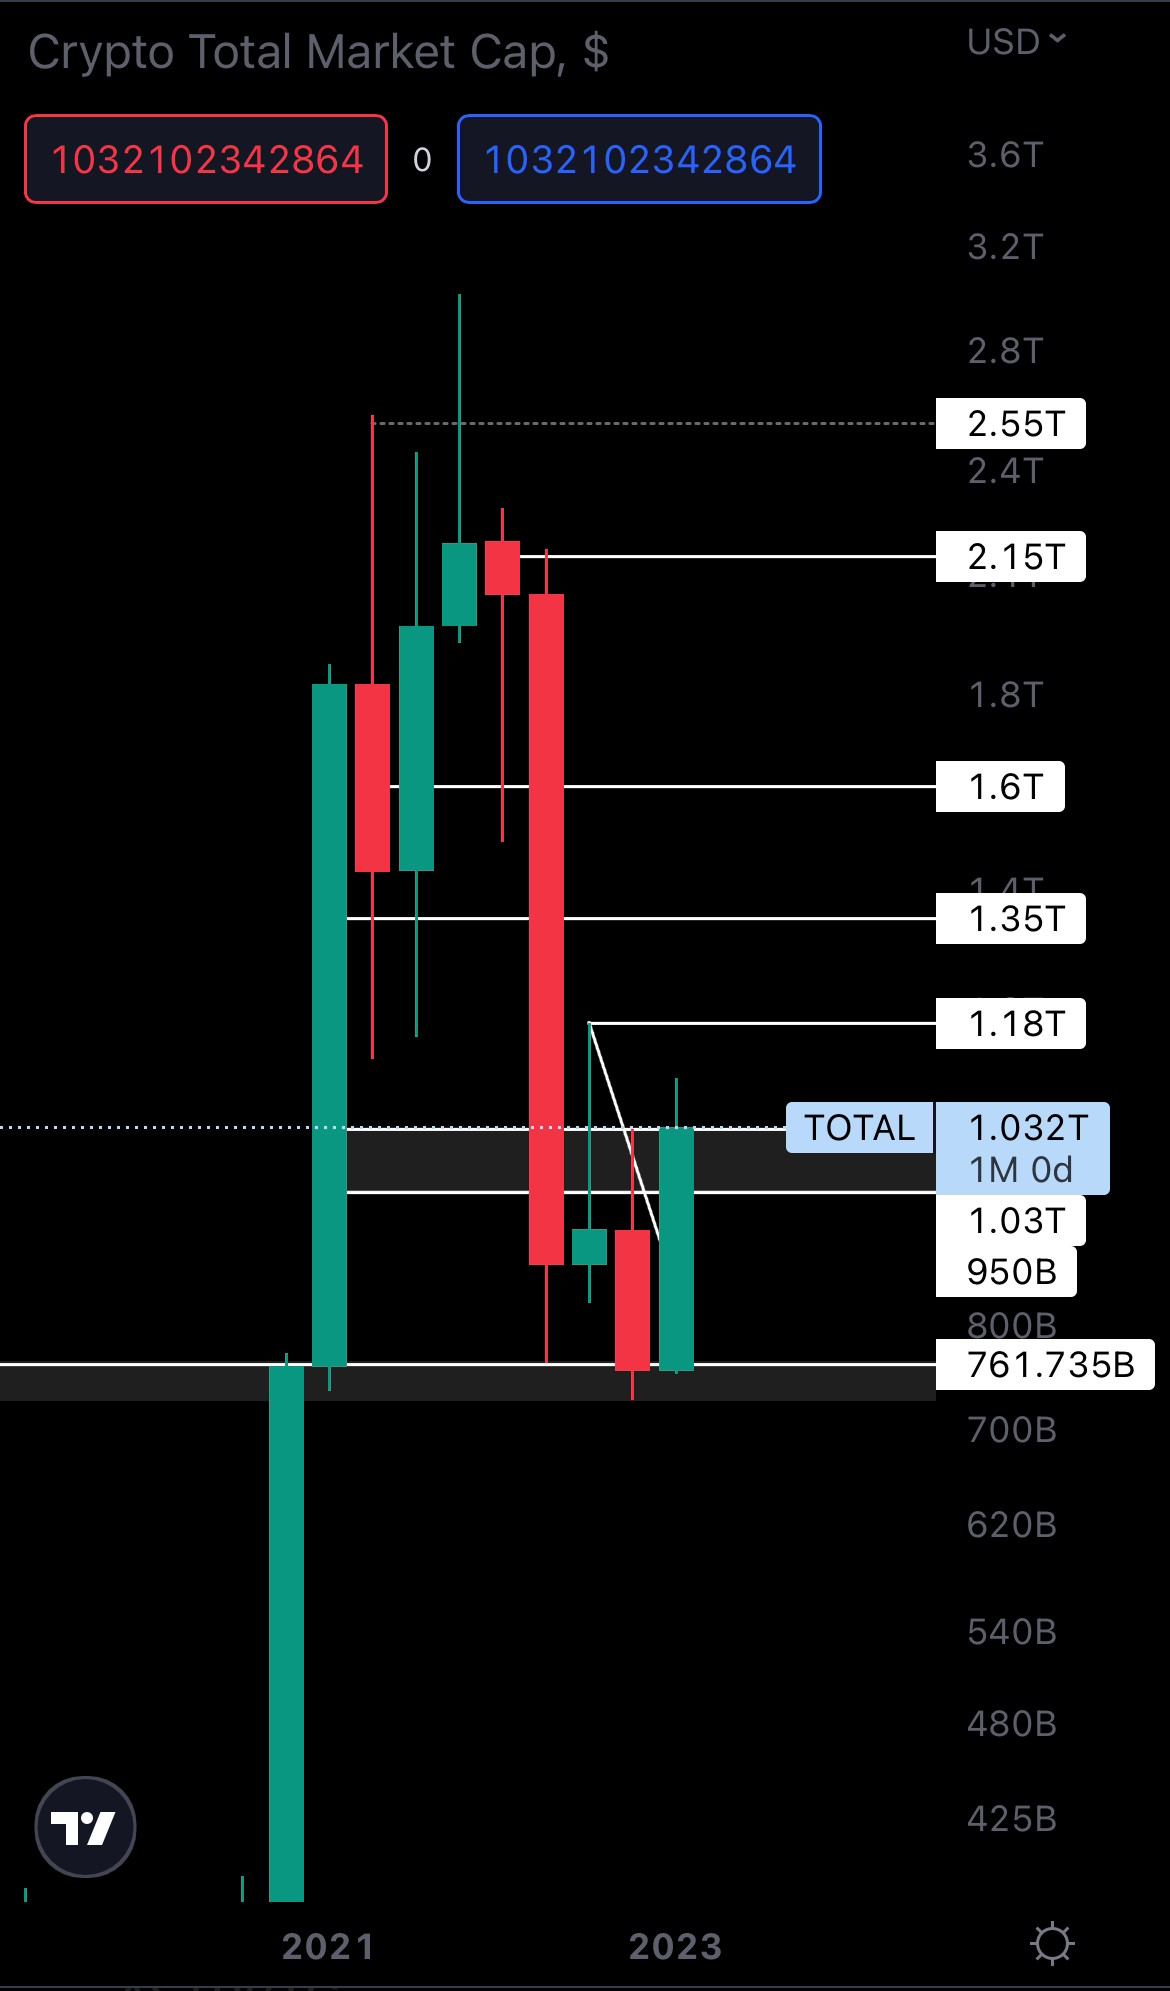
As you might’ve heard… “The bigger the timeframe, the stronger it is”. This statement is absolutely true. As we can see here, a bullish engulfing candle is forming on the 3M timeframe. The last time this happened was back in July of 2021, after which the crypto market reached an all-time high. This is the main reason we believe Q2 will be bullish for crypto, but that’s only if the candle closes as a bullish engulfing. Tracking this index during March will be our main priority.
Altcoins Market Cap
The Altcoins Market Cap index represents the entire evaluation of the altcoins market (all coins other than BTC).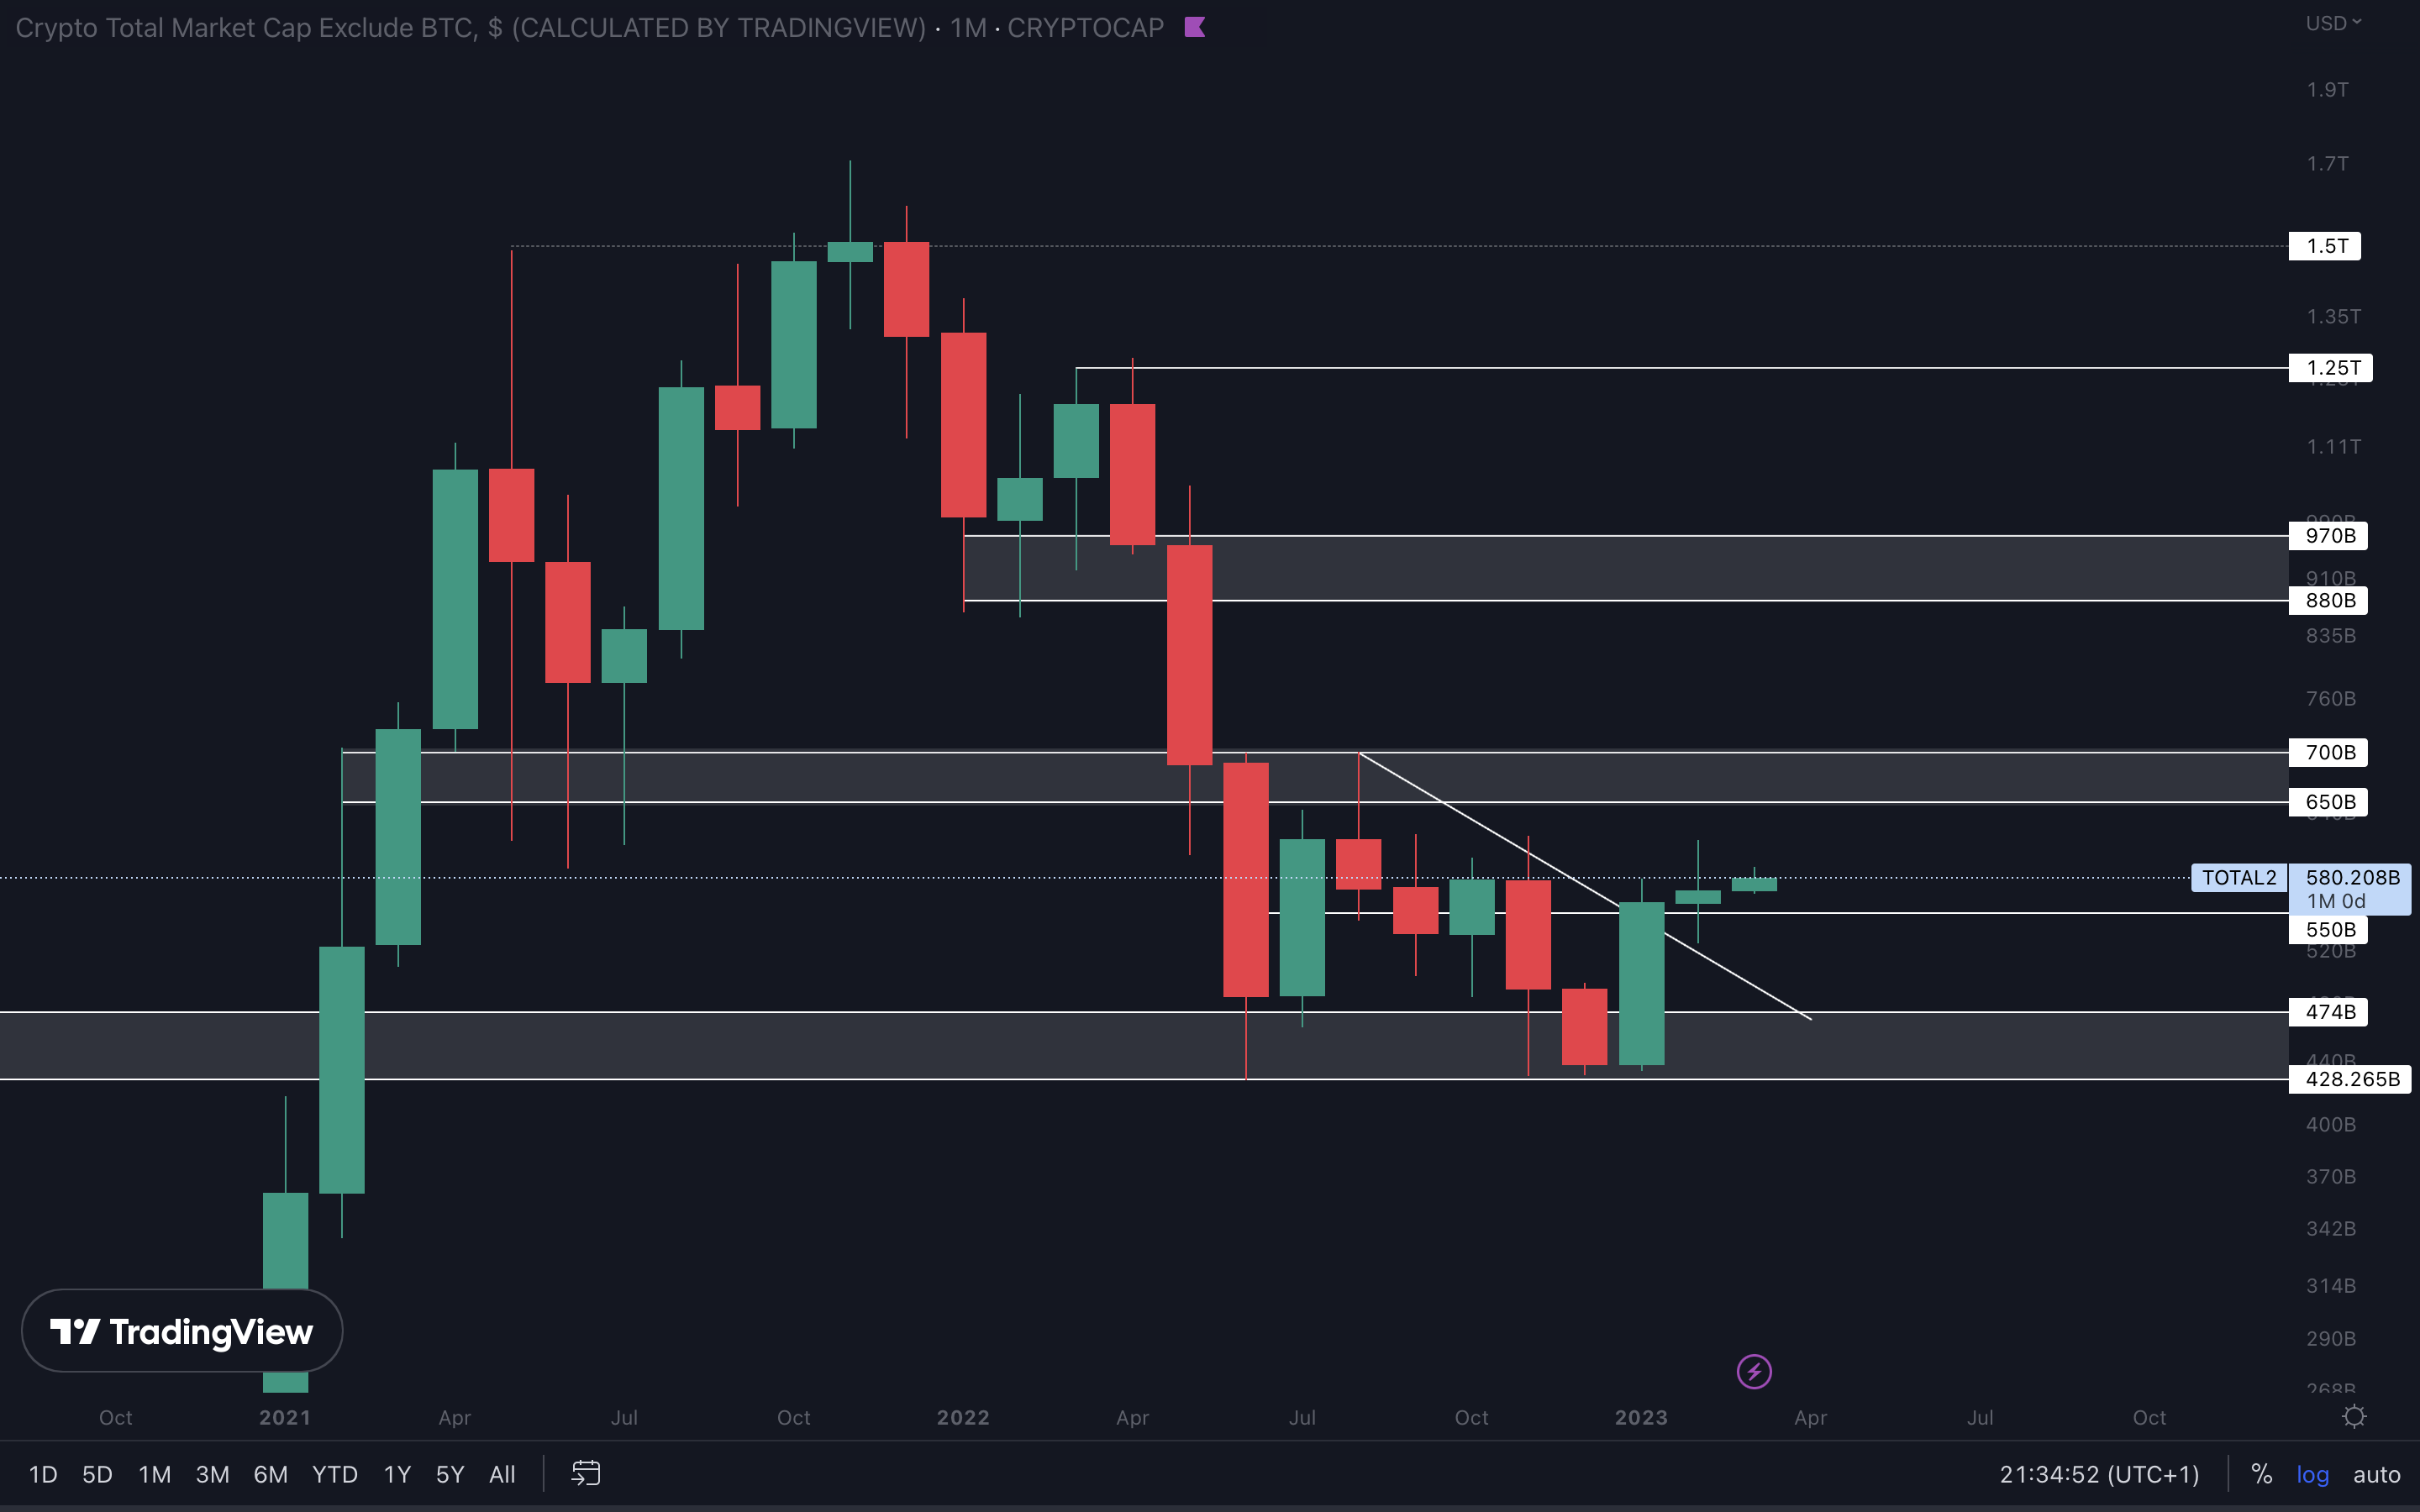
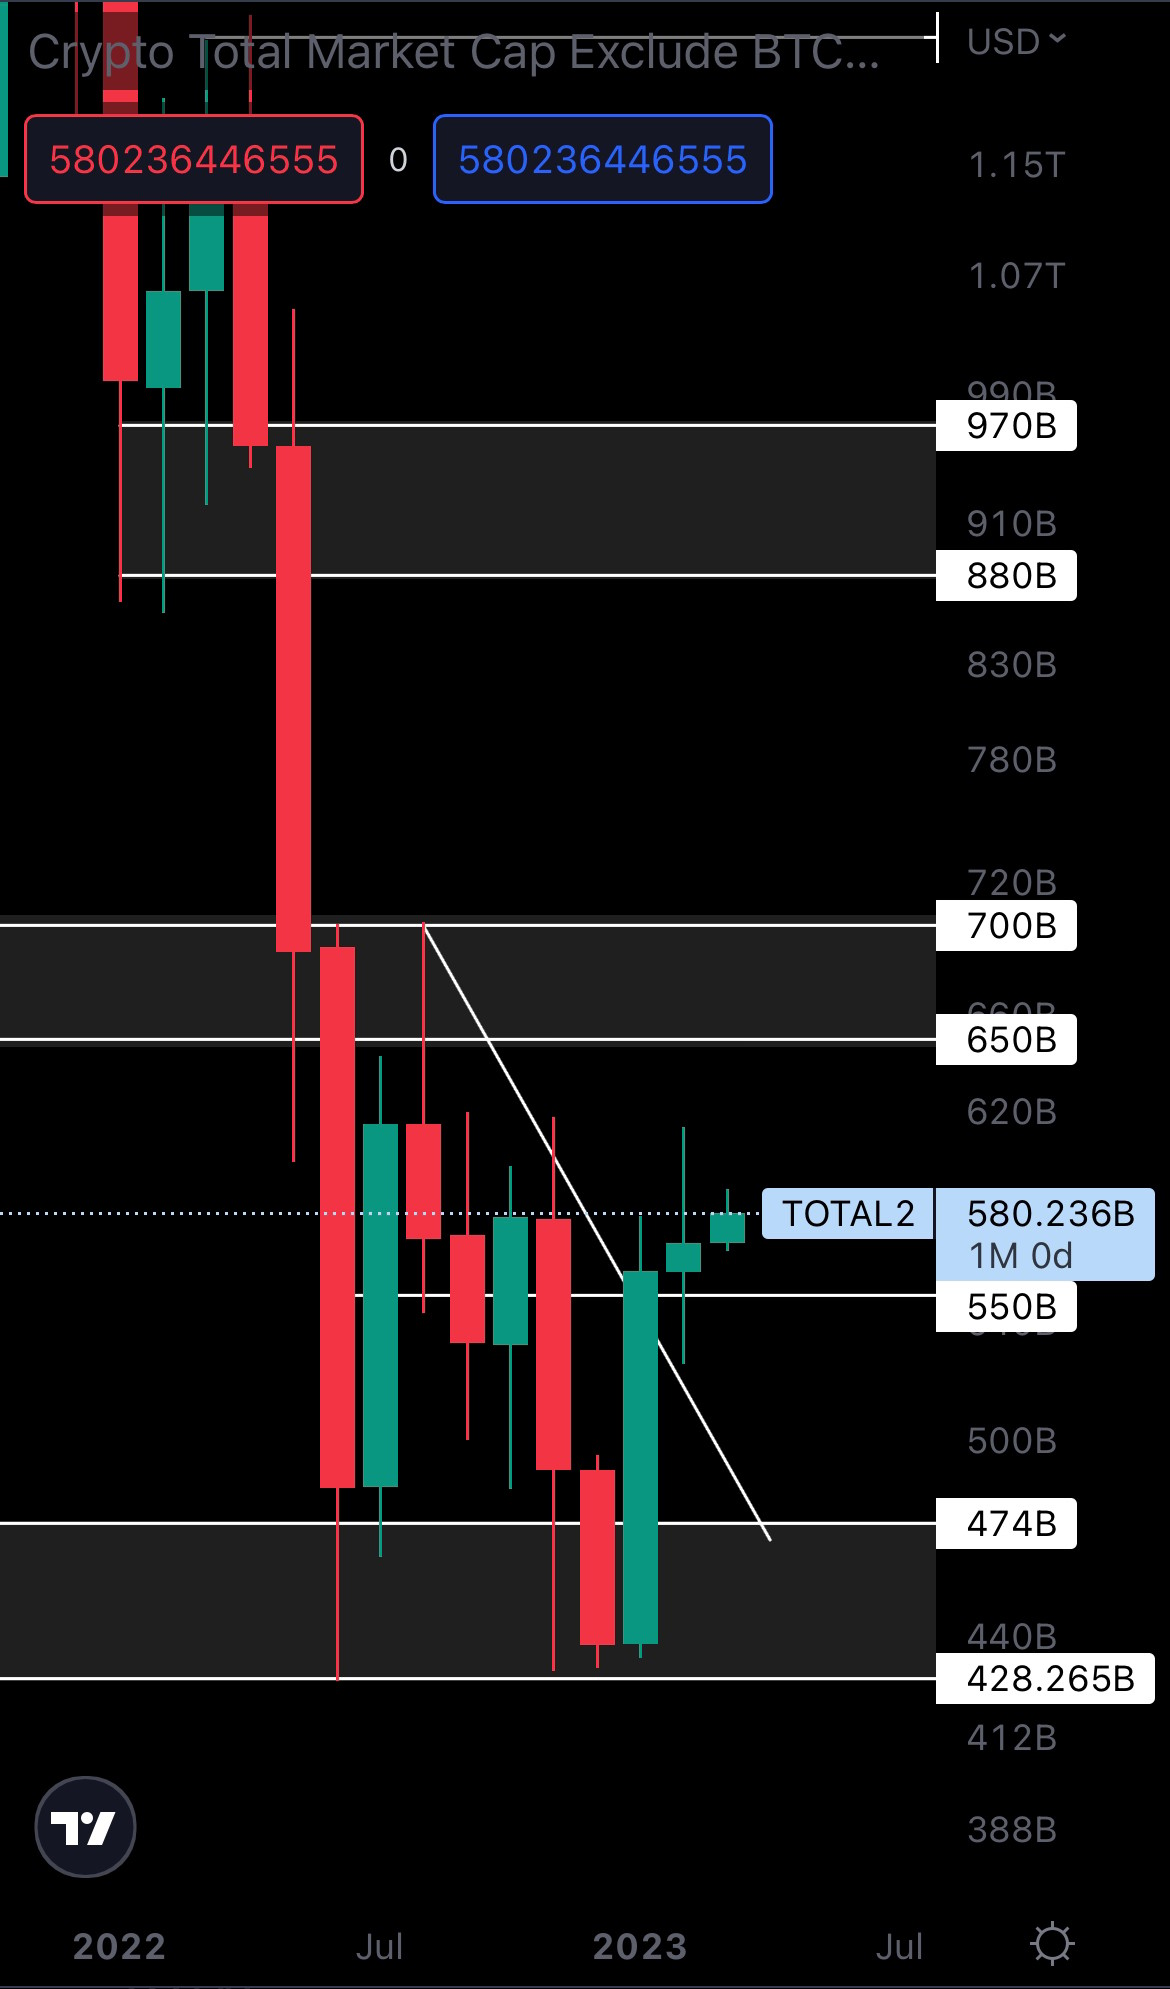
Like the Total Market Cap, the secondary index closed last month’s candle as a Doji candle, indicating indecision from market participants. The key difference here is that the index is already a bit above its support of $550B, and because we closed above it in February, a weekly or monthly closure under this level is needed to invalidate further upside. As long as $550B holds as support, the Altcoins Market Cap can reach $650B - $700B in Q2. March’s price action will be driven by Bitcoin, so let’s get into that now. 👇
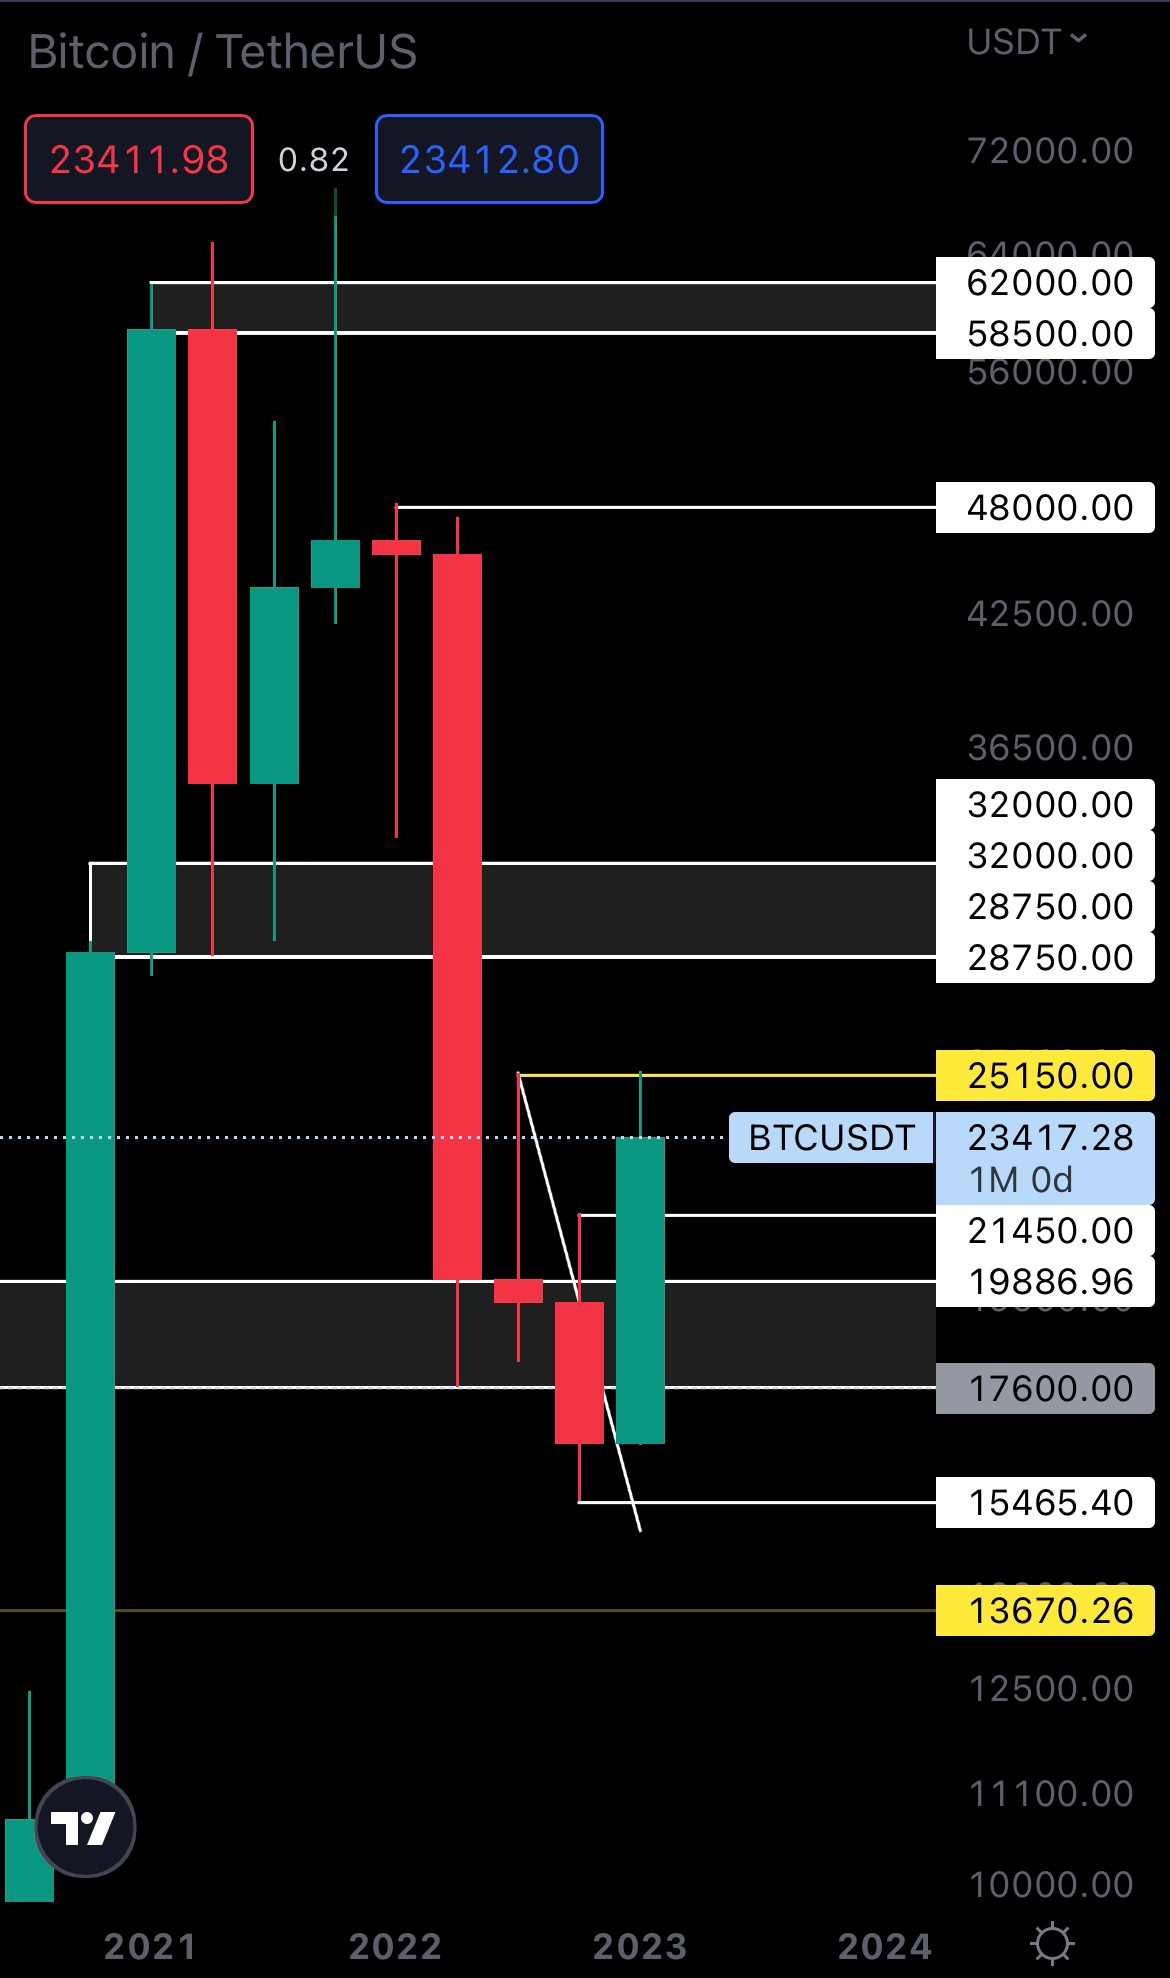
BTC | Bitcoin (Monthly)
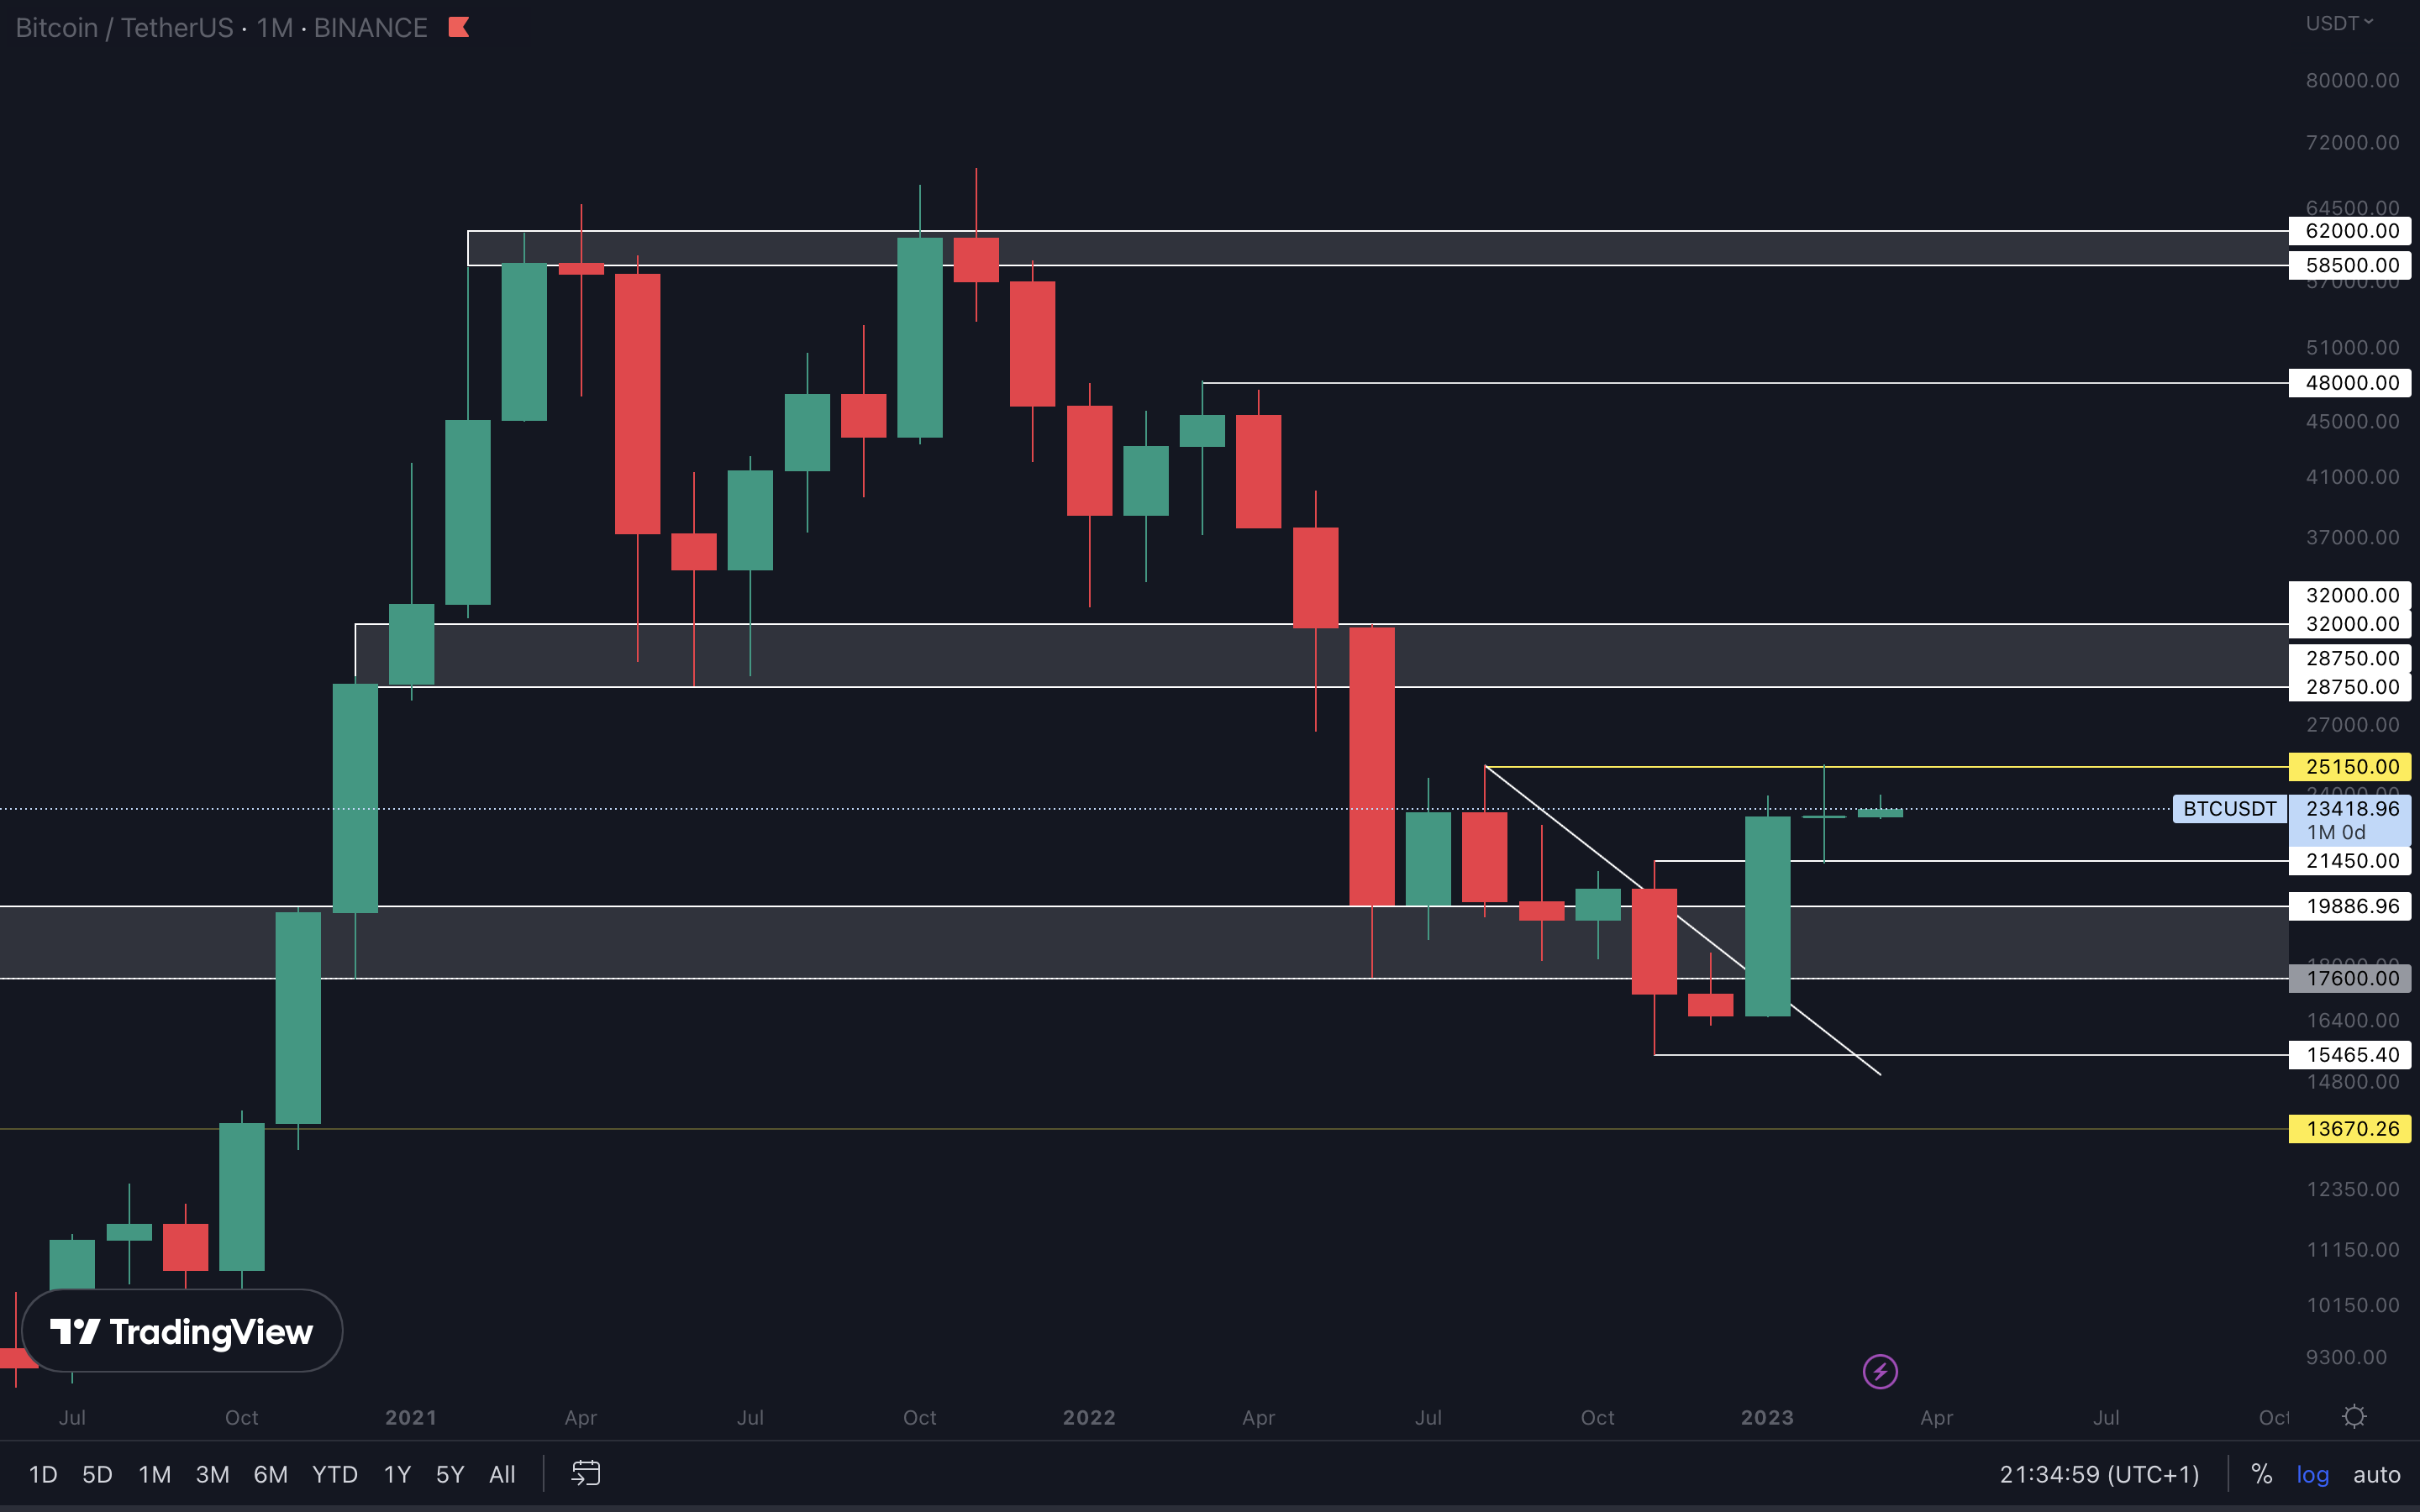
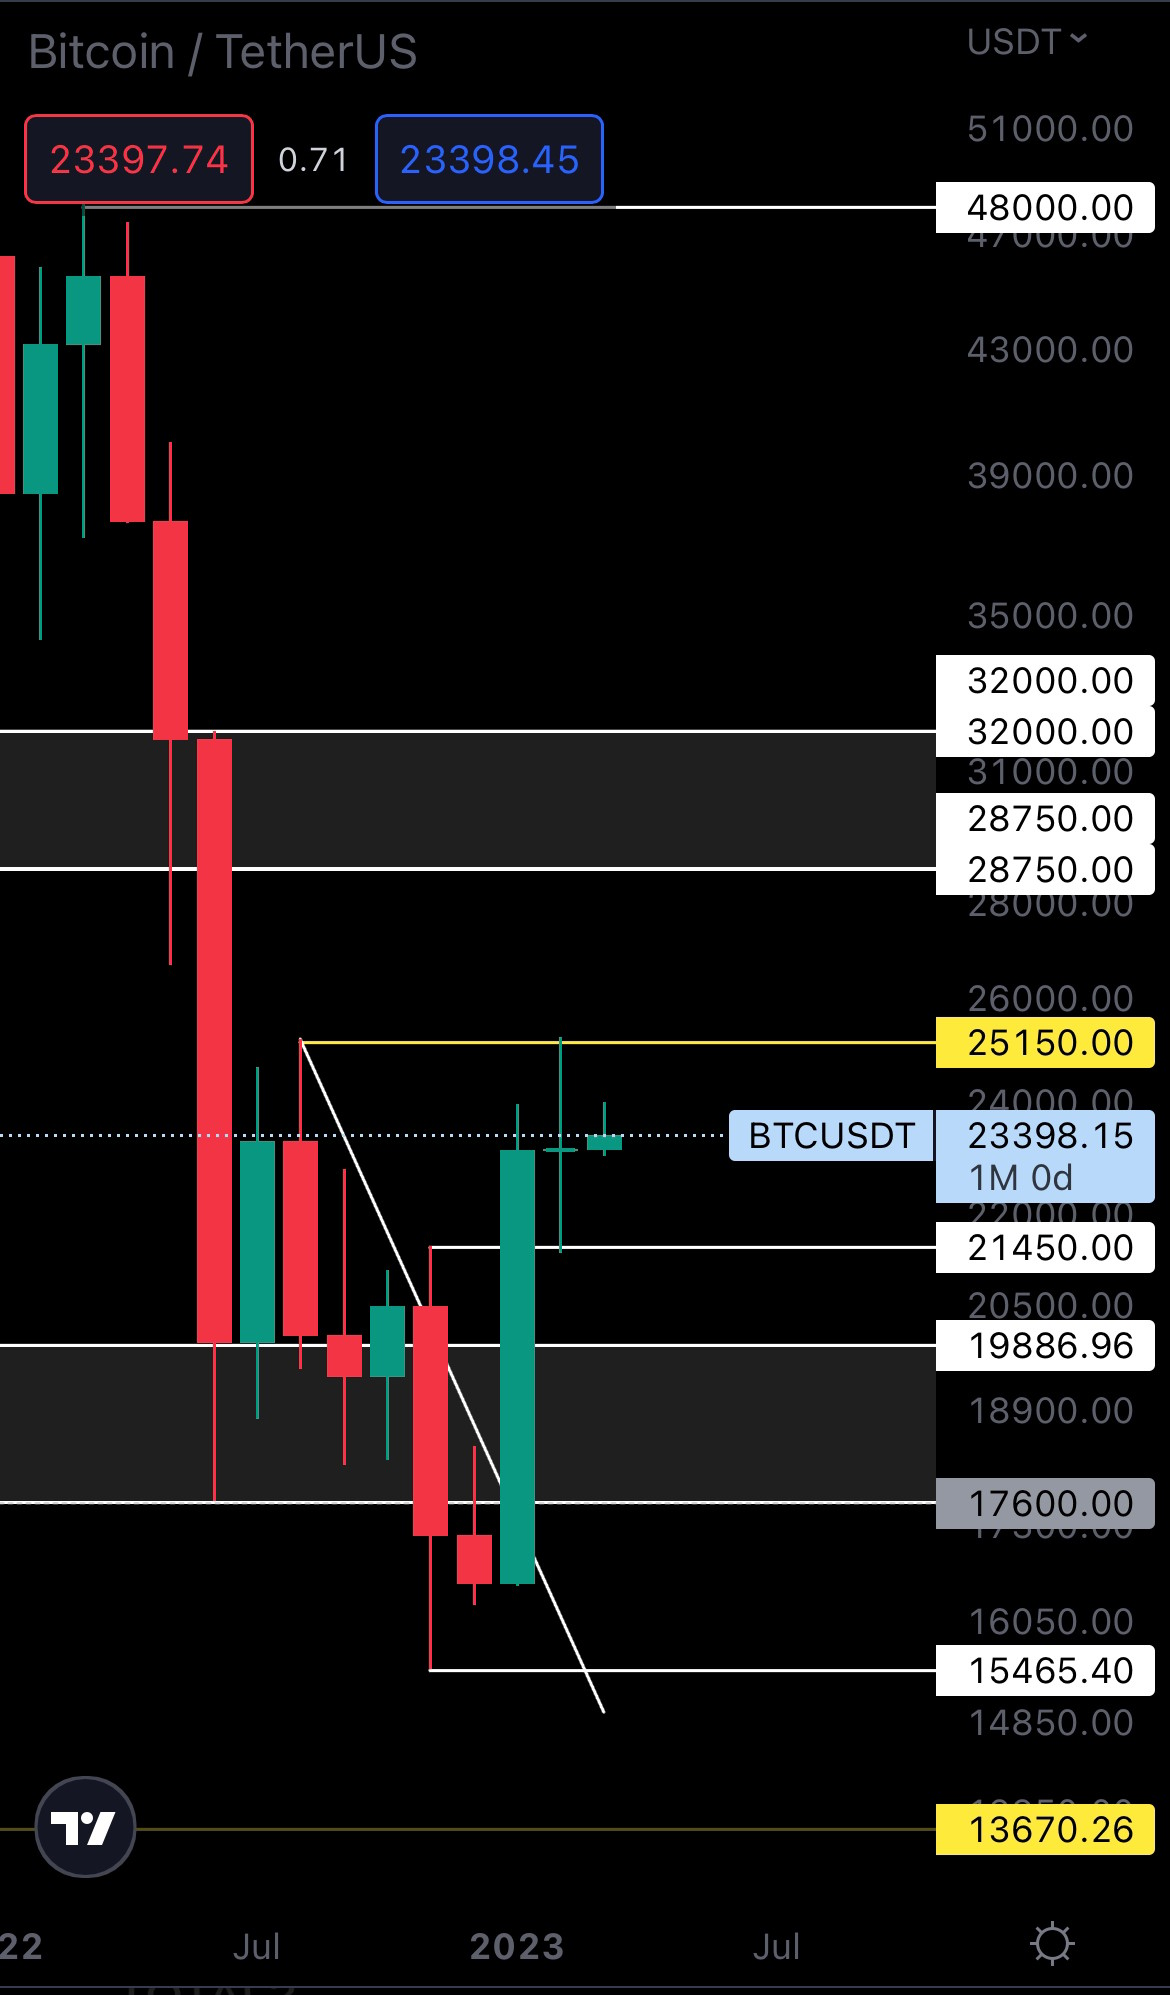
Bitcoin’s weekly market structure remains bullish, so we can only assume that we’ll go up from here in the coming months unless the market structure is broken.
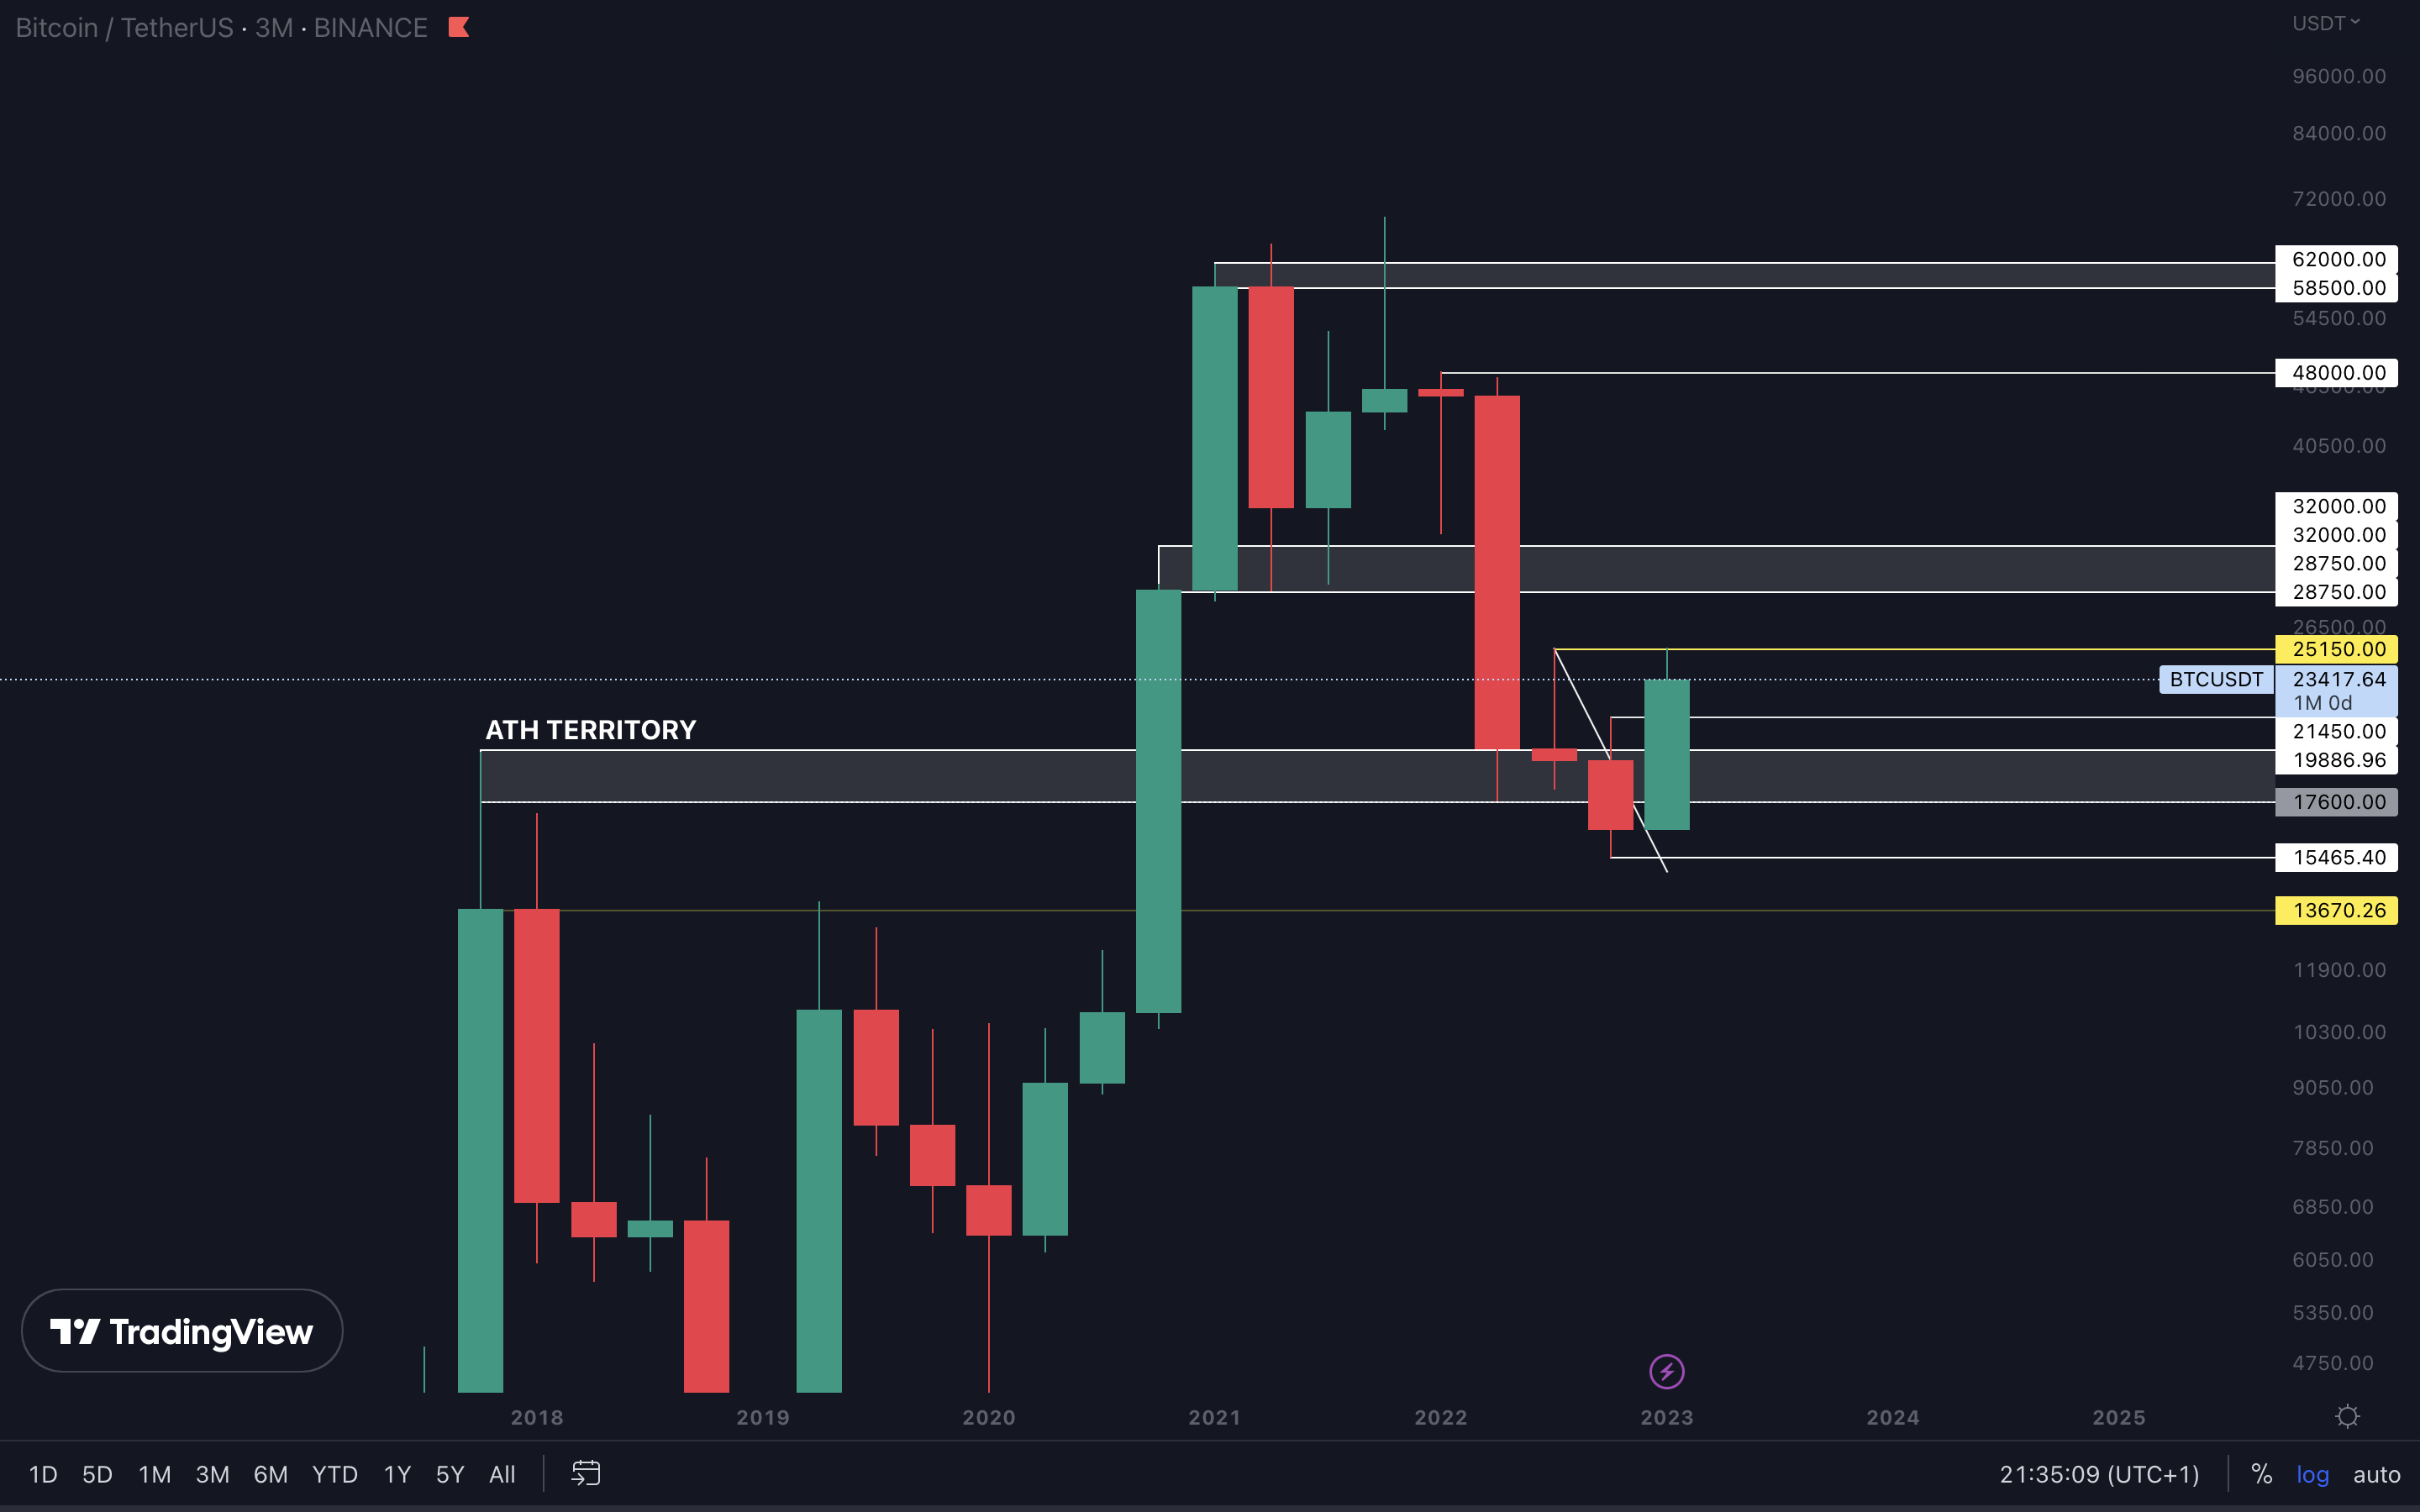
BTC | Bitcoin (3M Timeframe)
ETH | Ethereum (Monthly)
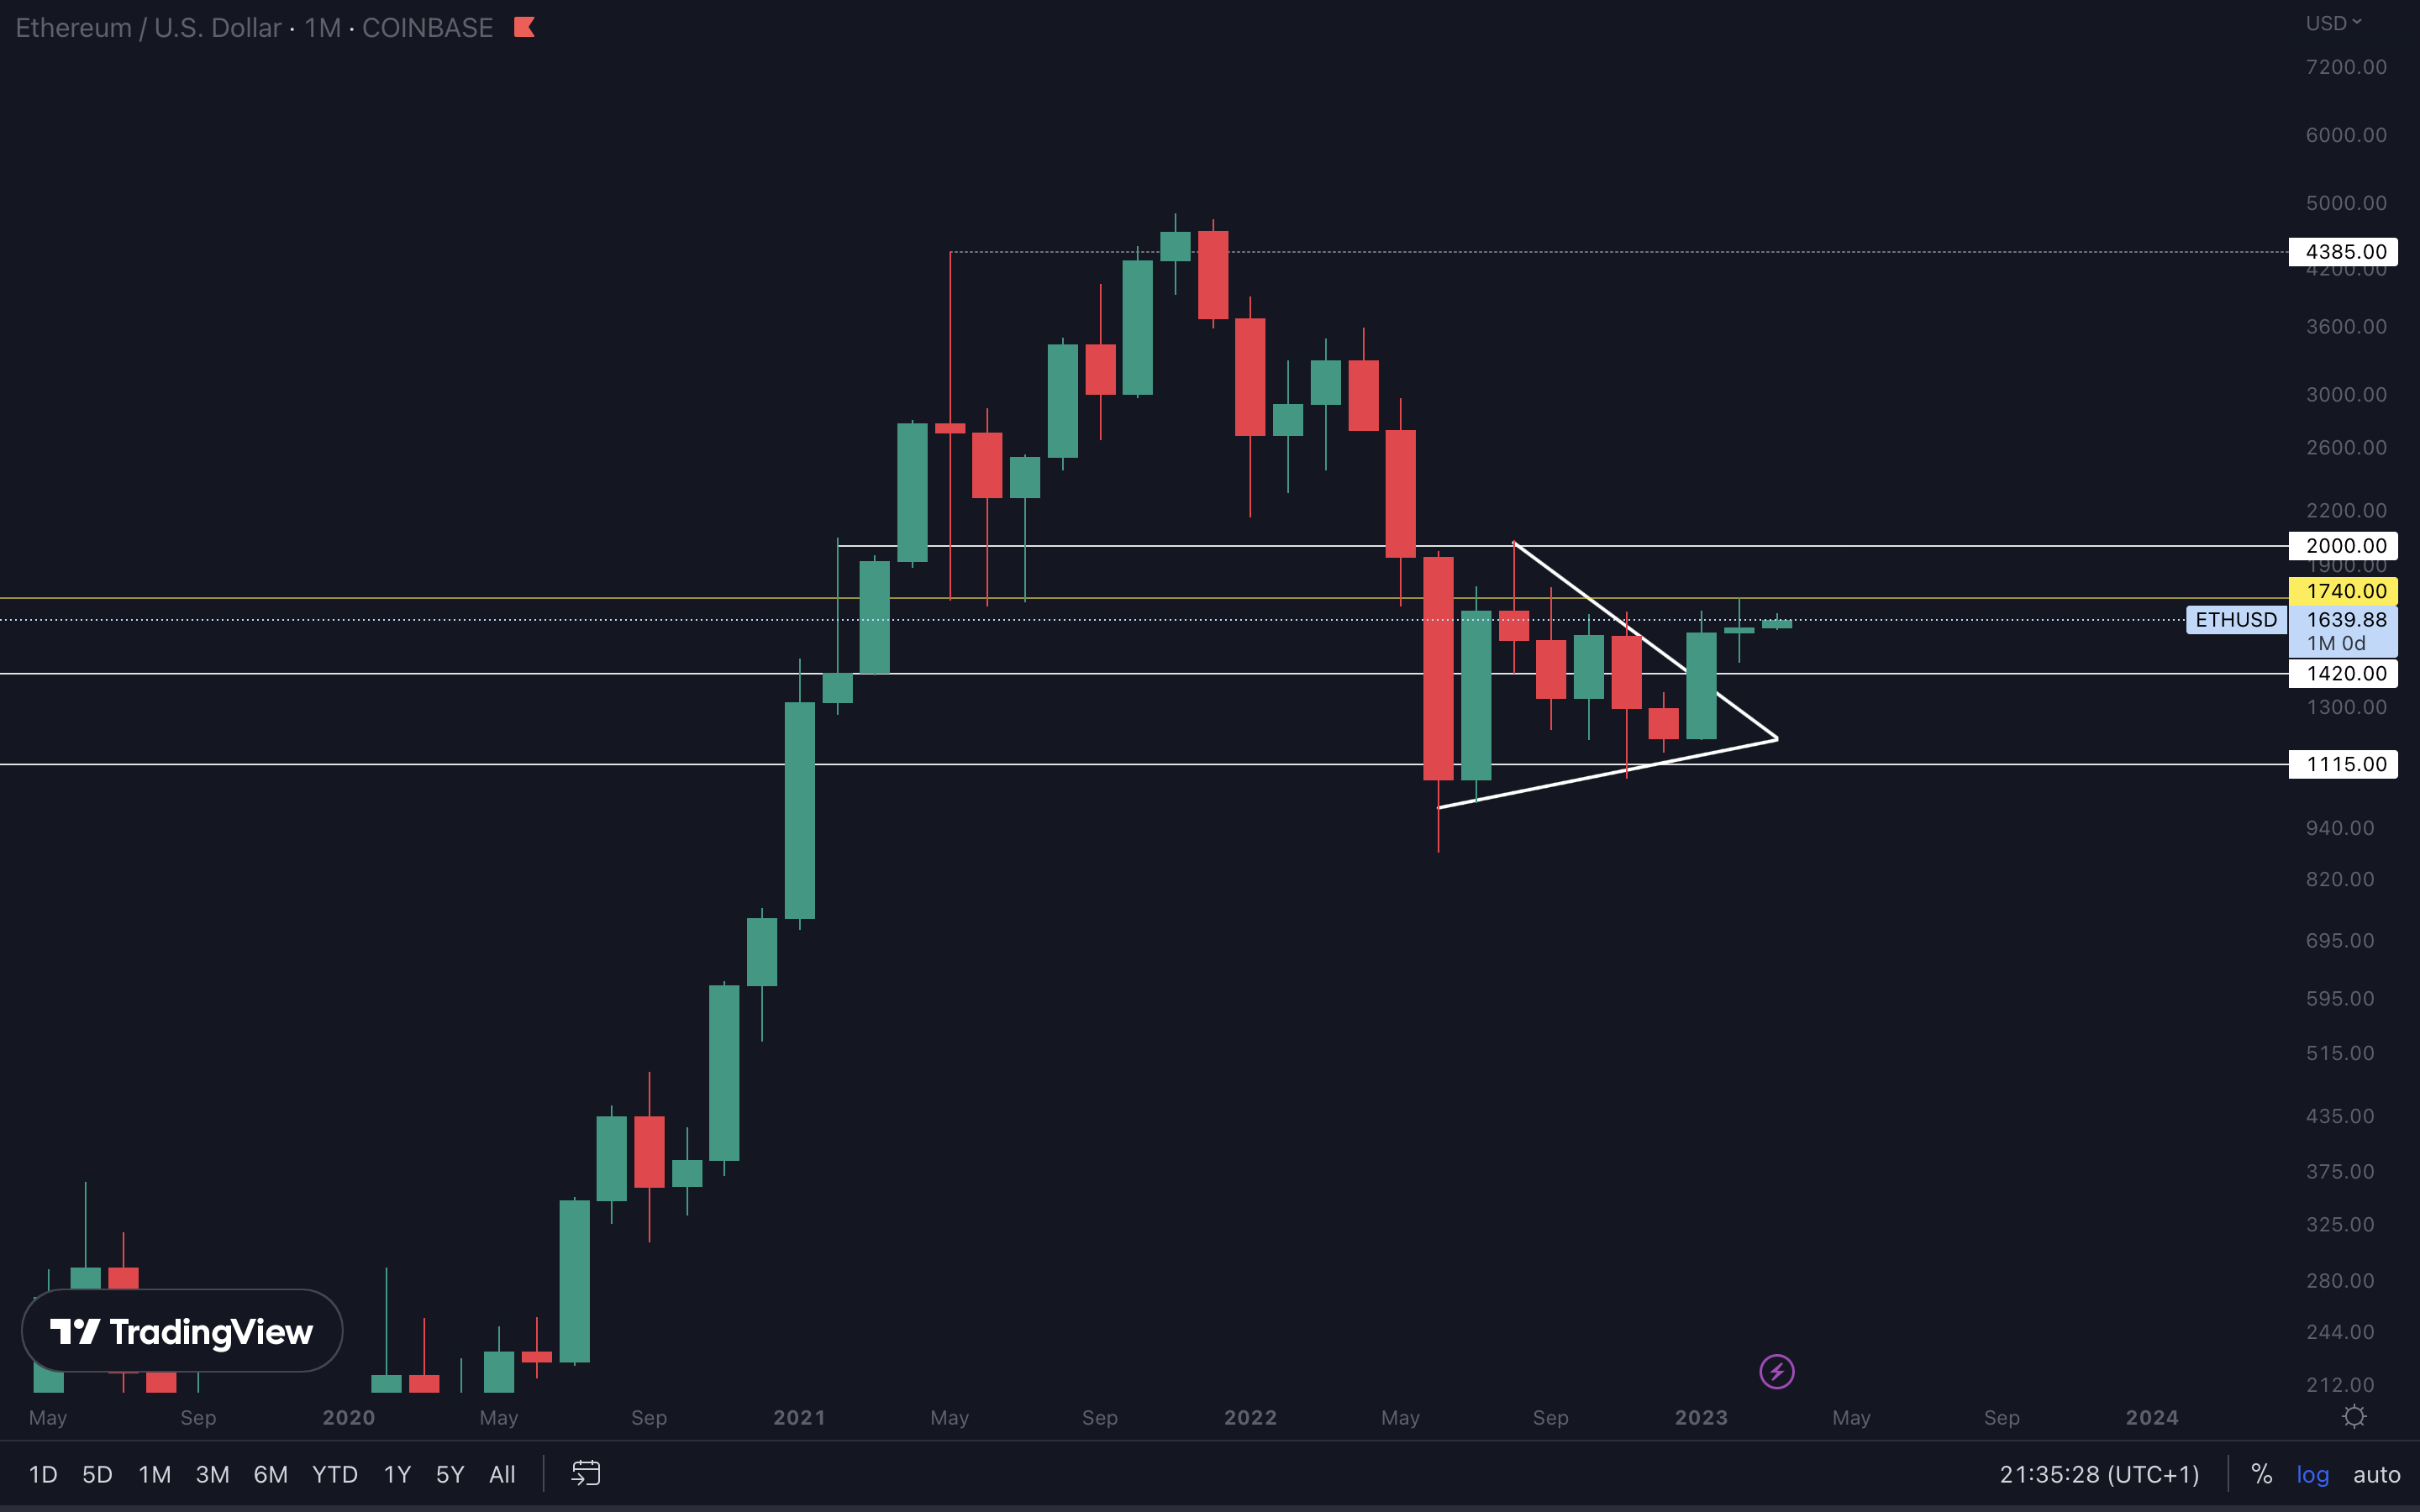
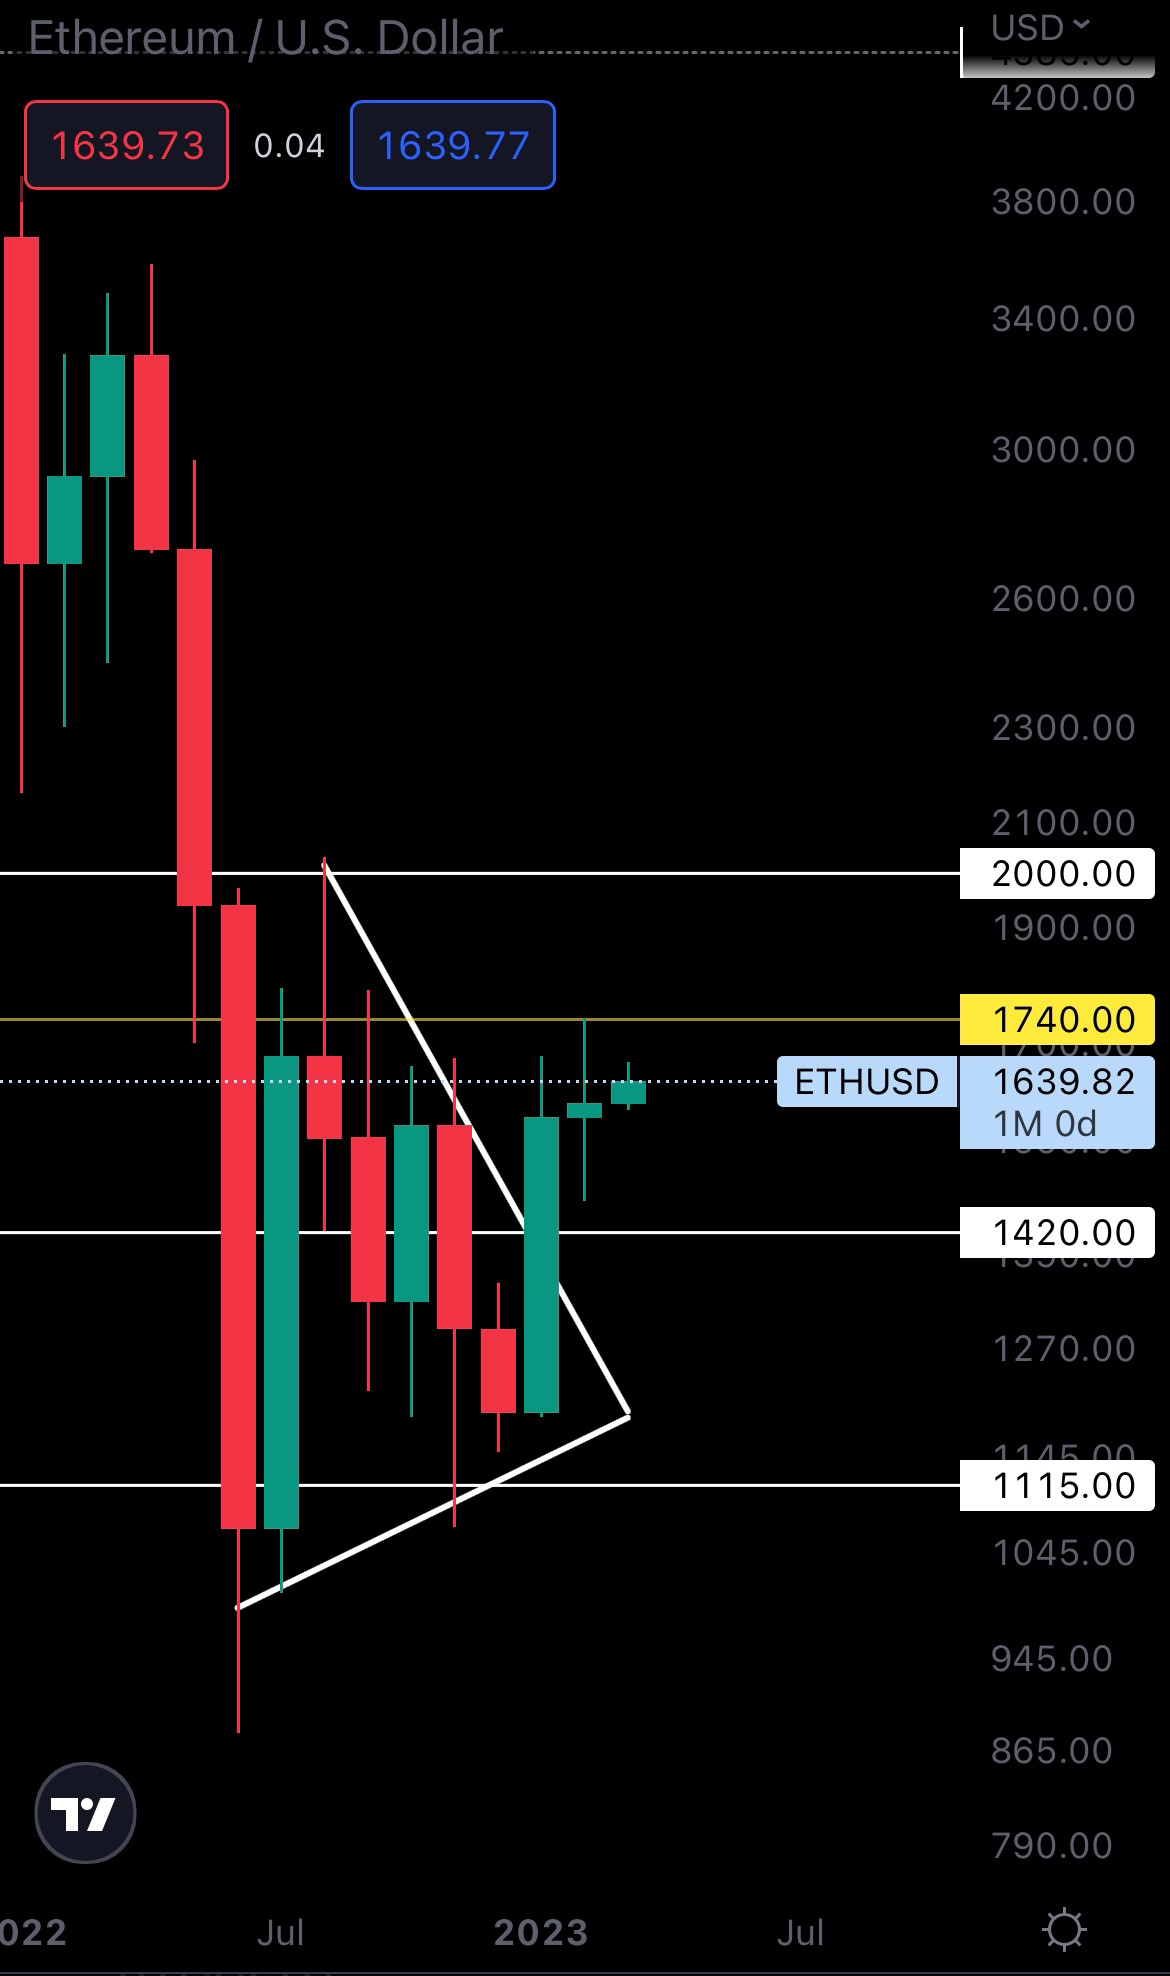
Ether is in the same boat as Bitcoin. The asset is ranging between two levels, $1420 and $1740 and only a break of either of them will confirm the next direction. Given how the market is looking bullish at this time, we might see Ether reaching $1740 and potentially breaking above it in March. Our trajectory for Q2 is UP, so a weekly reclaim $1740 will put $2000 on the cards, a level which we believe will be tested during Q2.
SOL | Solana (Monthly)
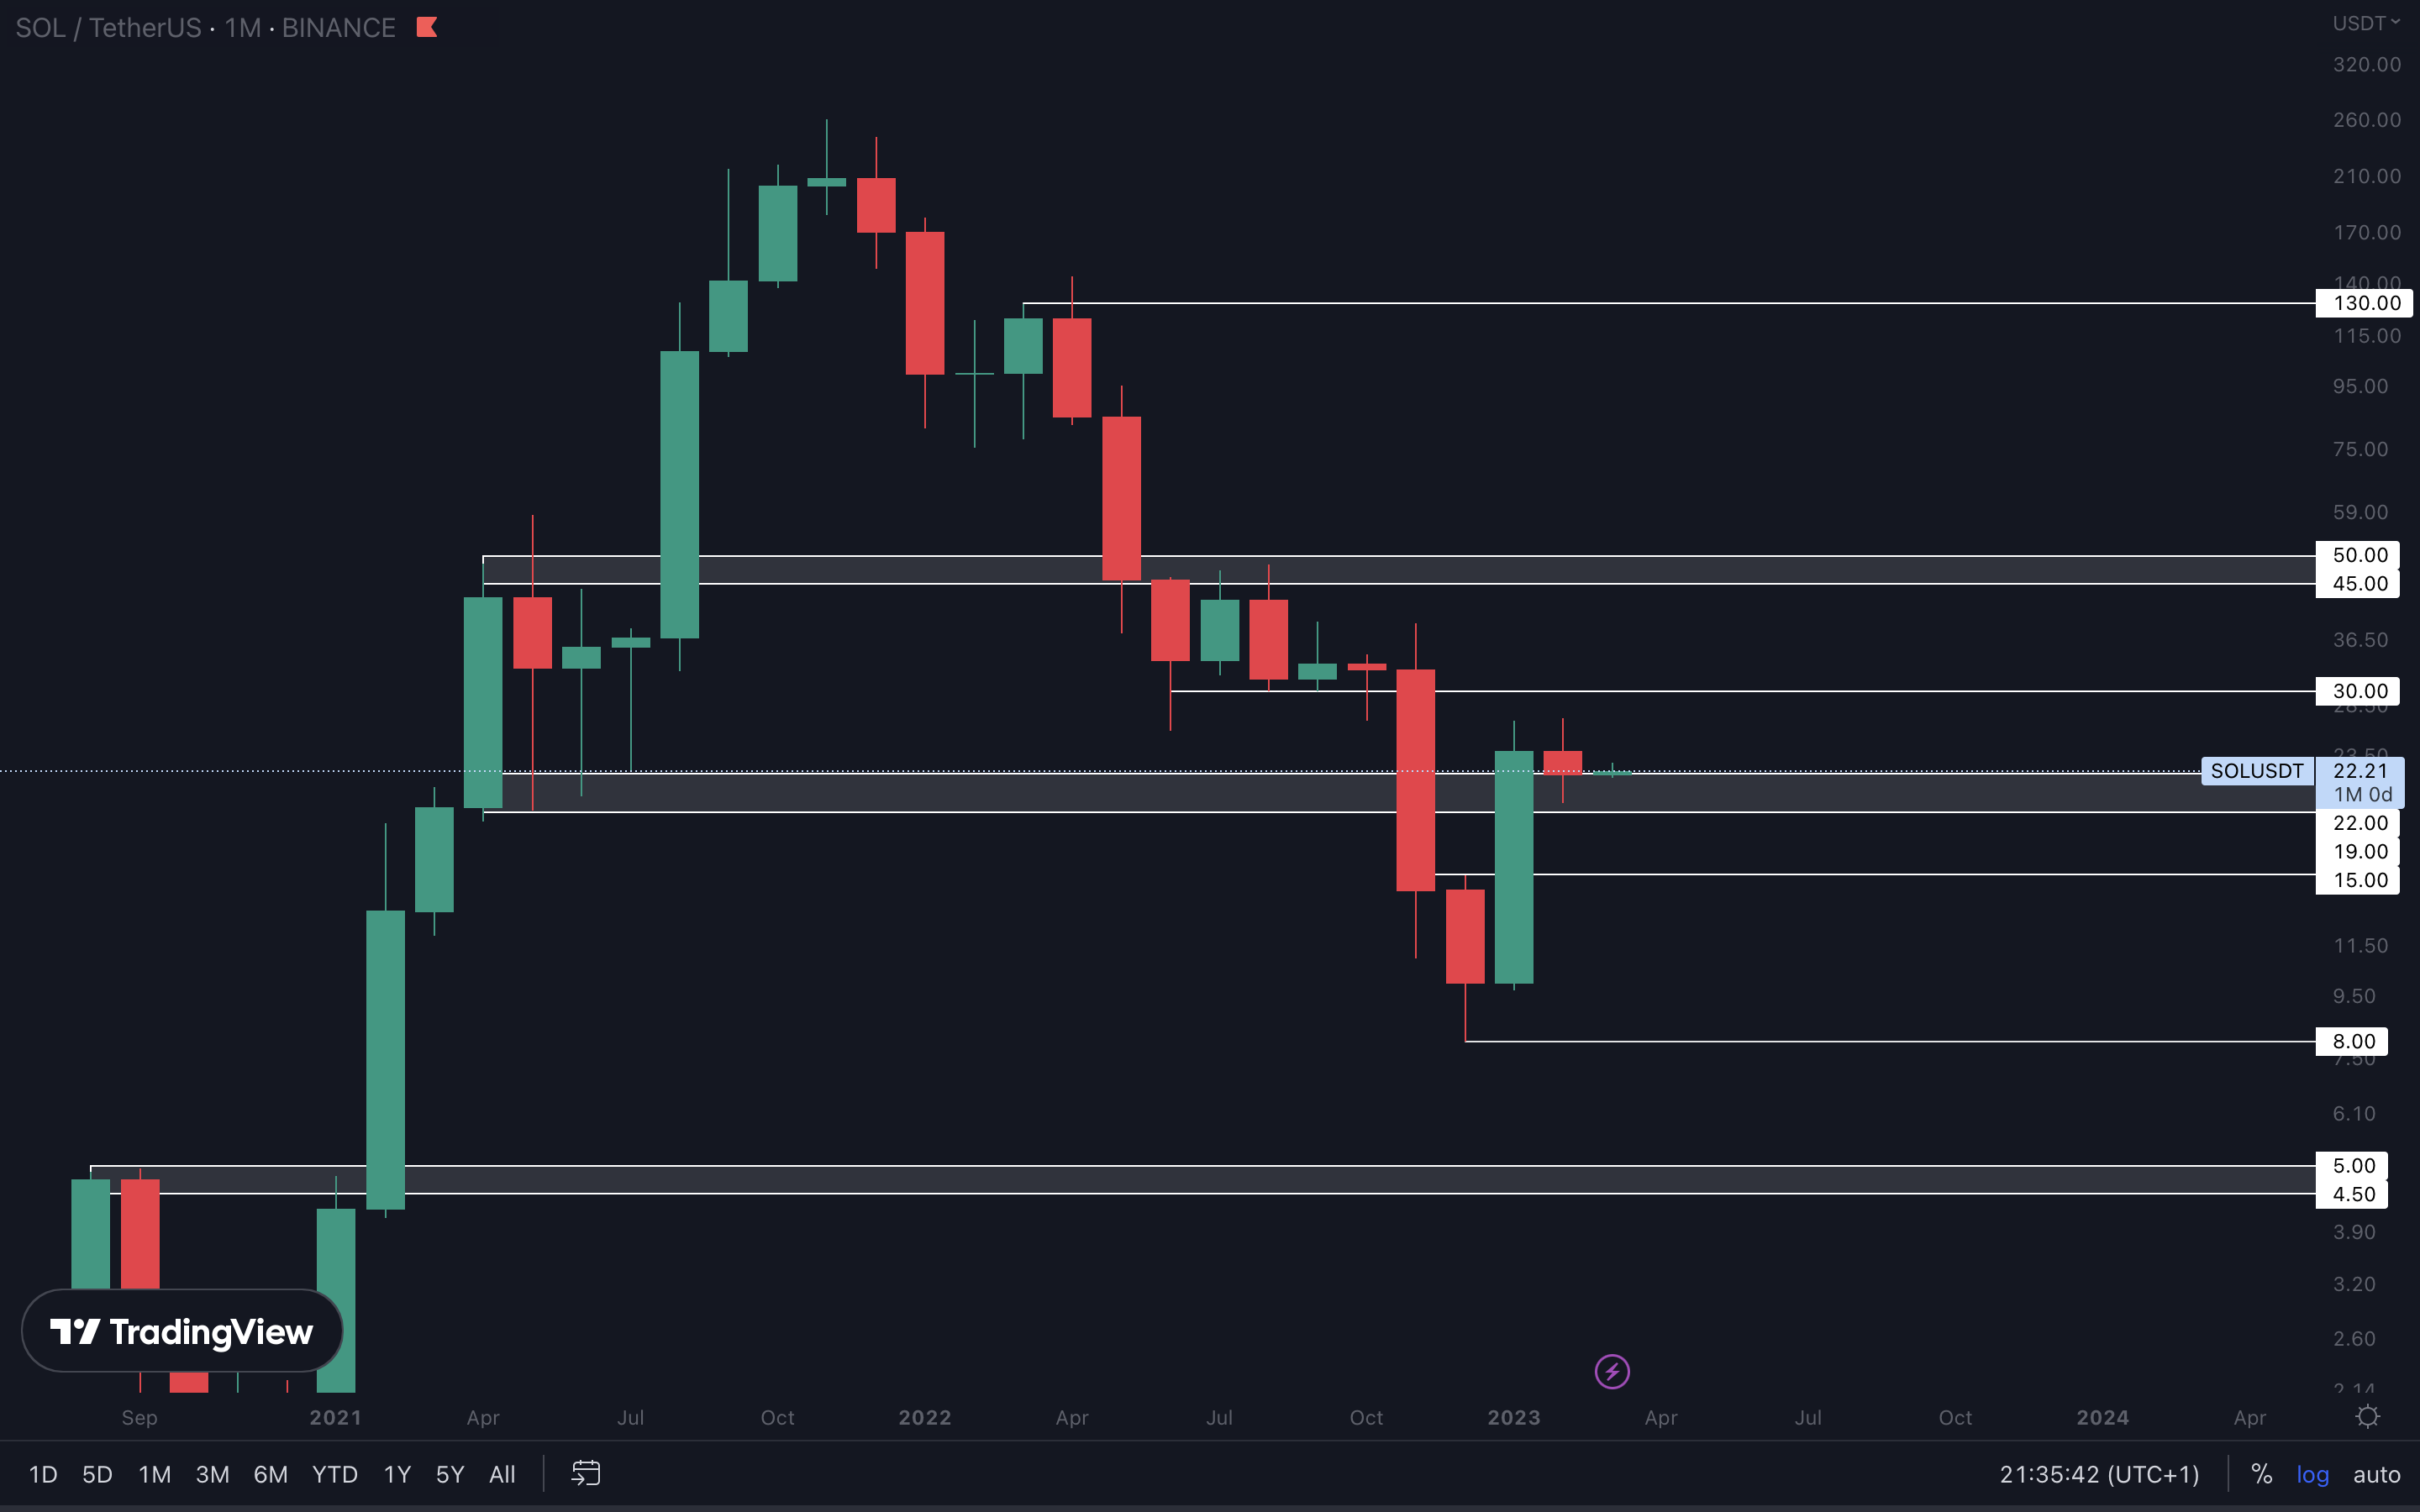
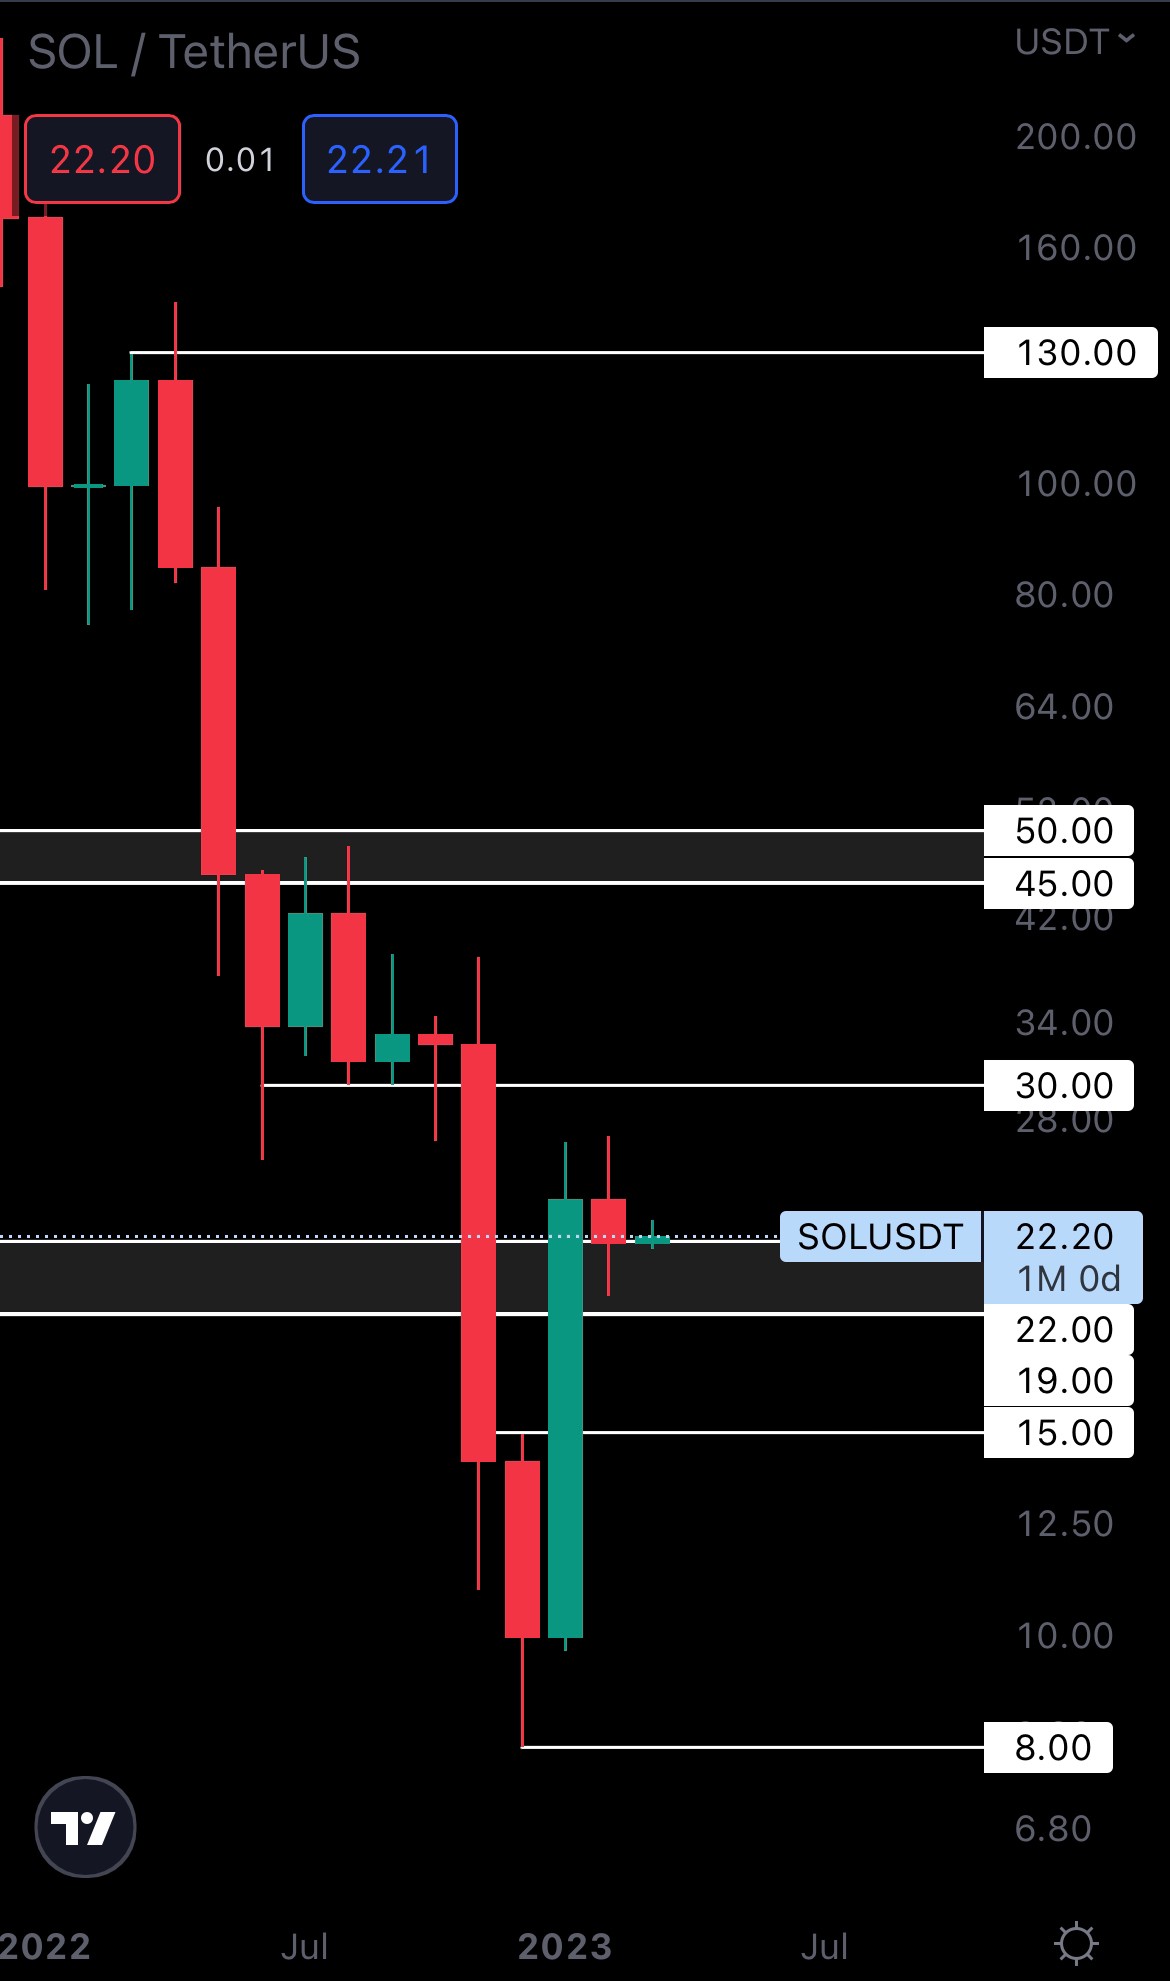
We stand our ground - unless SOL closes a weekly candle under $19 (bottom of the gray support area), the asset will reach $30 during March or at some point in Q2. SOL will follow the market’s trajectory, so we should assume that it will also have a bullish Q2.
RUNE | THORChain (Monthly)

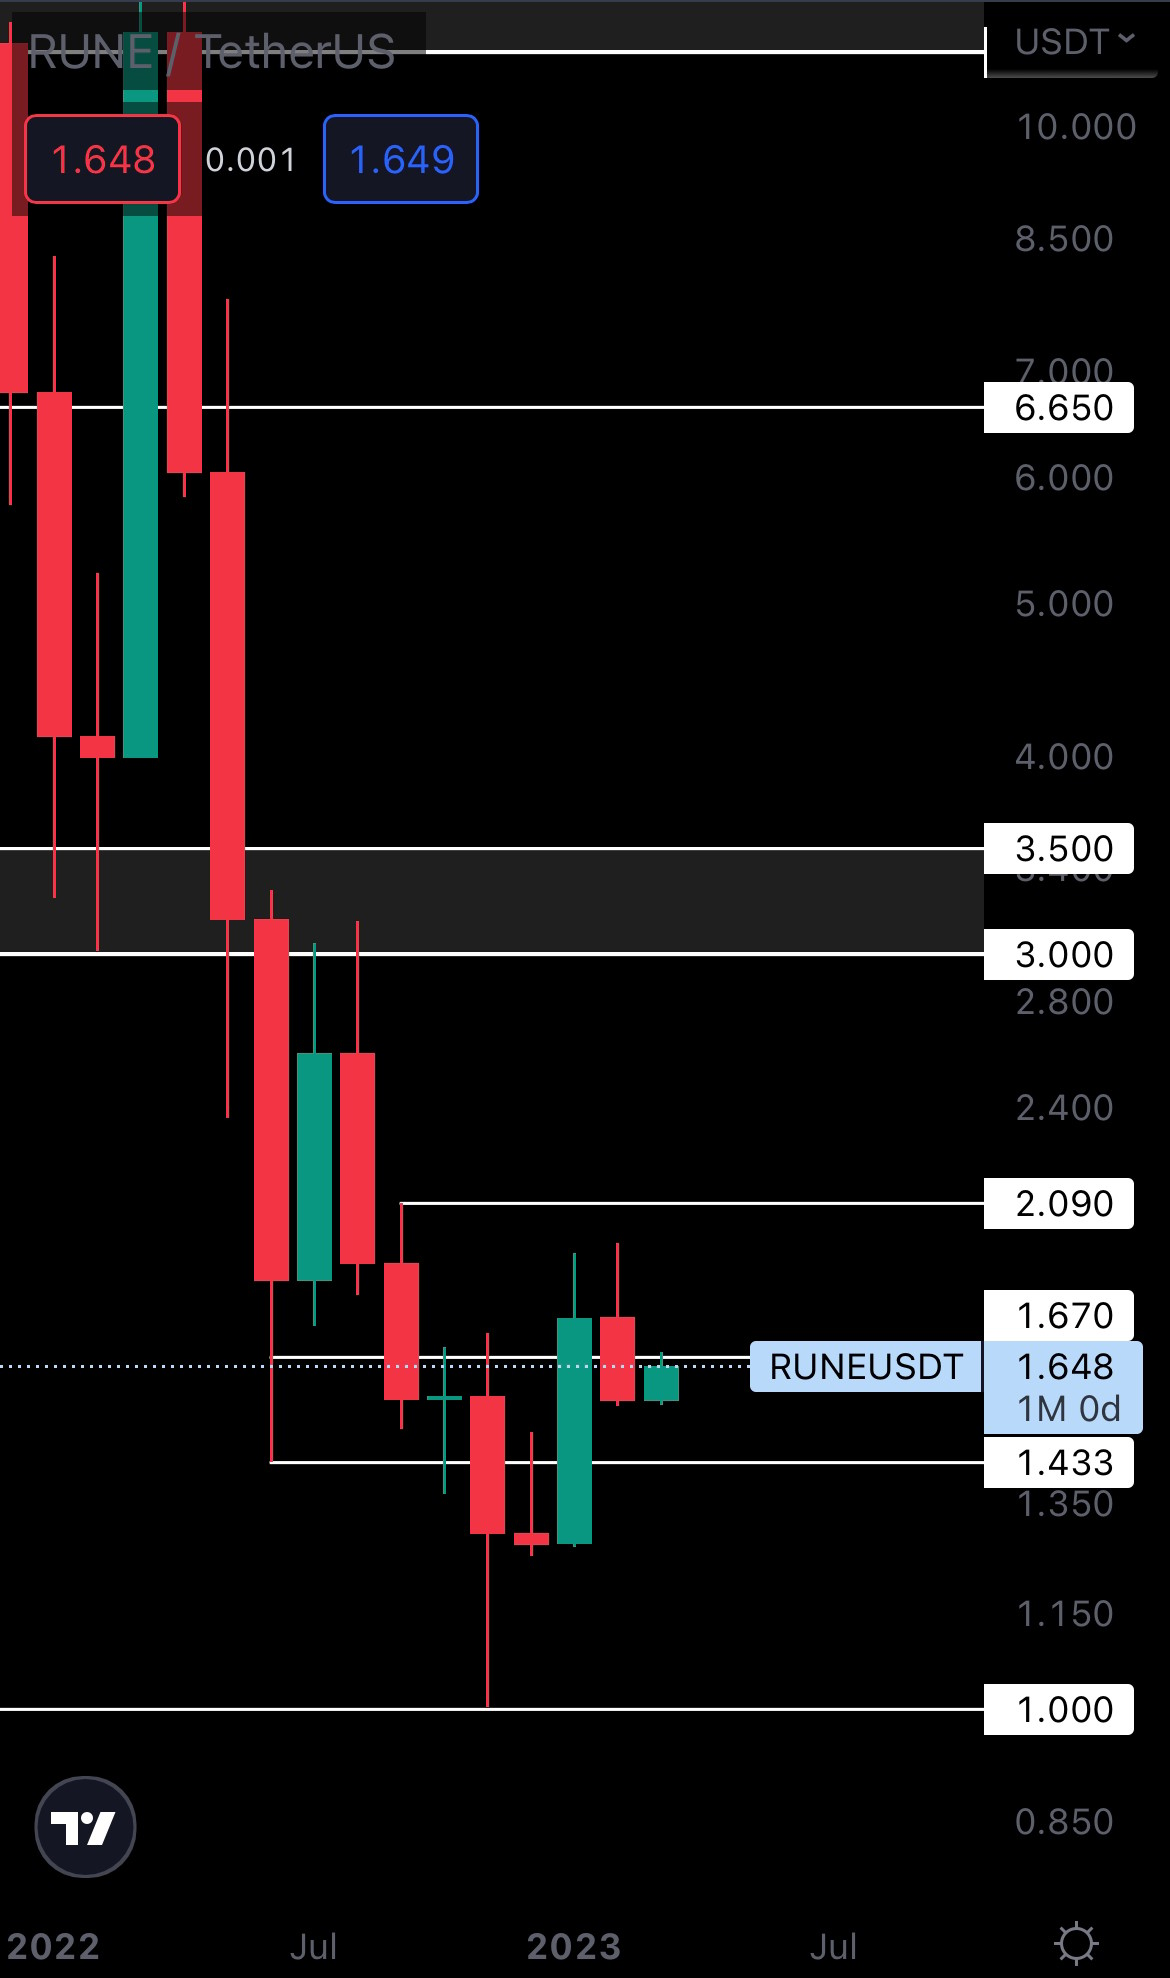
RUNE closed a full-bodied monthly candle under $1.67. From a technical standpoint, we should now be expecting it to reach $1.43. Of course, this scenario isn’t guaranteed and a good-performing BTC could push RUNE back above $1.67. If RUNE closes a weekly candle above $1.67, the scenario above is invalidated and it might actually have a change at testing $2.09 in March or Q2, which is in confluence with the market’s trajectory.
SNX | Synthetix (Monthly)
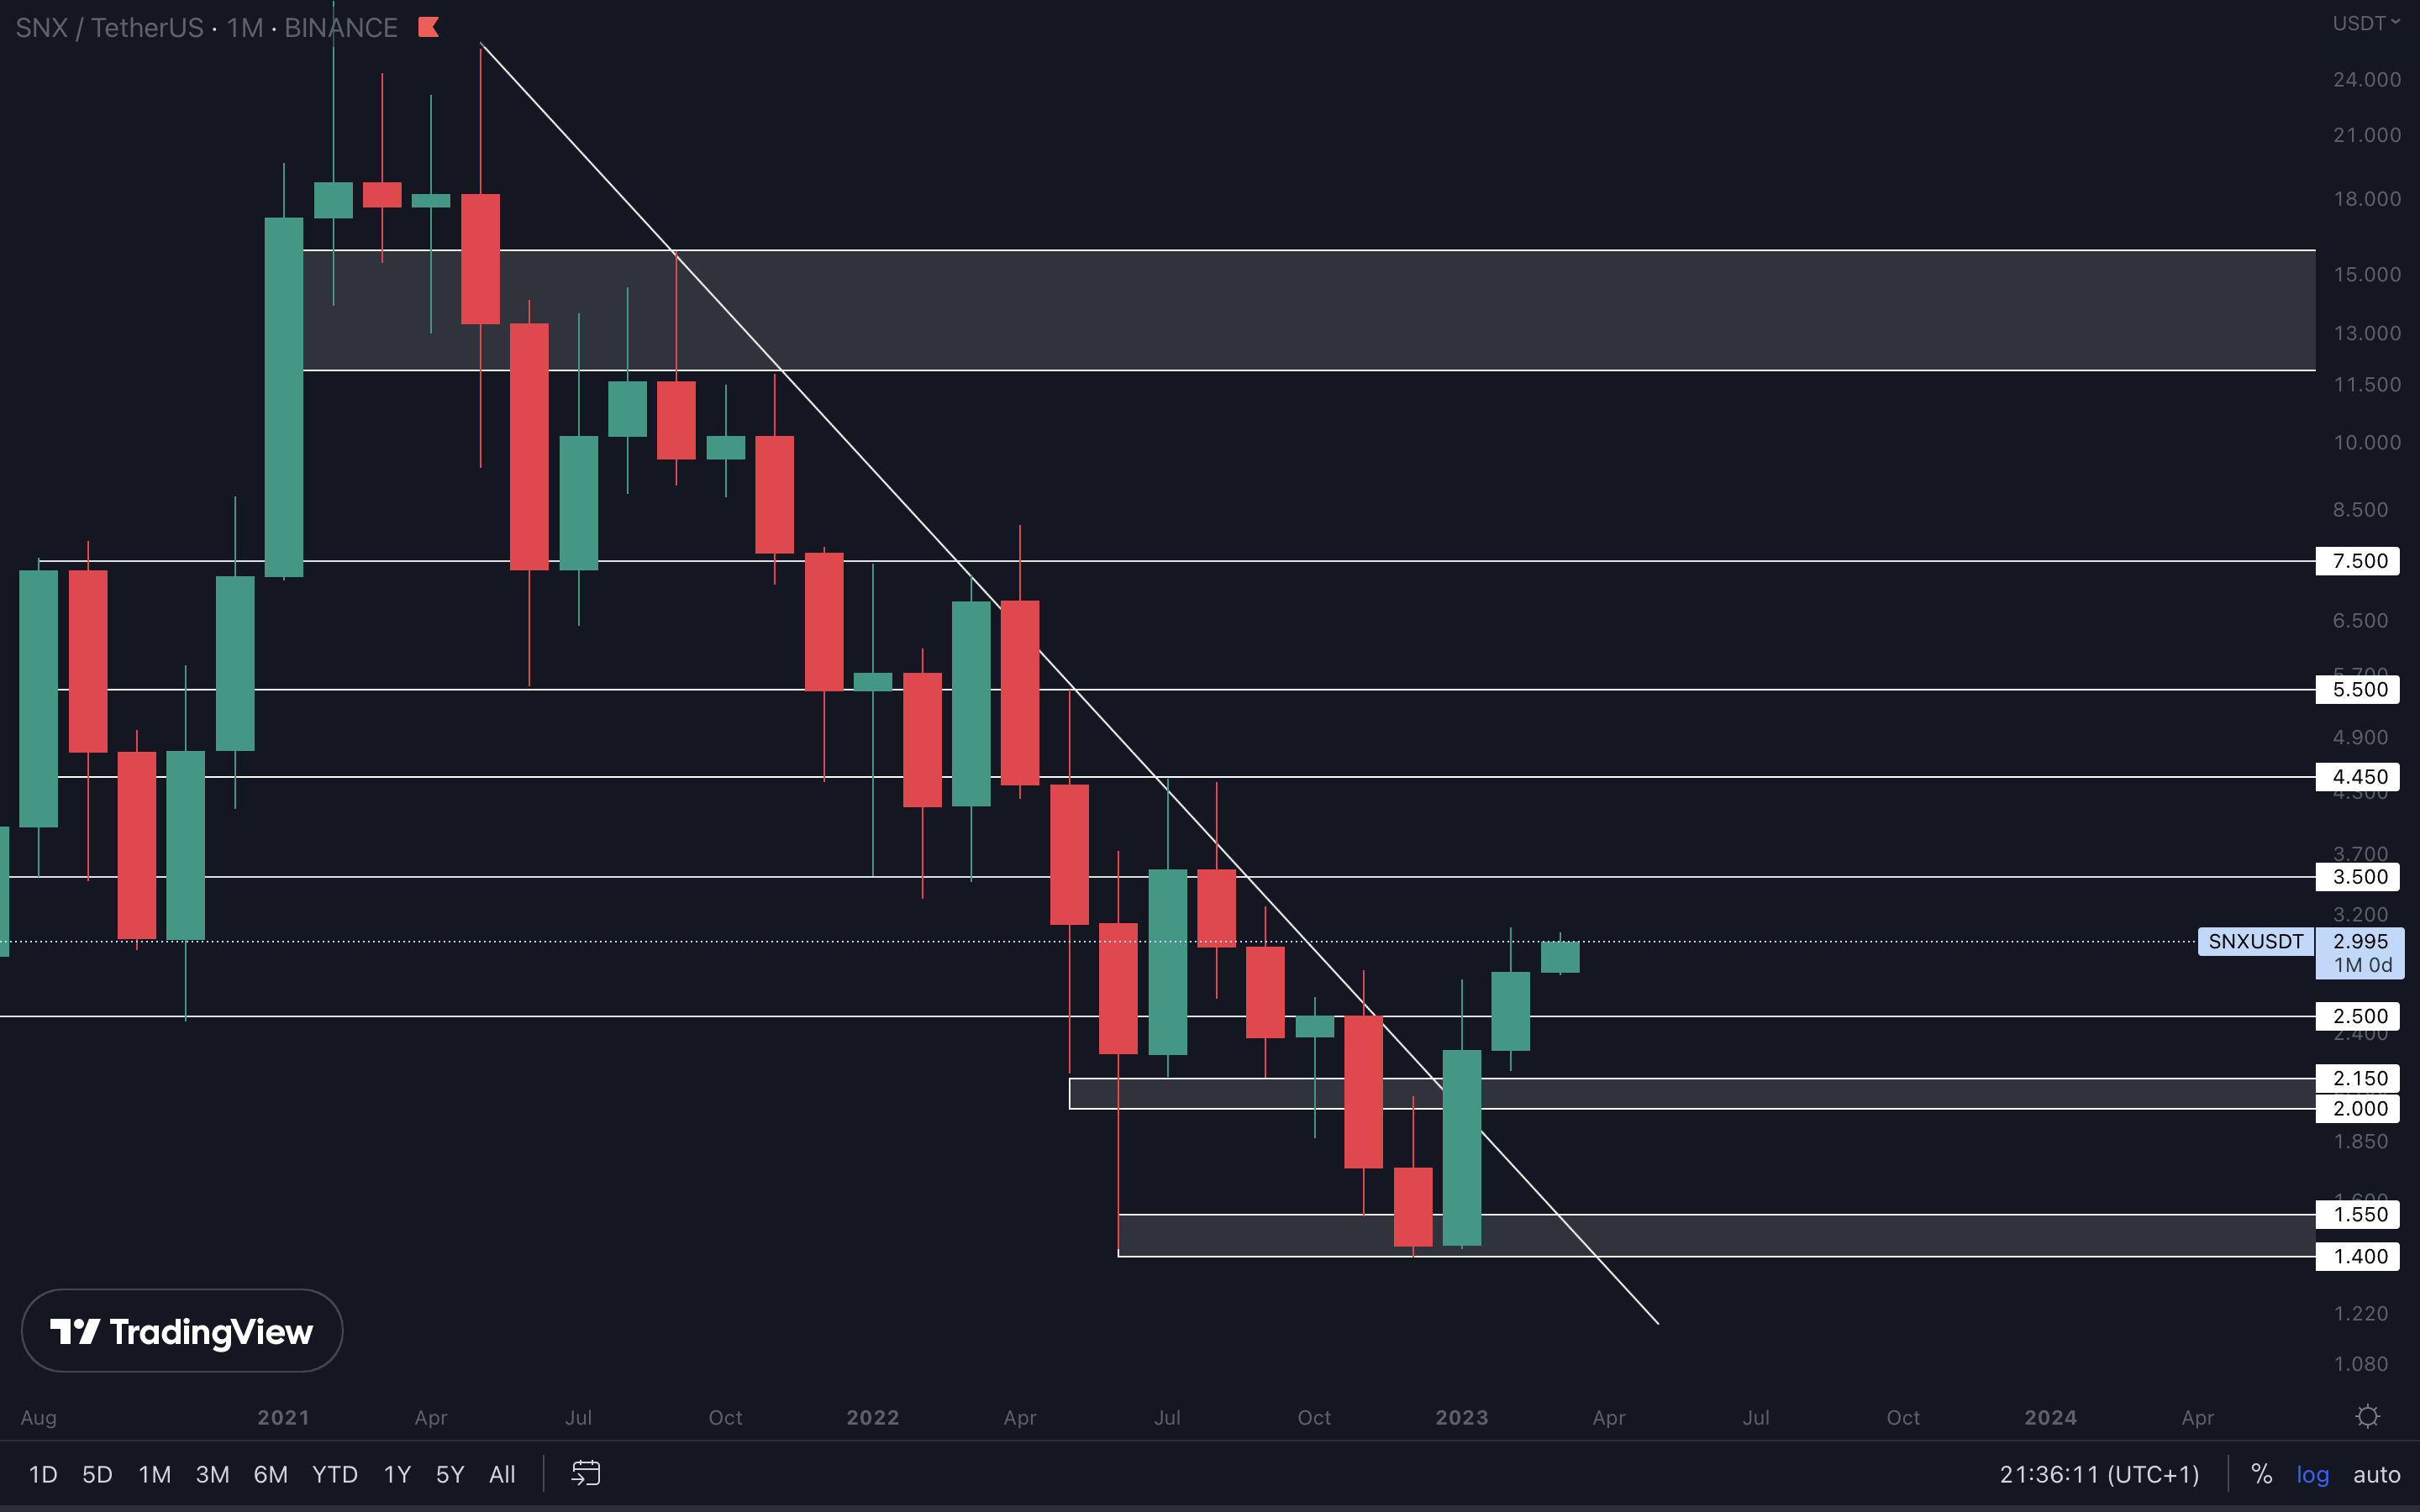
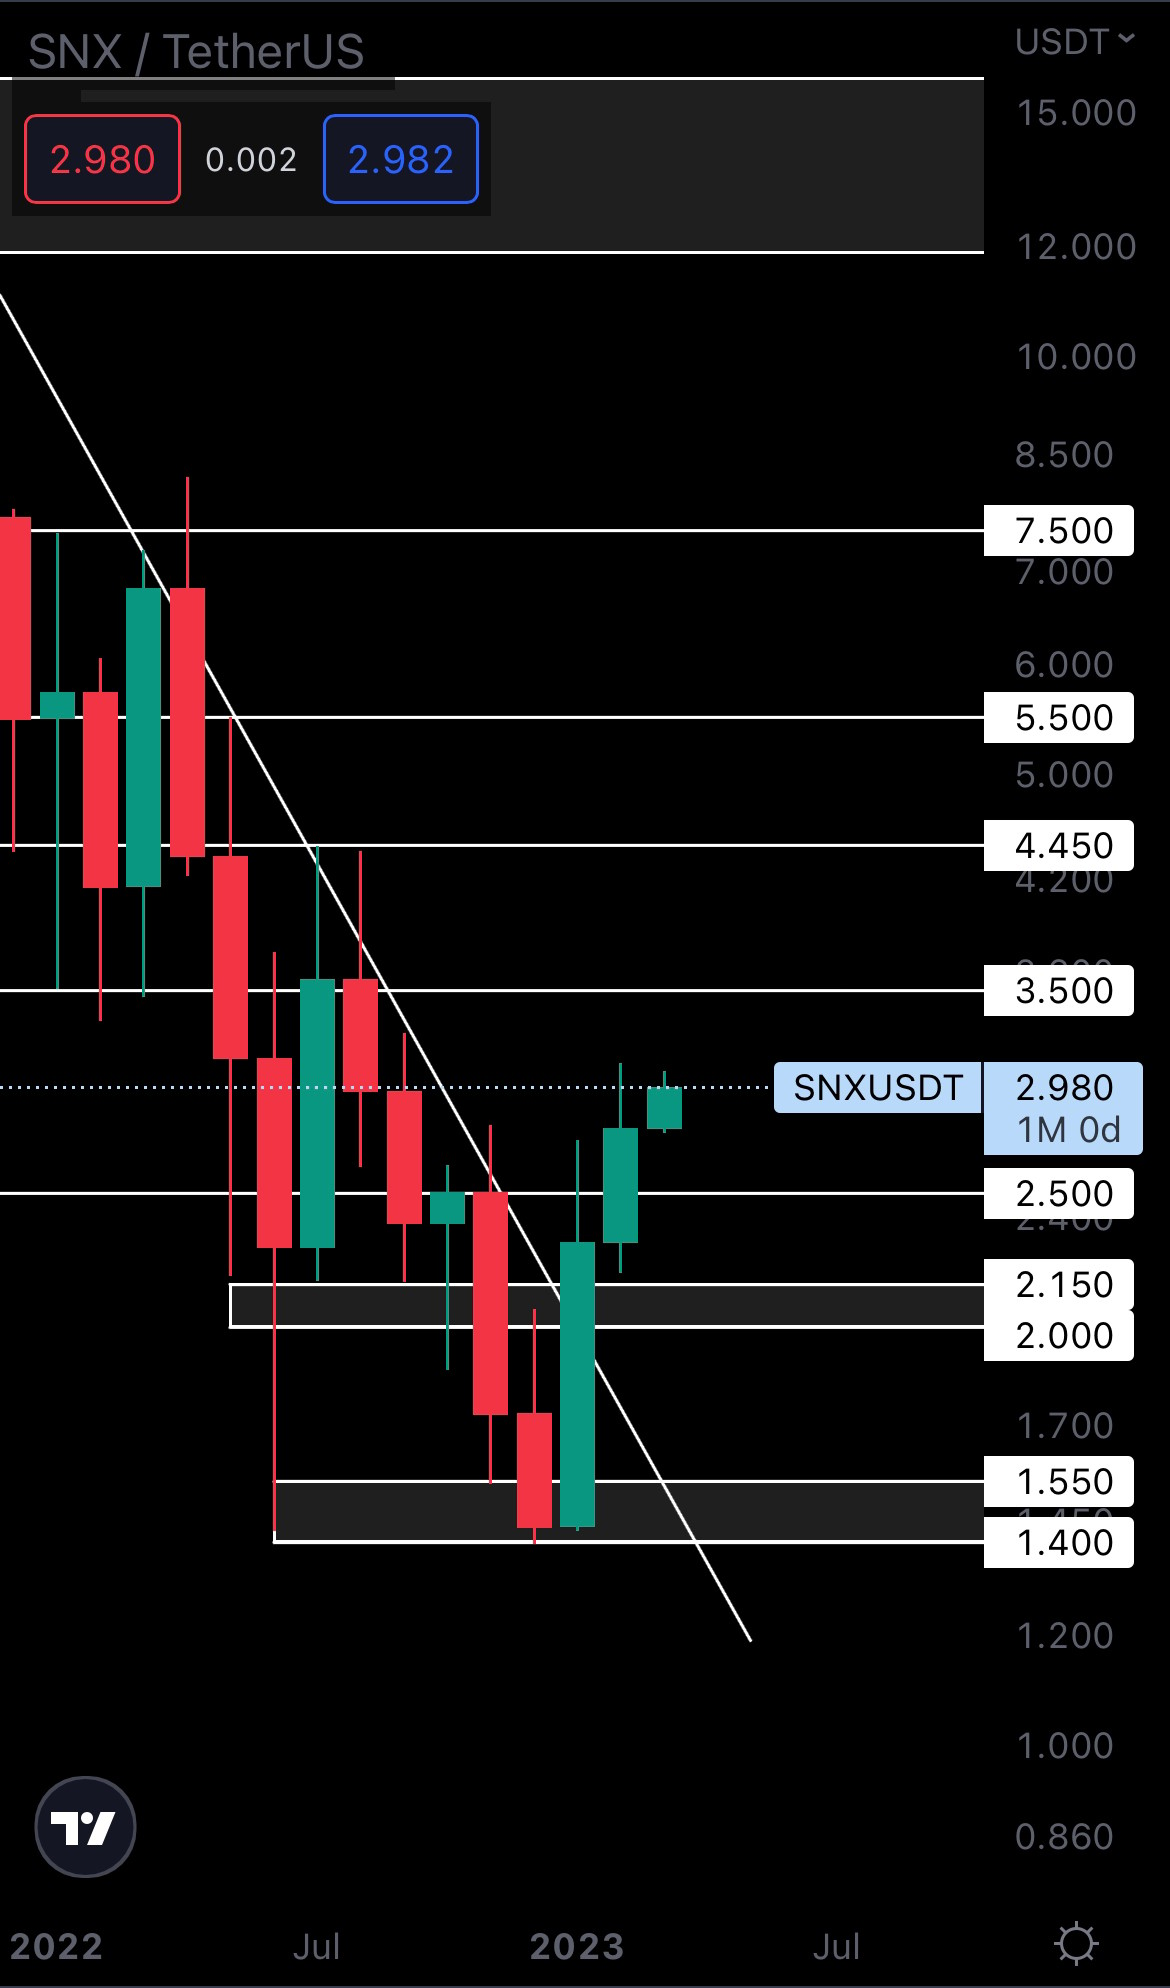
Because SNX closed last month’s candle above $2.50, we now have a strong confirmation that upside will follow. Our first target sits at $3.50, with $4.45, $5.50 and $7.50 following after that. For the rest of our targets to be put on the cards, SYN will have to reclaim the previous levels. As an example, we’ll have a confirmation for $4.45 only when SNX closes a weekly candle above $3.50.
dYdX | DYDX (Weekly)
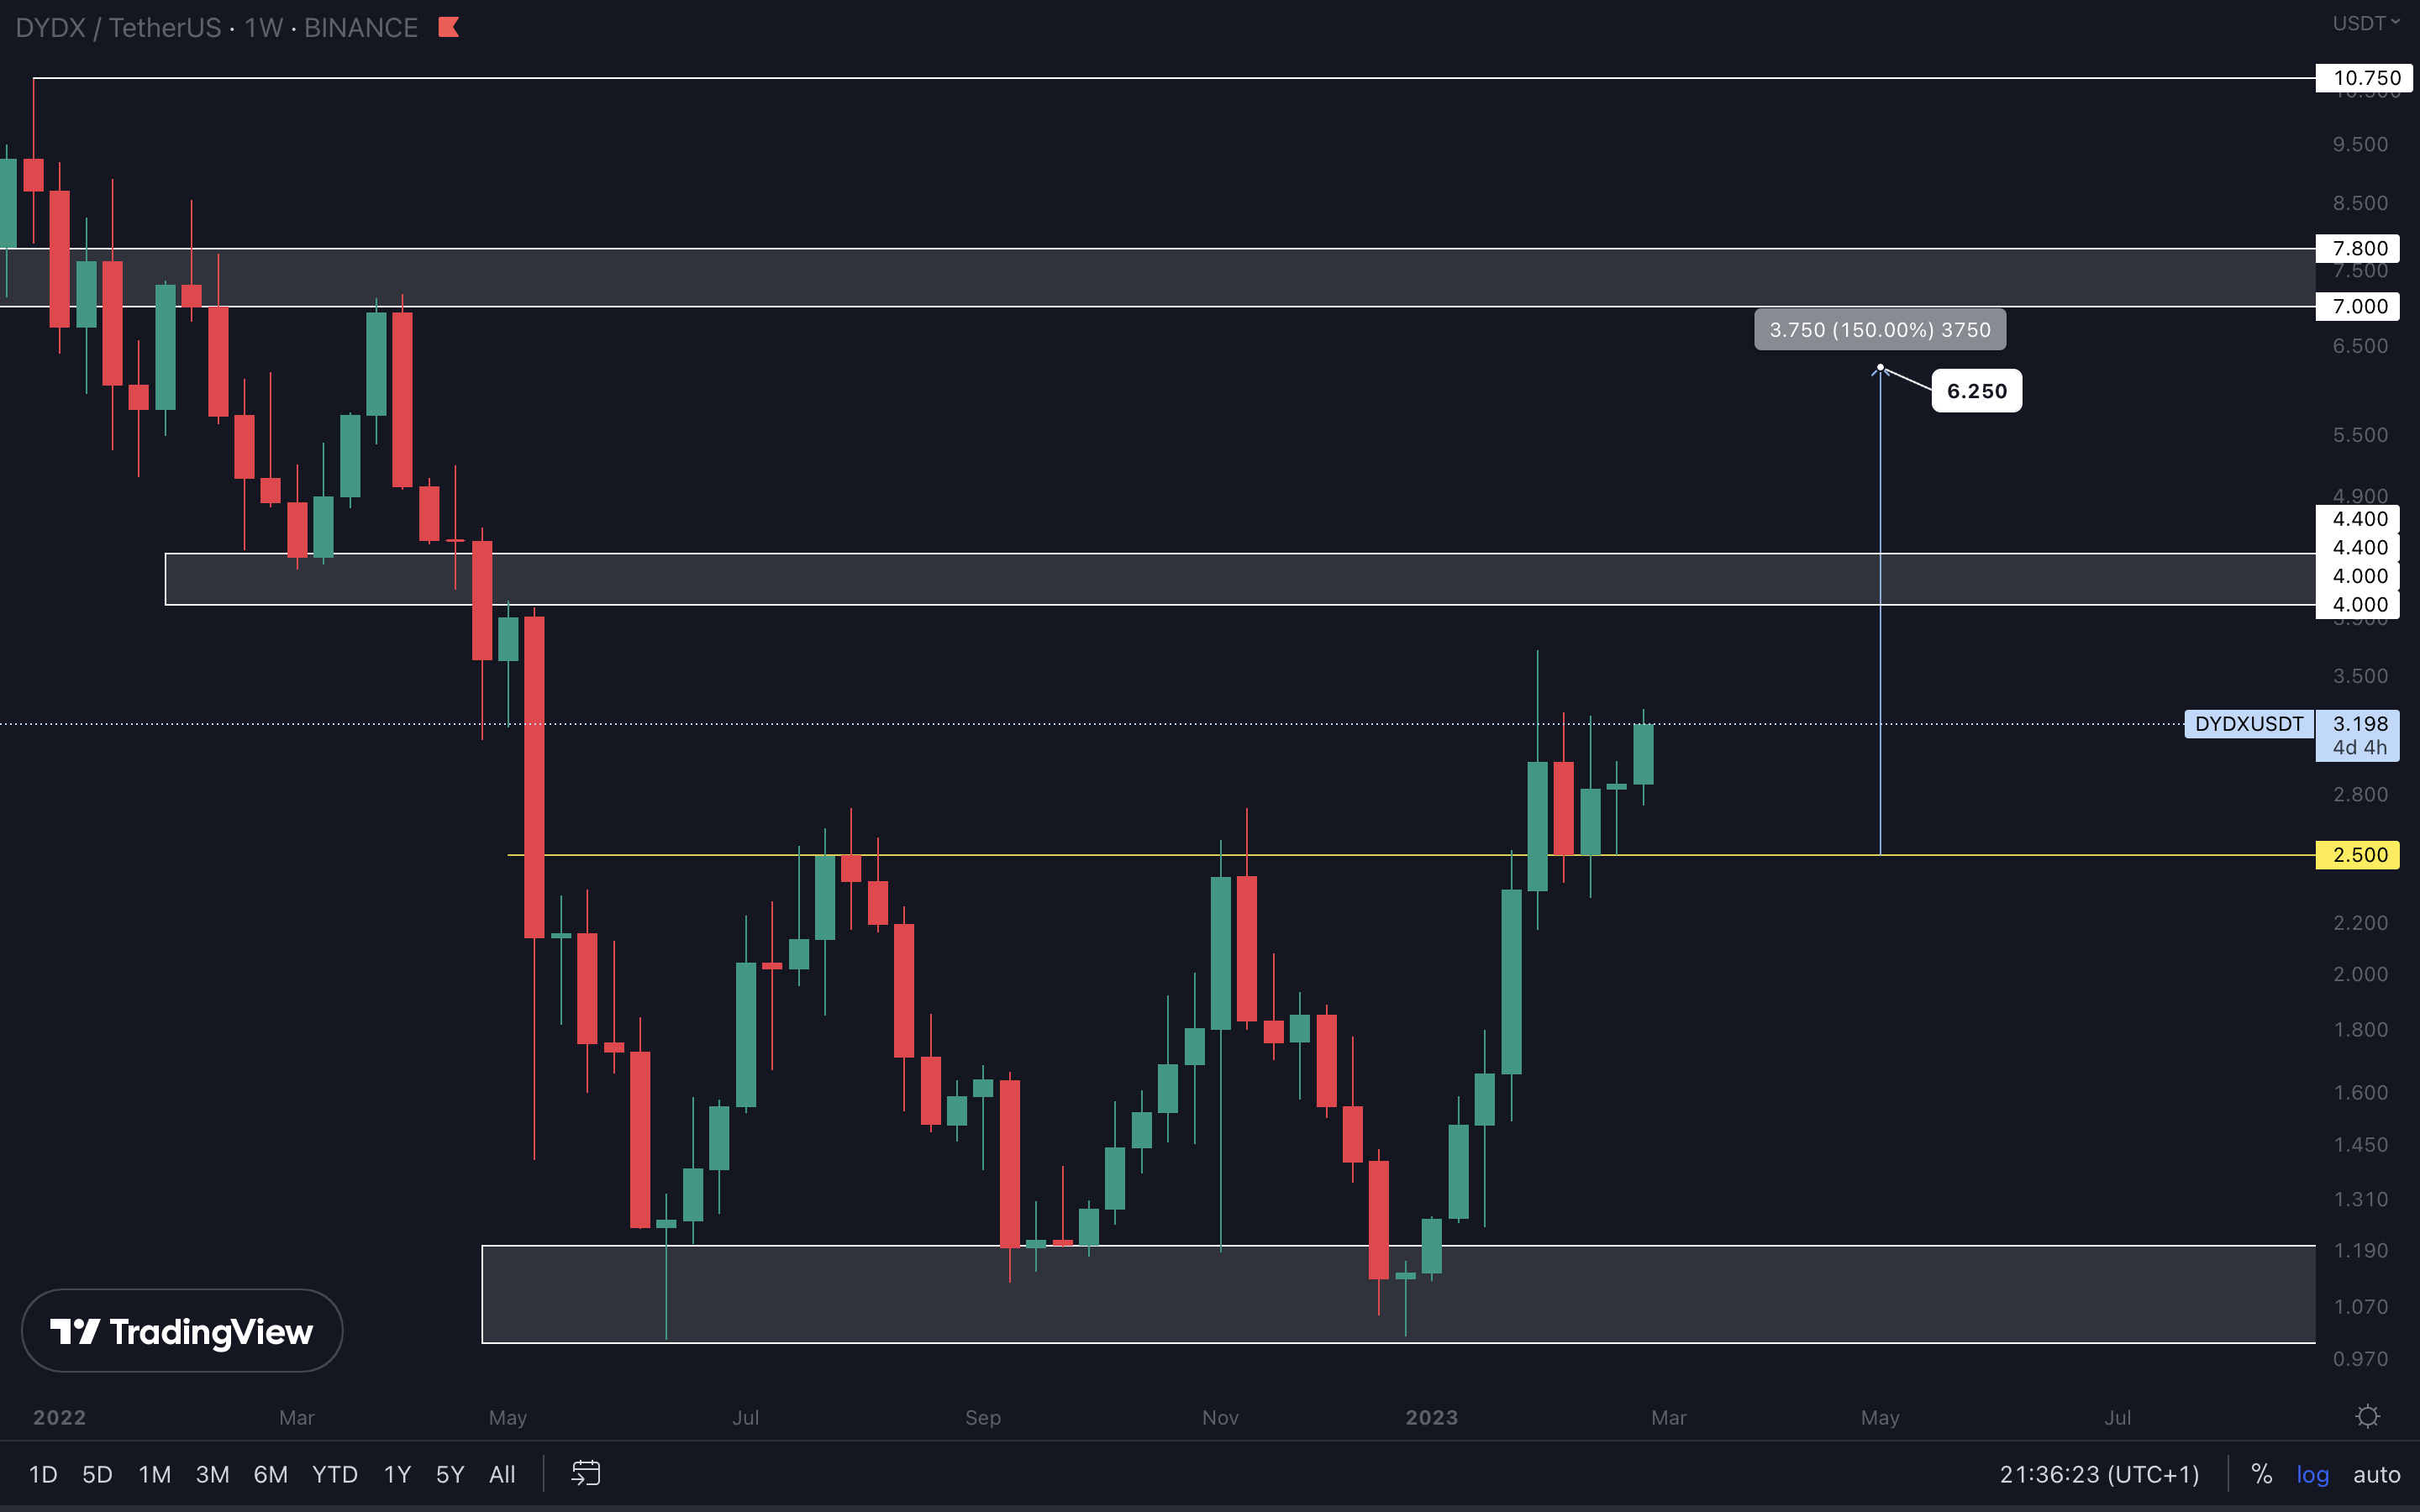
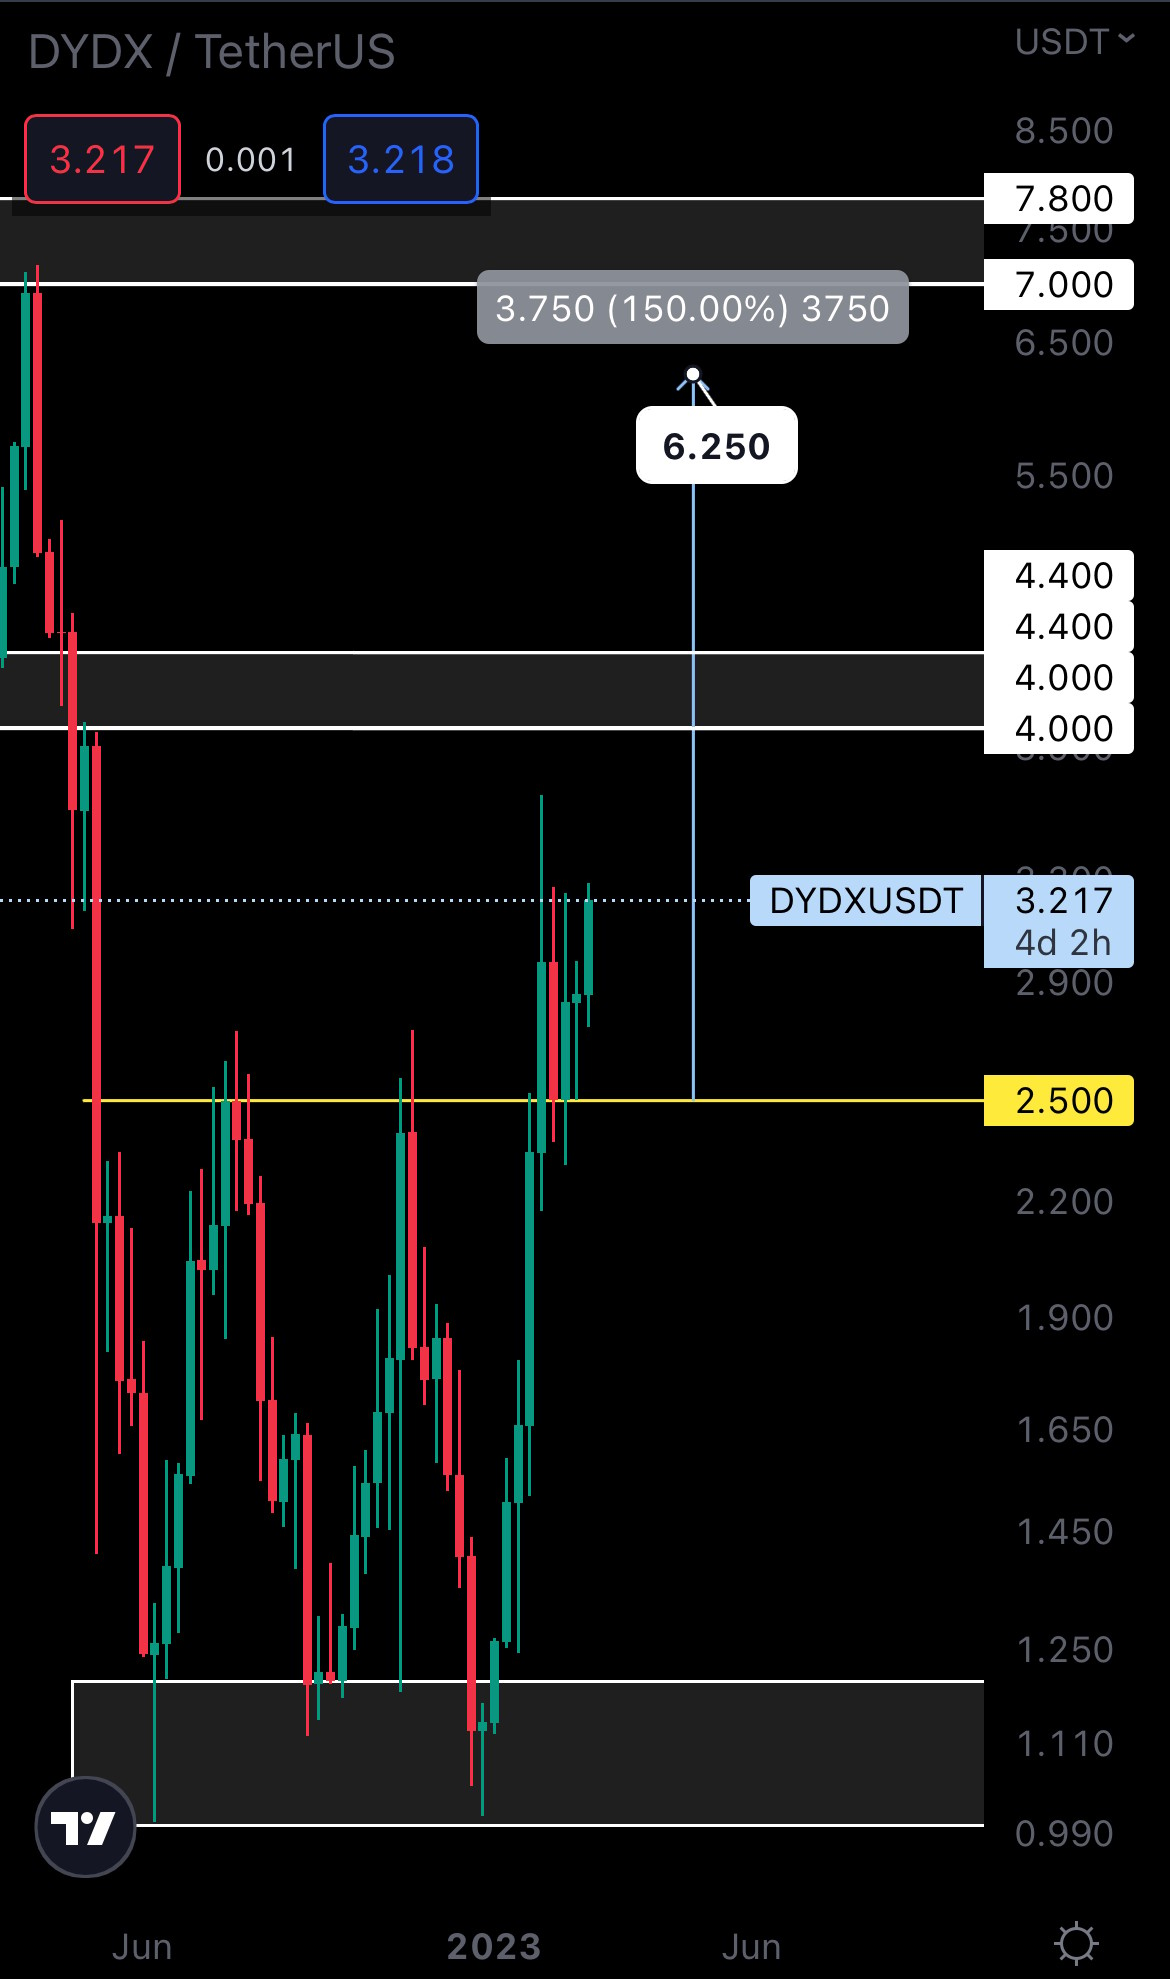
DYDX retested $2.50 as support last month and still closed the candle above it. From a technical standpoint, this leaves the door open for DYDX to test its $4 - $4.40 resistance area during March, and potentially reach $6.25, our target for the triple bottom (weekly timeframe) at some point in Q2. For the secondary target to be reached ($6.25), we’ll need to see DYDX closing a weekly candle above $4.40.
Cryptonary's Watchlist
DOT | Polkadot (Monthly)
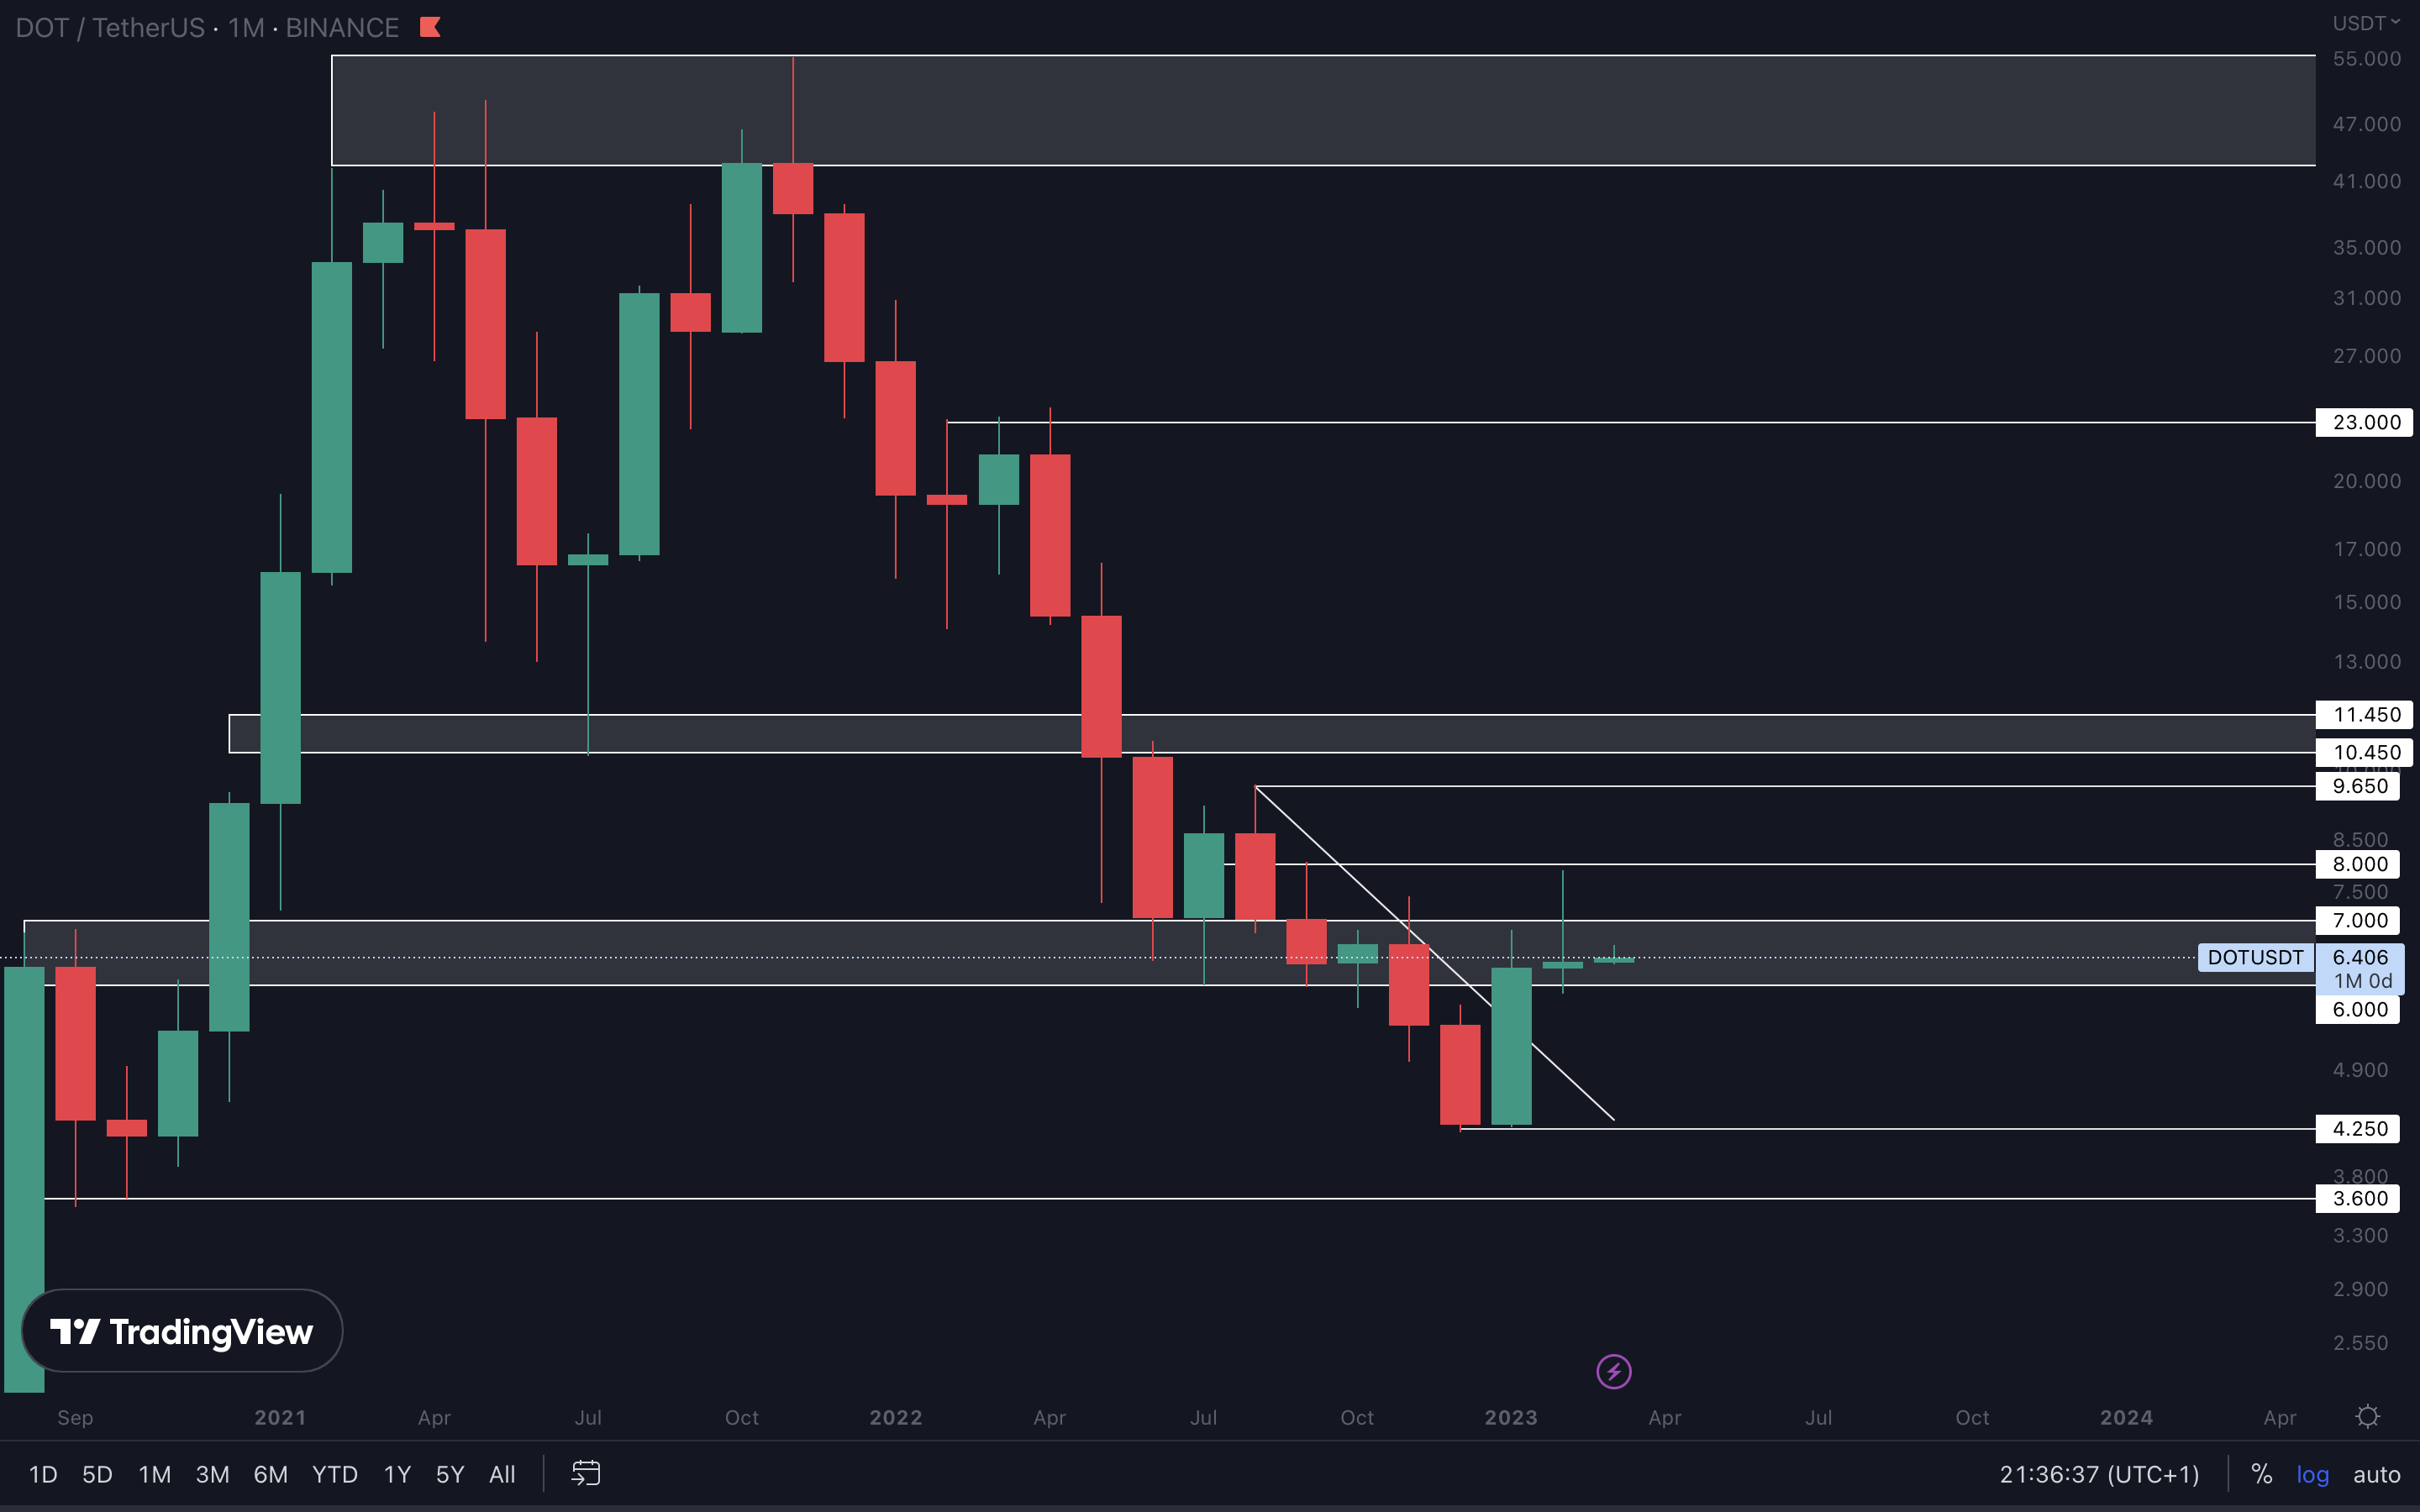
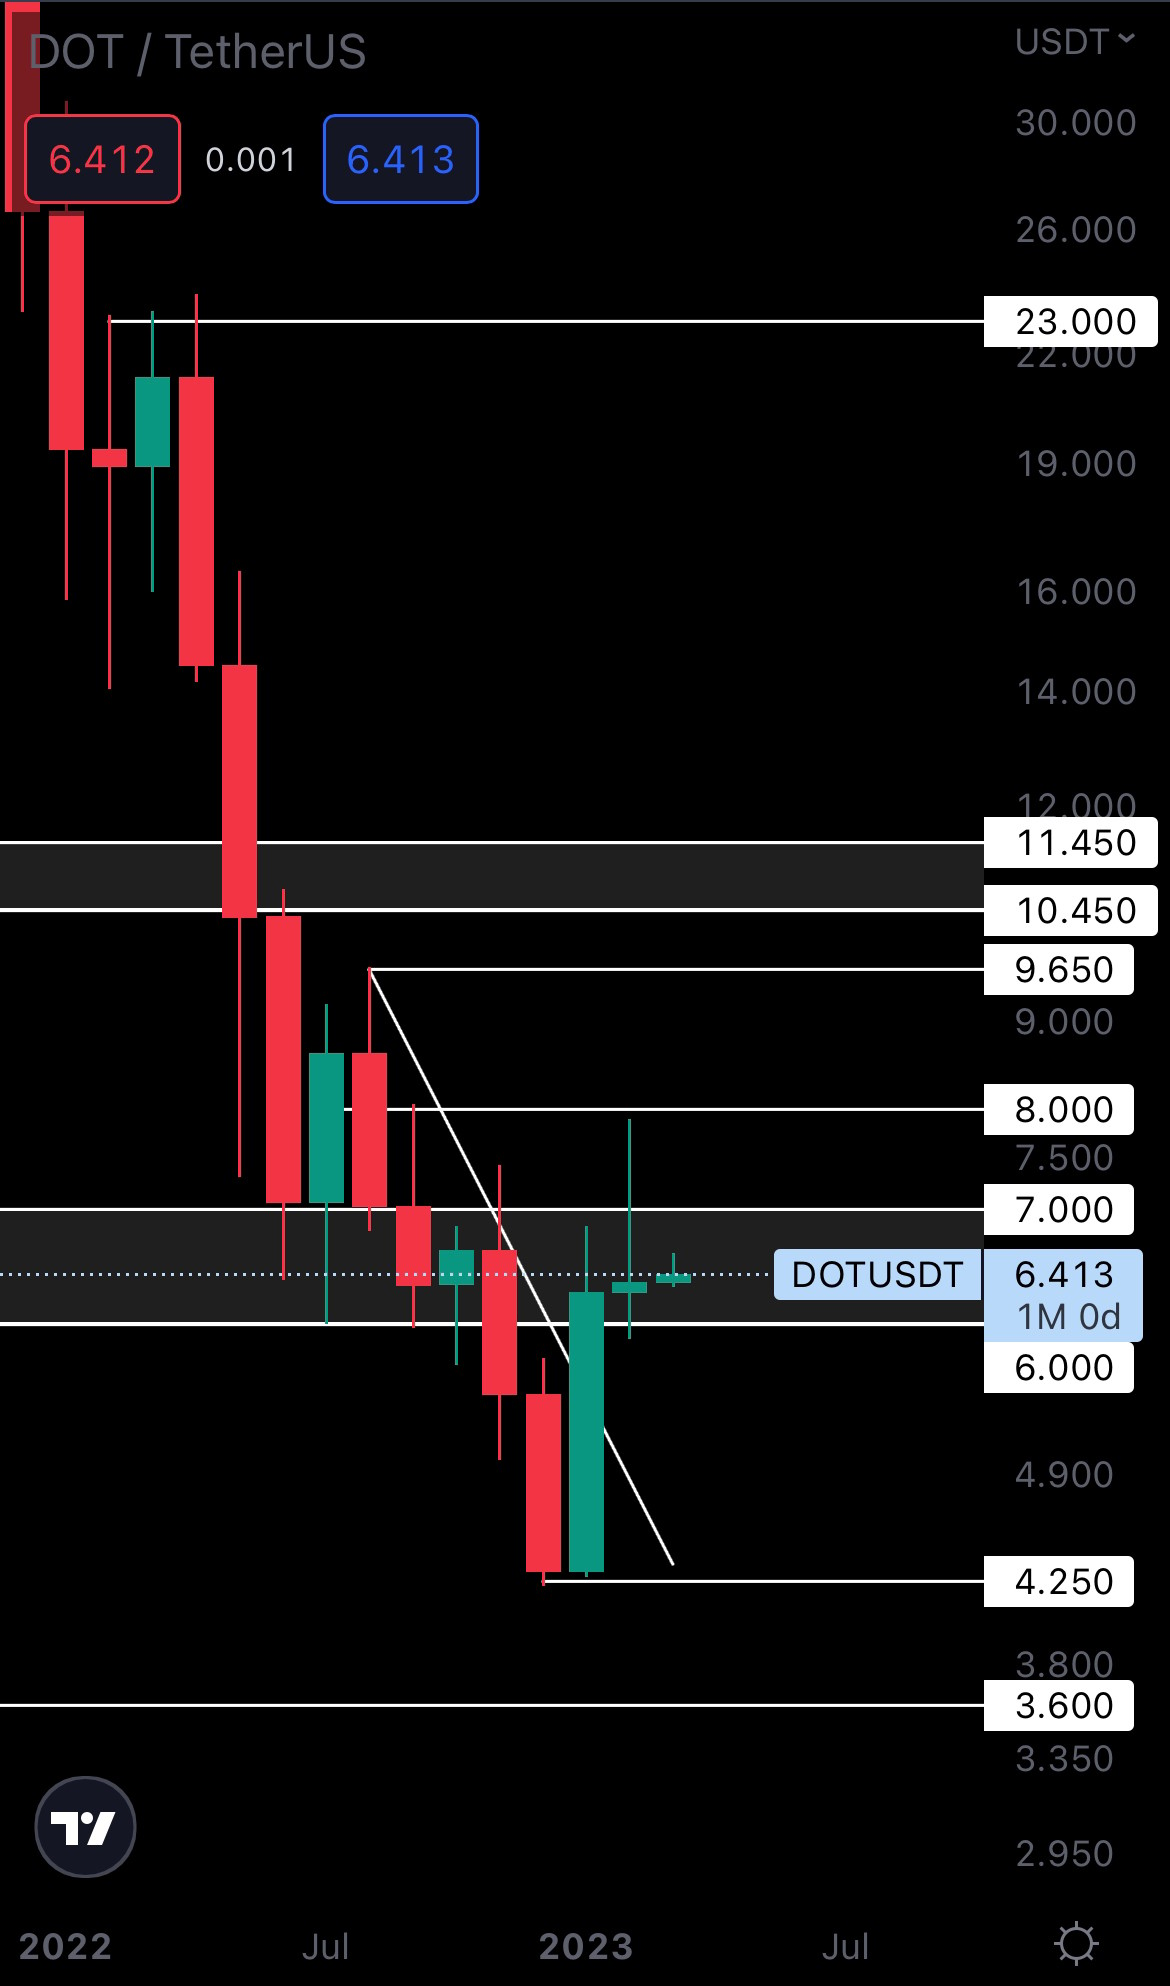
We have another Doji candle formed here, specifically a Gravestone Doji candle. This type of candlestick is bearish and usually signals a trend reversal is about to occur. However, this isn’t in line with our expectations for March and Q2. For DOT to invalidate this possibility, we’ll need it to hold $6 as support on the weekly timeframe. A weekly closure under this level, along with the Gravestone Doji from last month will confirm a downtrend for DOT. For that reason, we recommended looking at other assets in the coming weeks/months, as this isn’t too big of an opportunity at this point in time.
SYN | Synapse (Weekly)
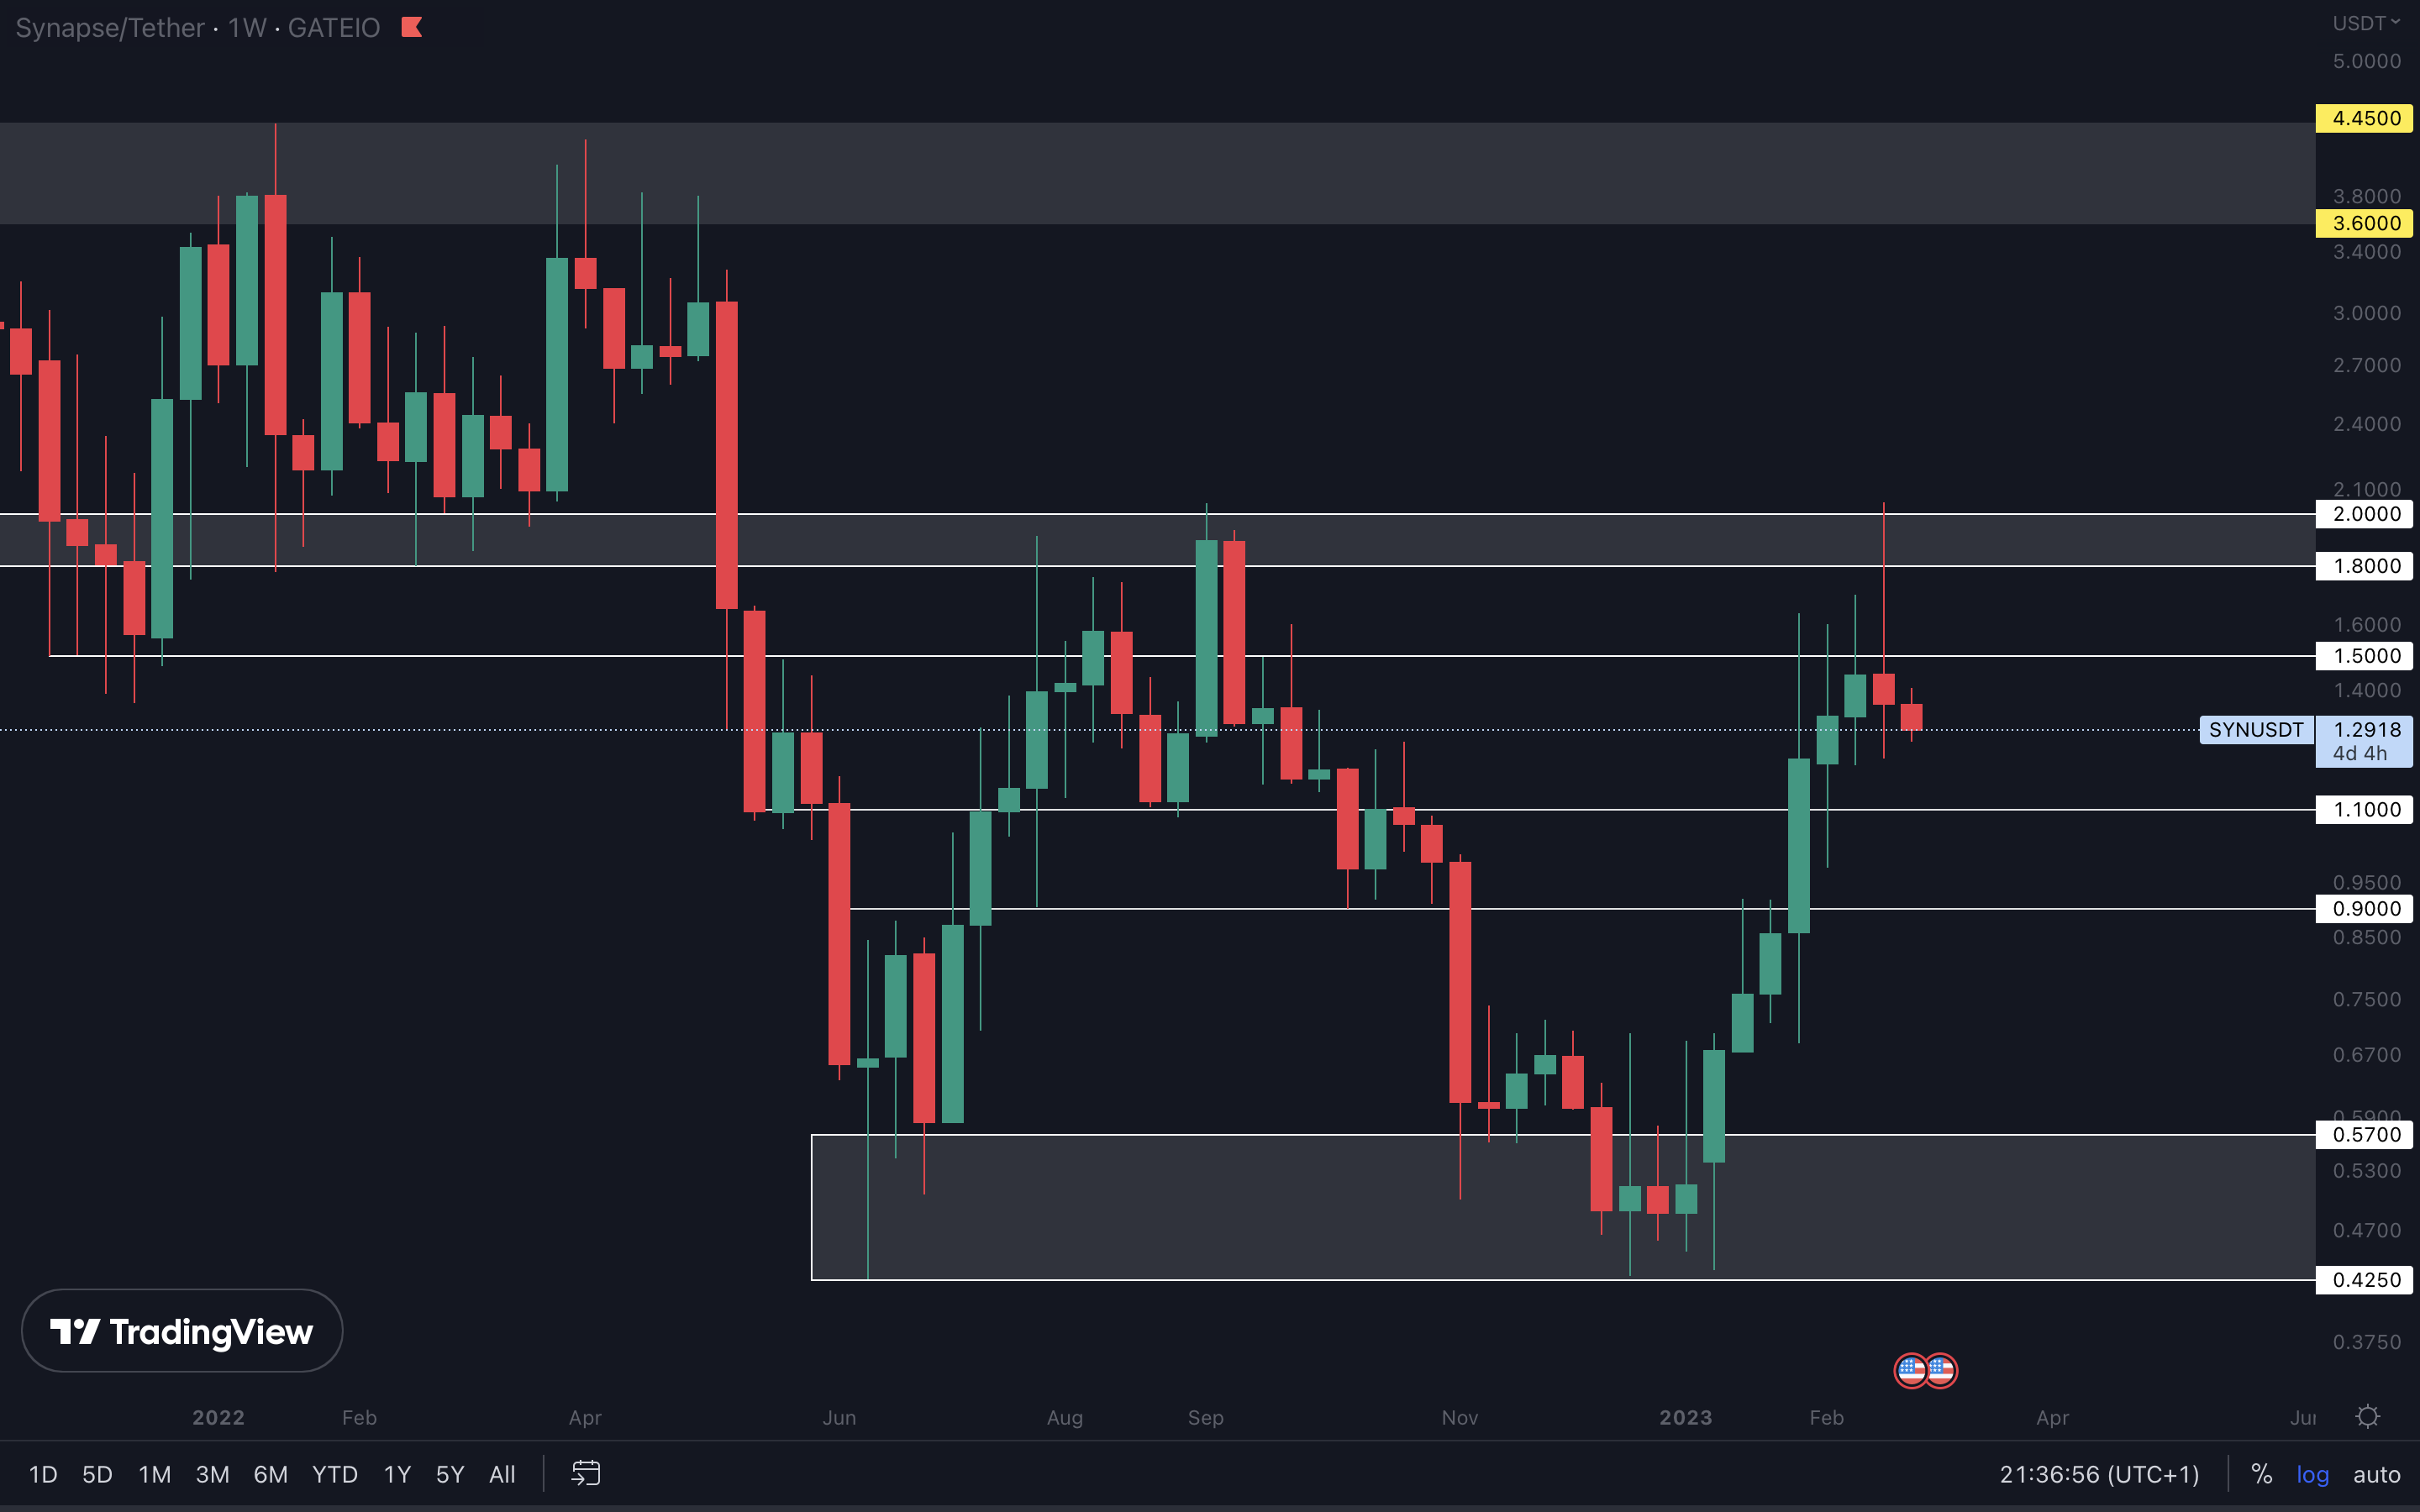
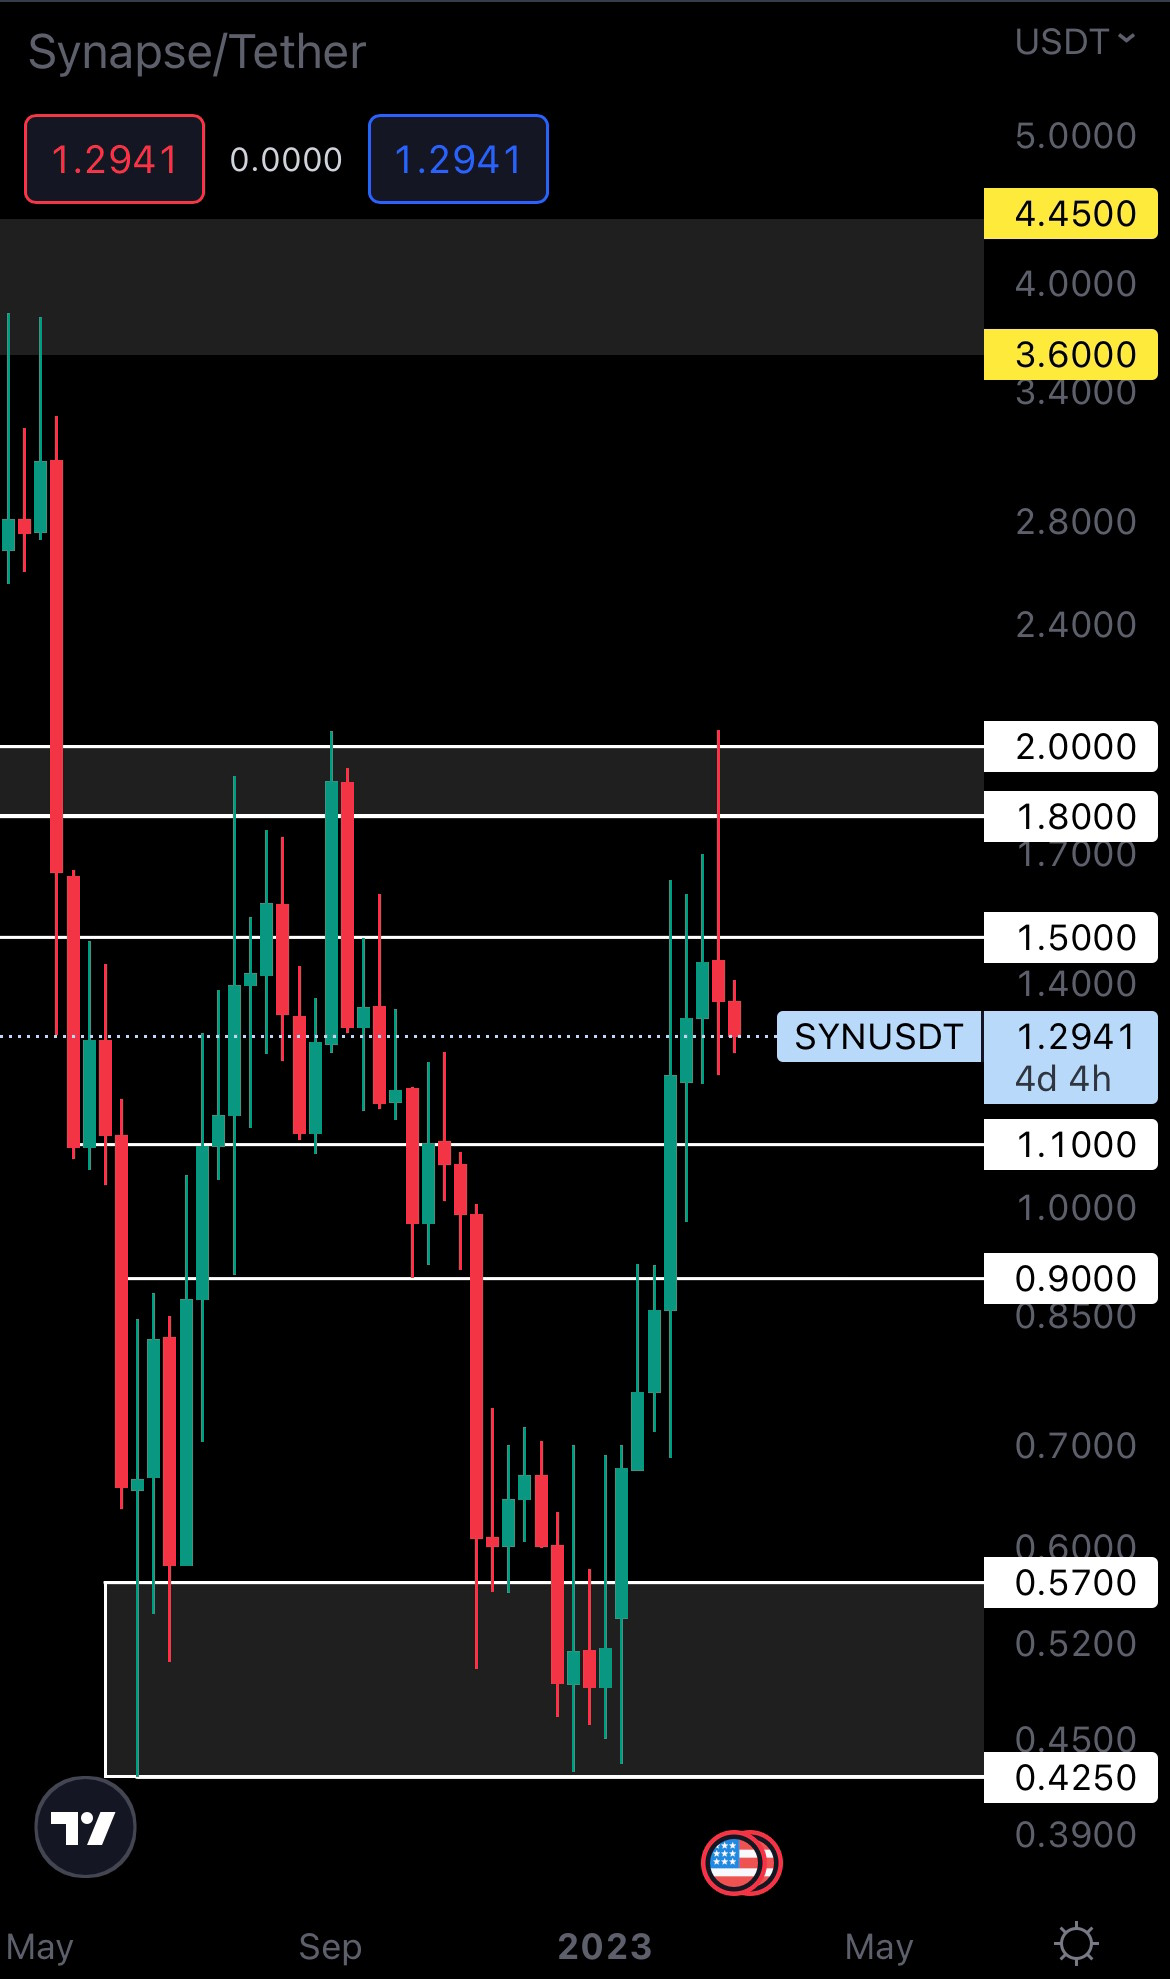
SYN has been rejected from resistance ($1.50) last week and looks like it will be going for a retest of $1.10 in the coming weeks. There is a major setup in play on SYN’s weekly timeframe - a double bottom with the neckline at $2. As we head into March and Q2 shortly, SYN closing a weekly candle above $2 will validate the double bottom and put $3.60 - $4.45 as our next target for this asset. That translates to an 80% - 120% increase.
OP | Optimism (Weekly)
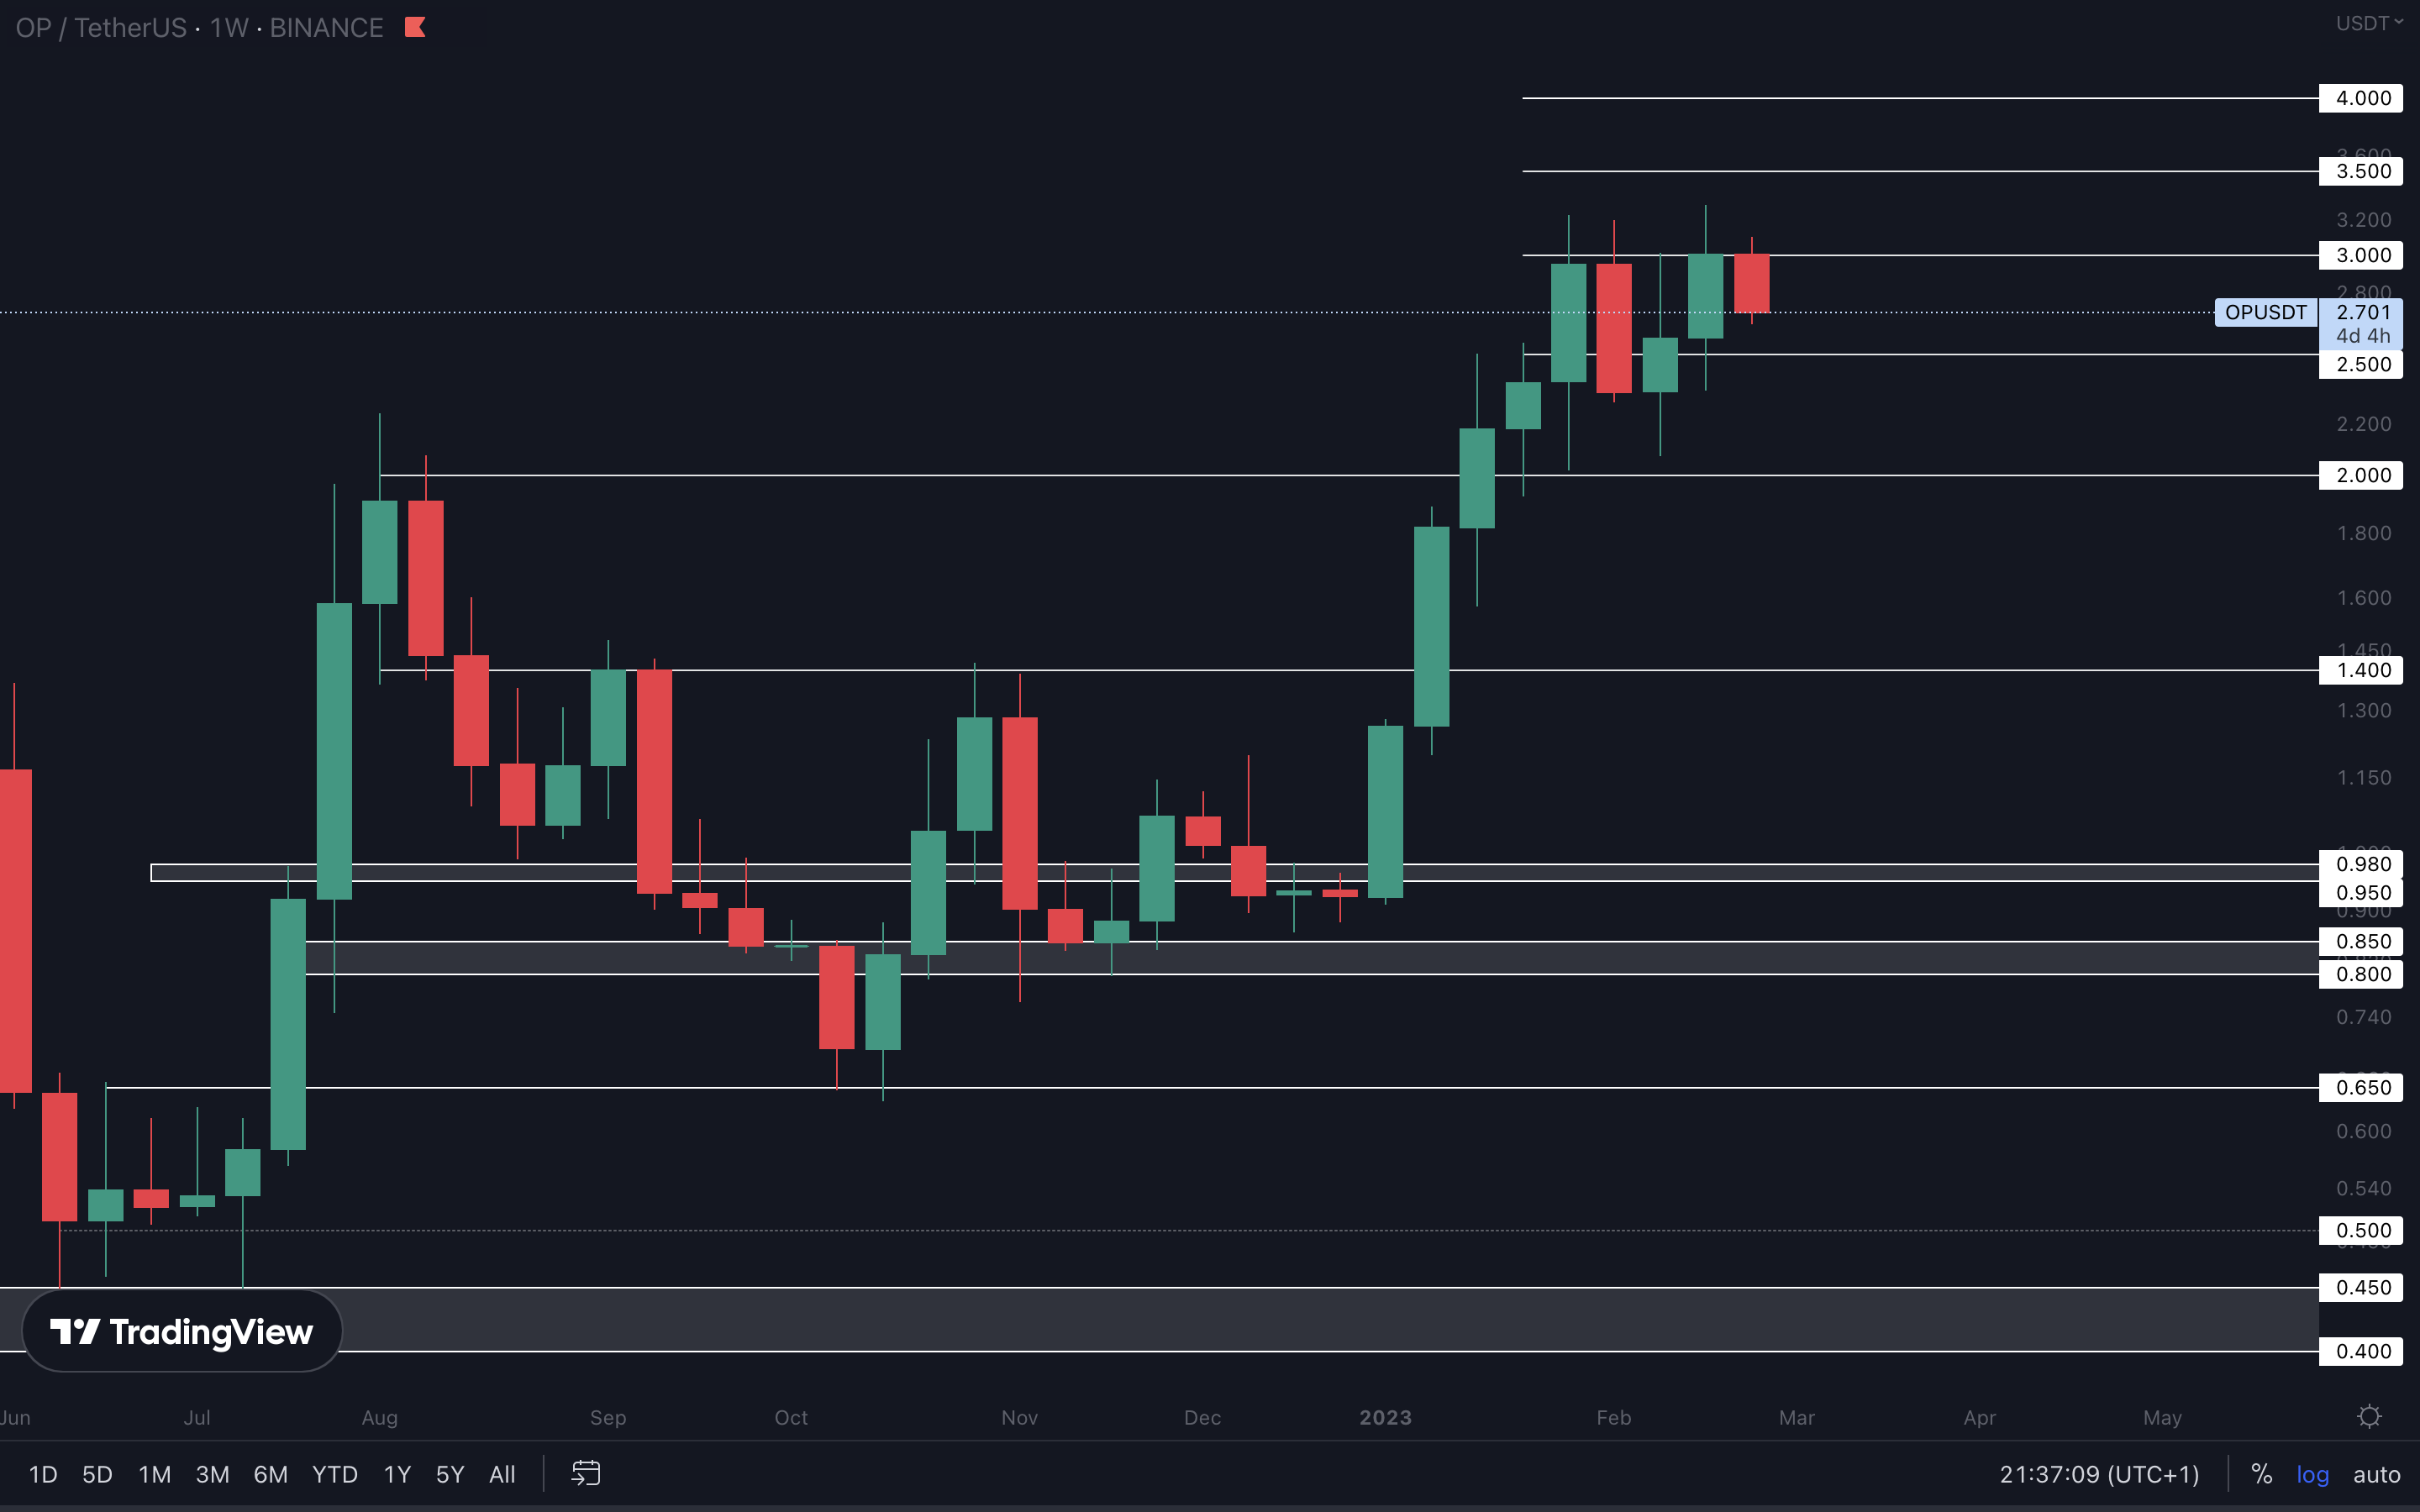
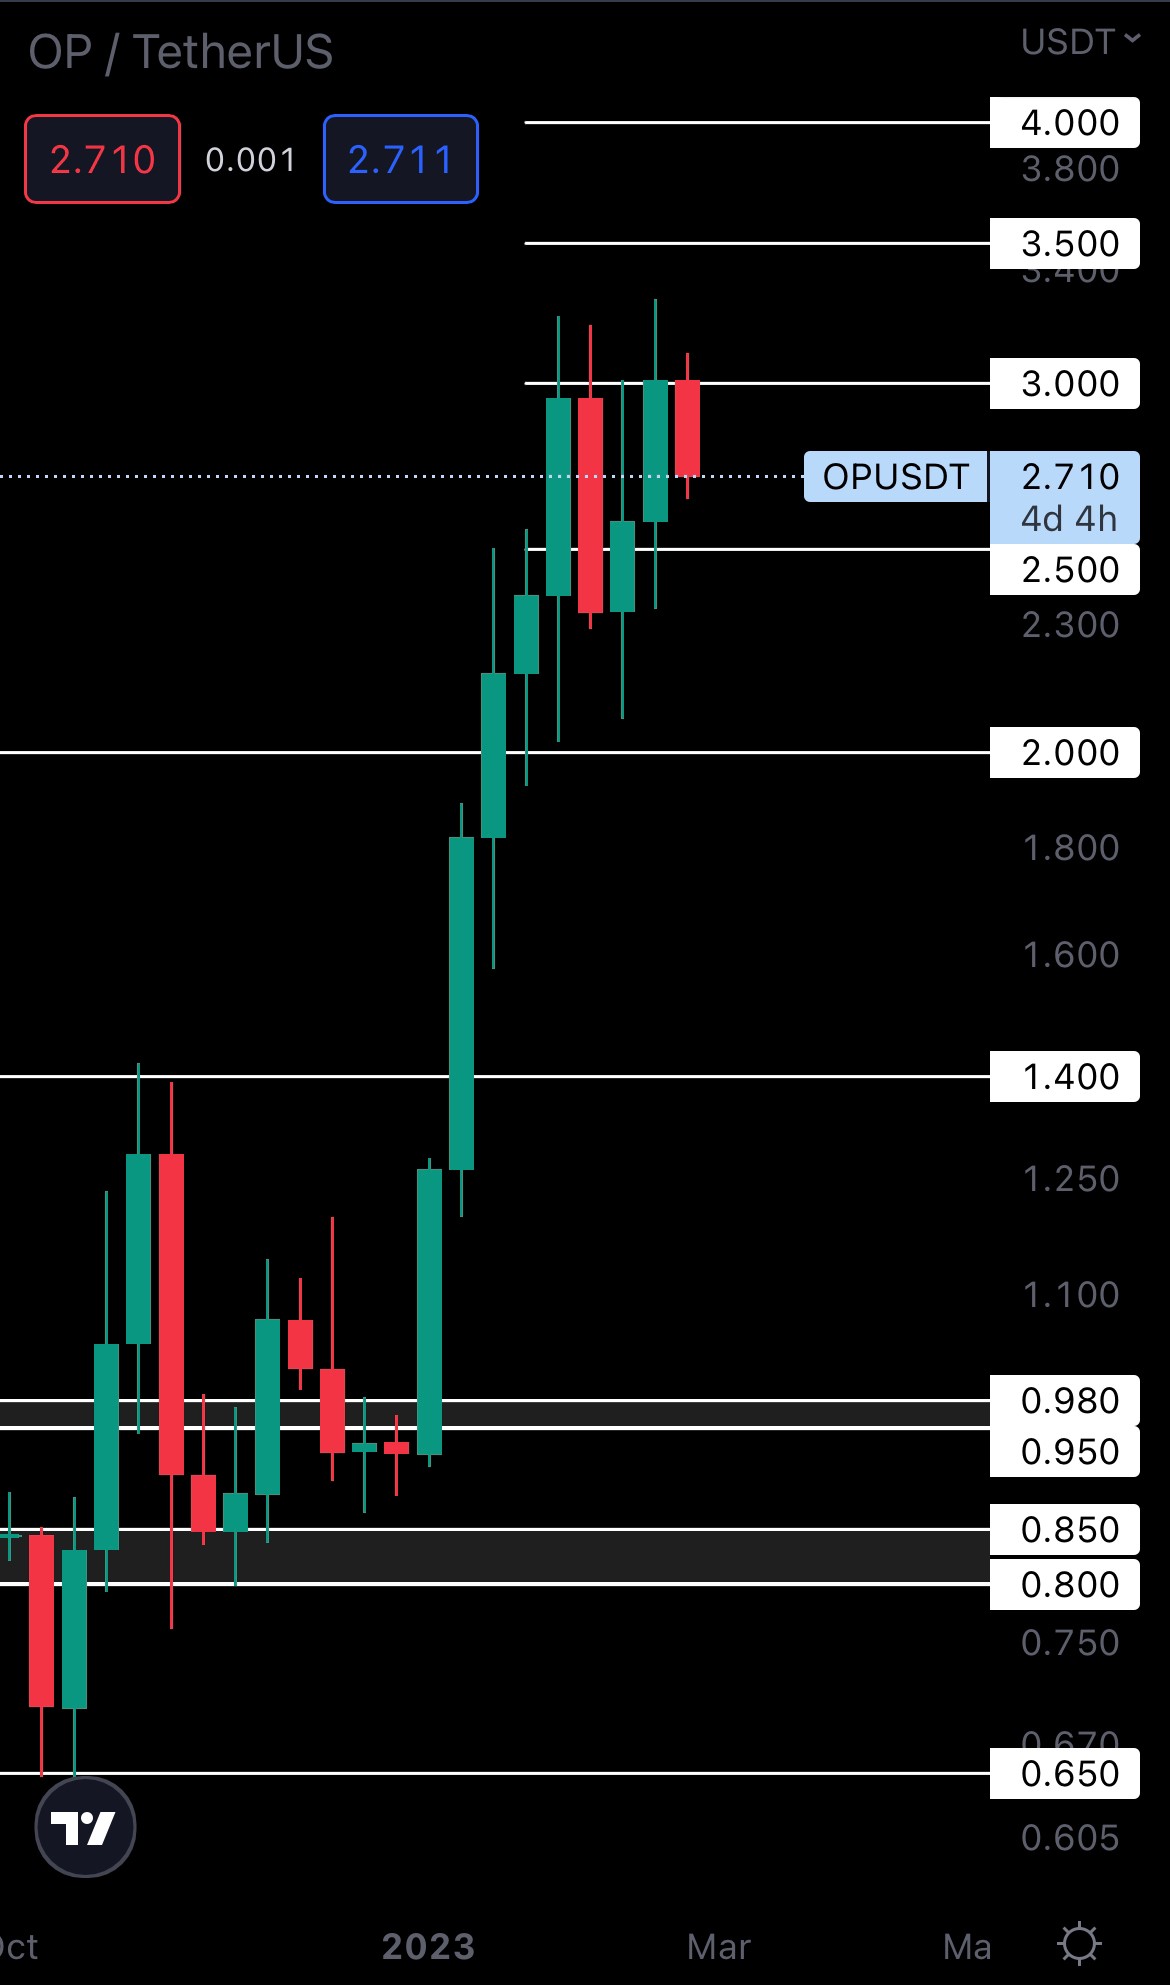
OP has been doing nothing but outperforming in the last two months, and there’s no signal that this may stop anytime soon. The asset’s weekly market structure is bullish, and it will likely reach new psychological levels such as $3.50, $4, $4.50, and so on in the coming months. For higher prices to follow, we’ll need to see OP closing a weekly candle above $3.
LDO | Lido DAO (Monthly)
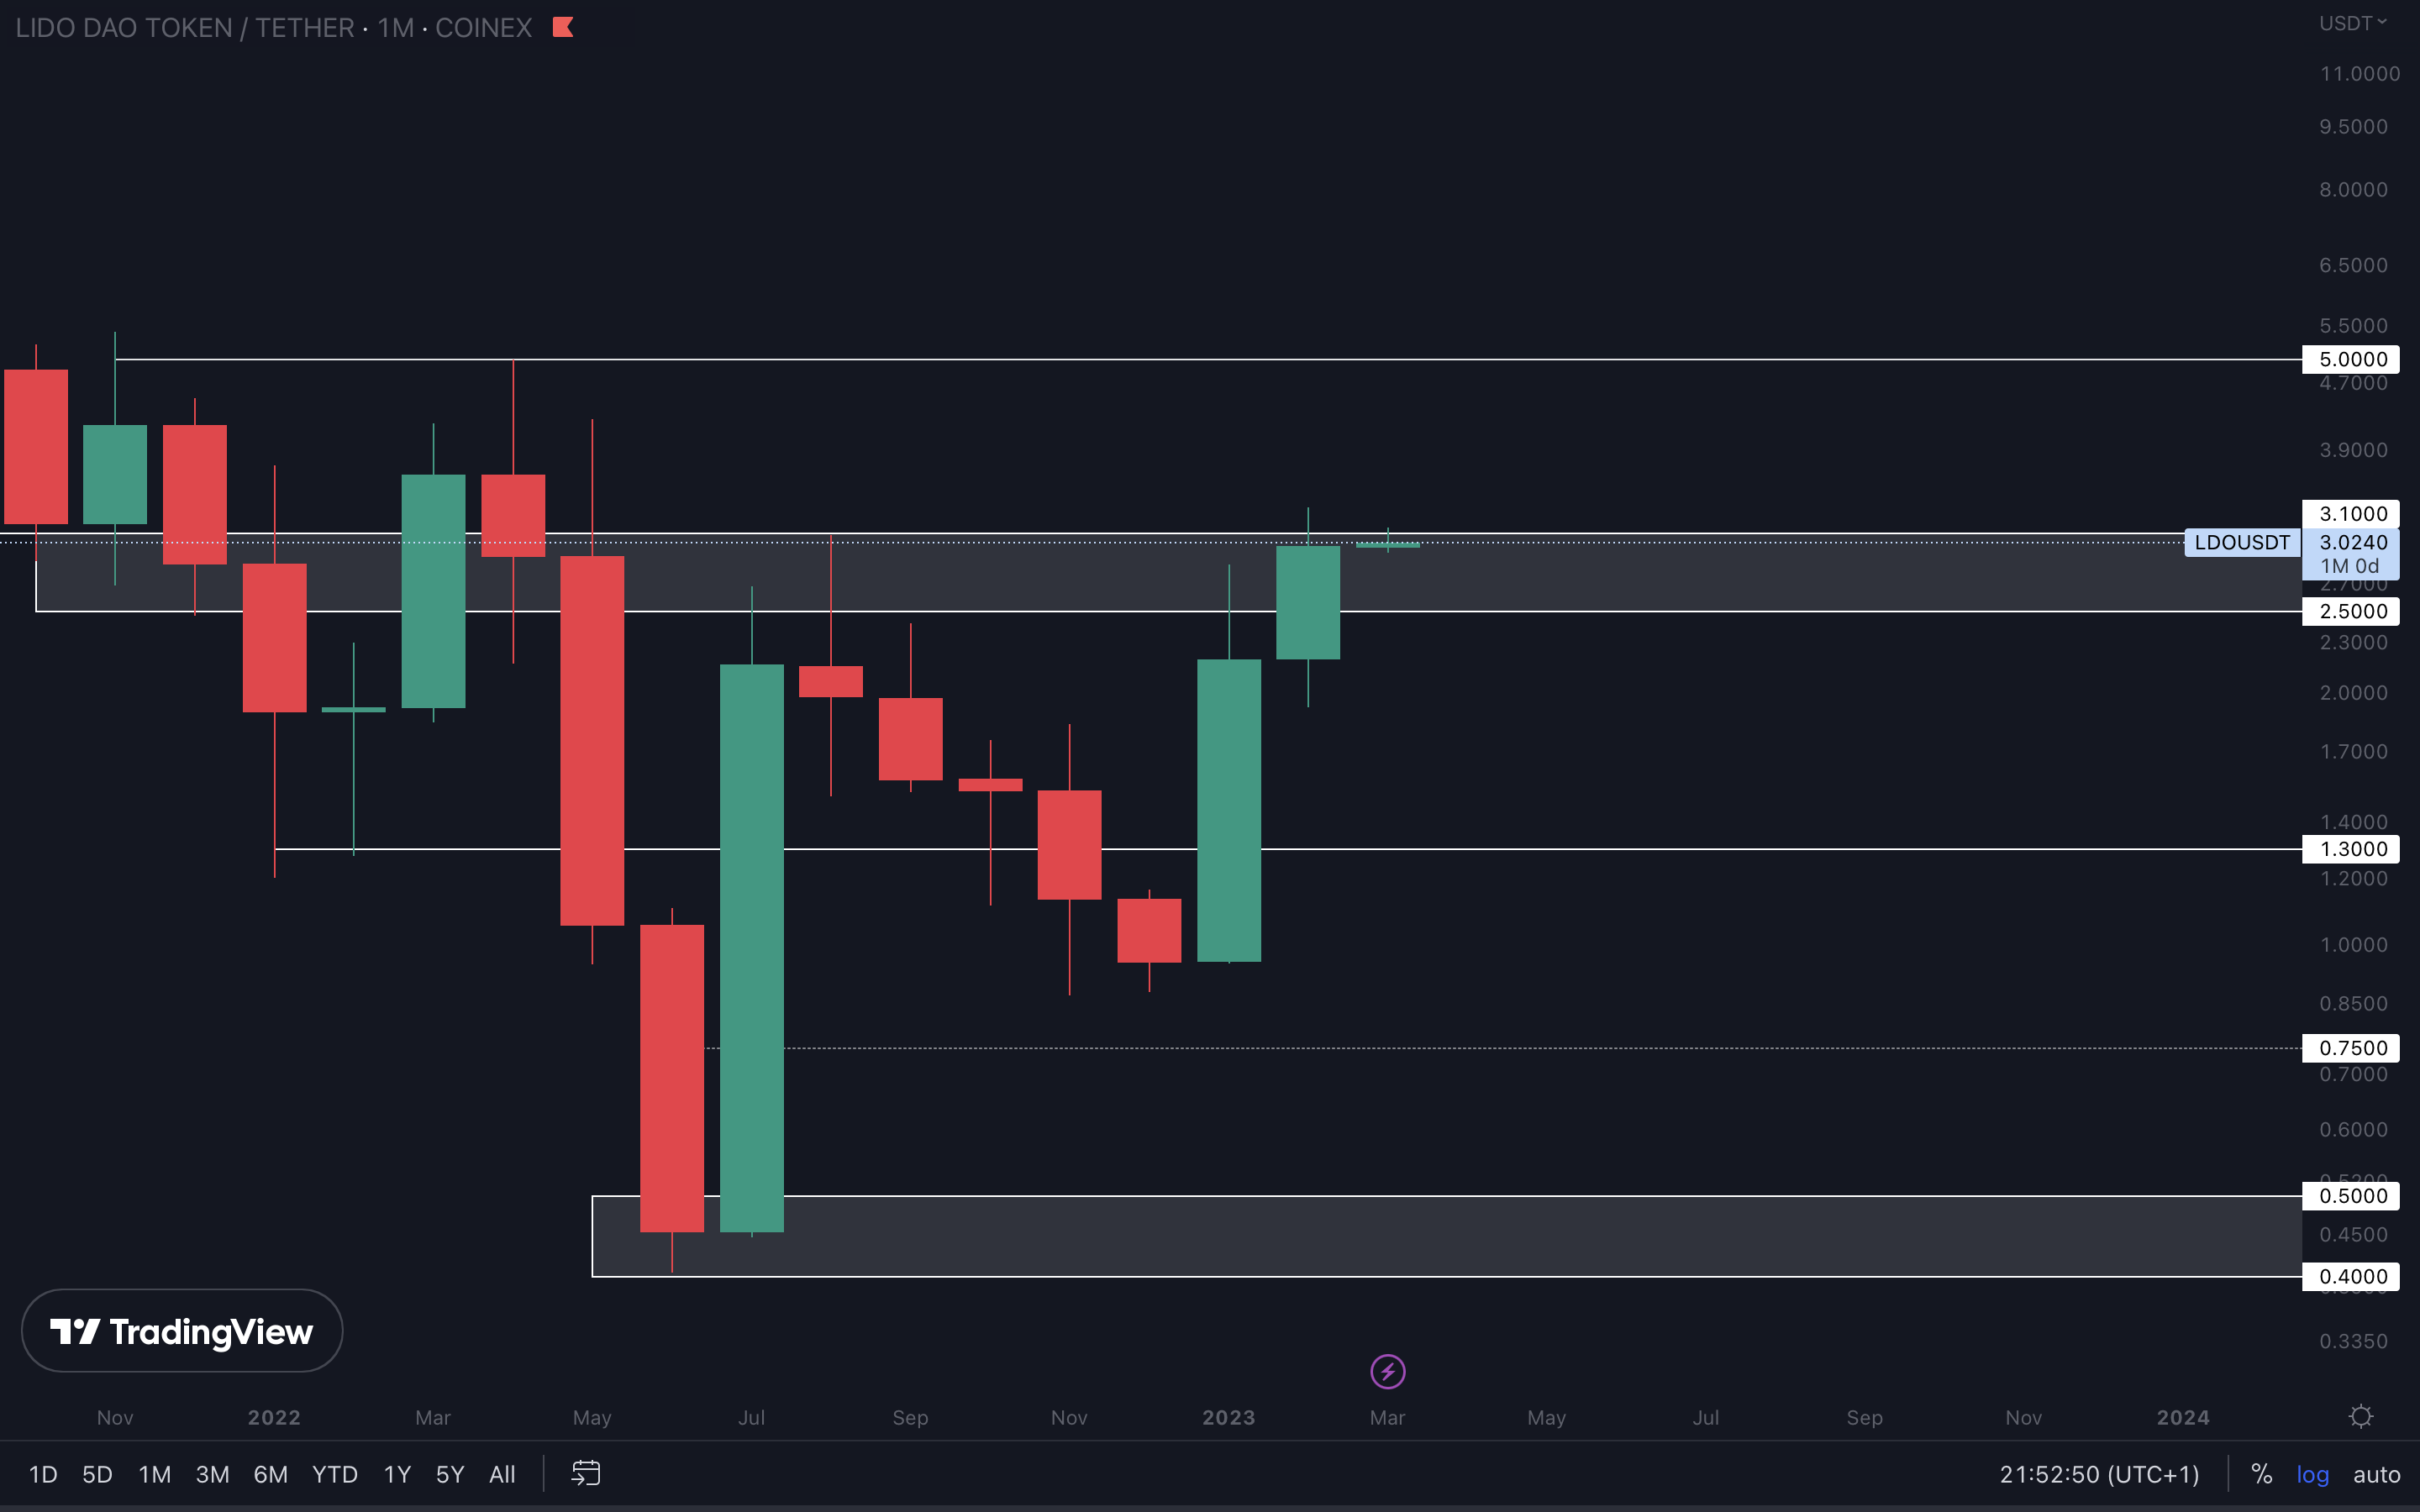
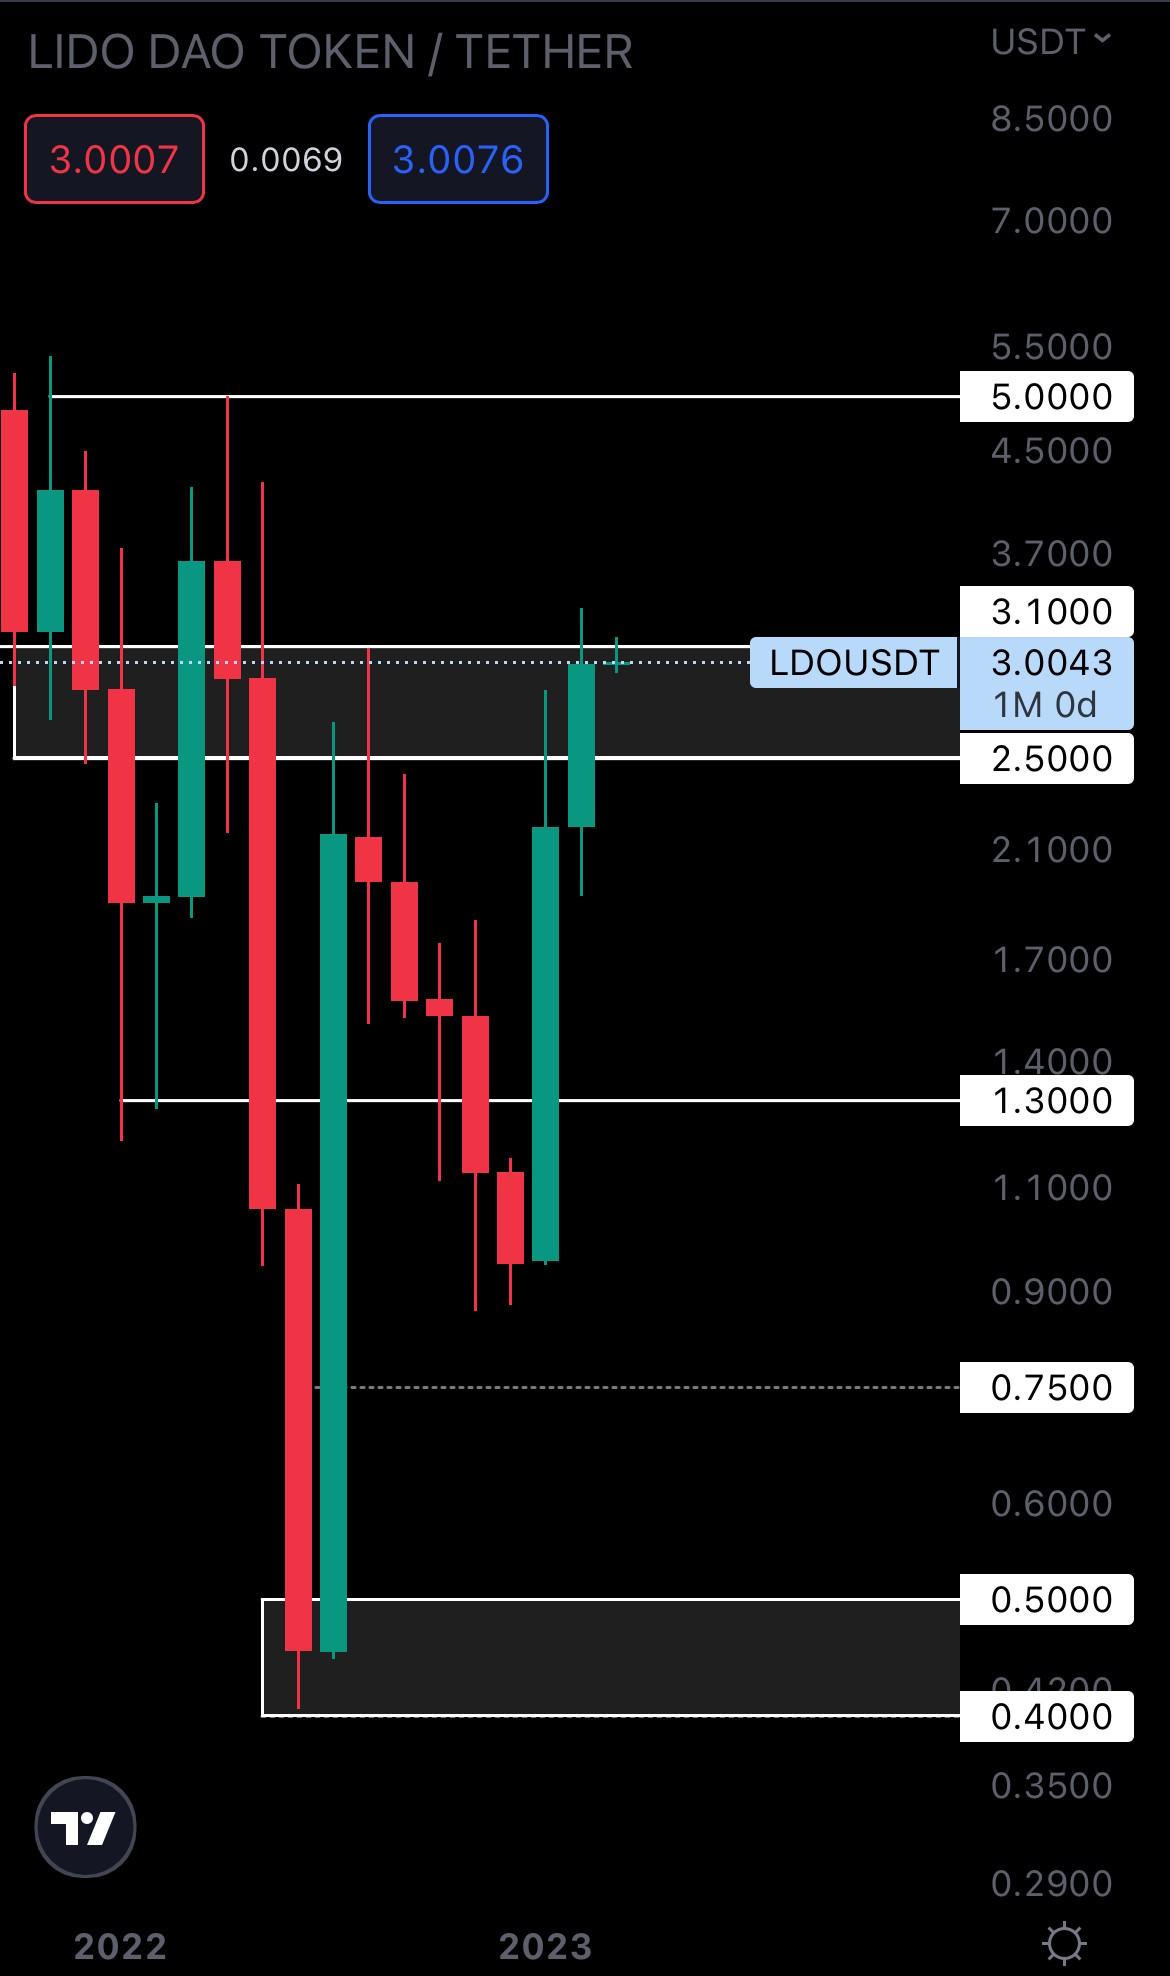 LDO’s monthly market structure is now bullish. The asset broke above $3.10, which is a level that hasn’t been broken since May 2022 and formed a higher high on the monthly timeframe.
There are no bearish signals at the moment, but for upside to continue LDO will have to close a weekly candle above $3.10. This will open the door for $5 which will likely be tested in the coming weeks/months, depending on how the market performs.
HEGIC | Hegic (Monthly)
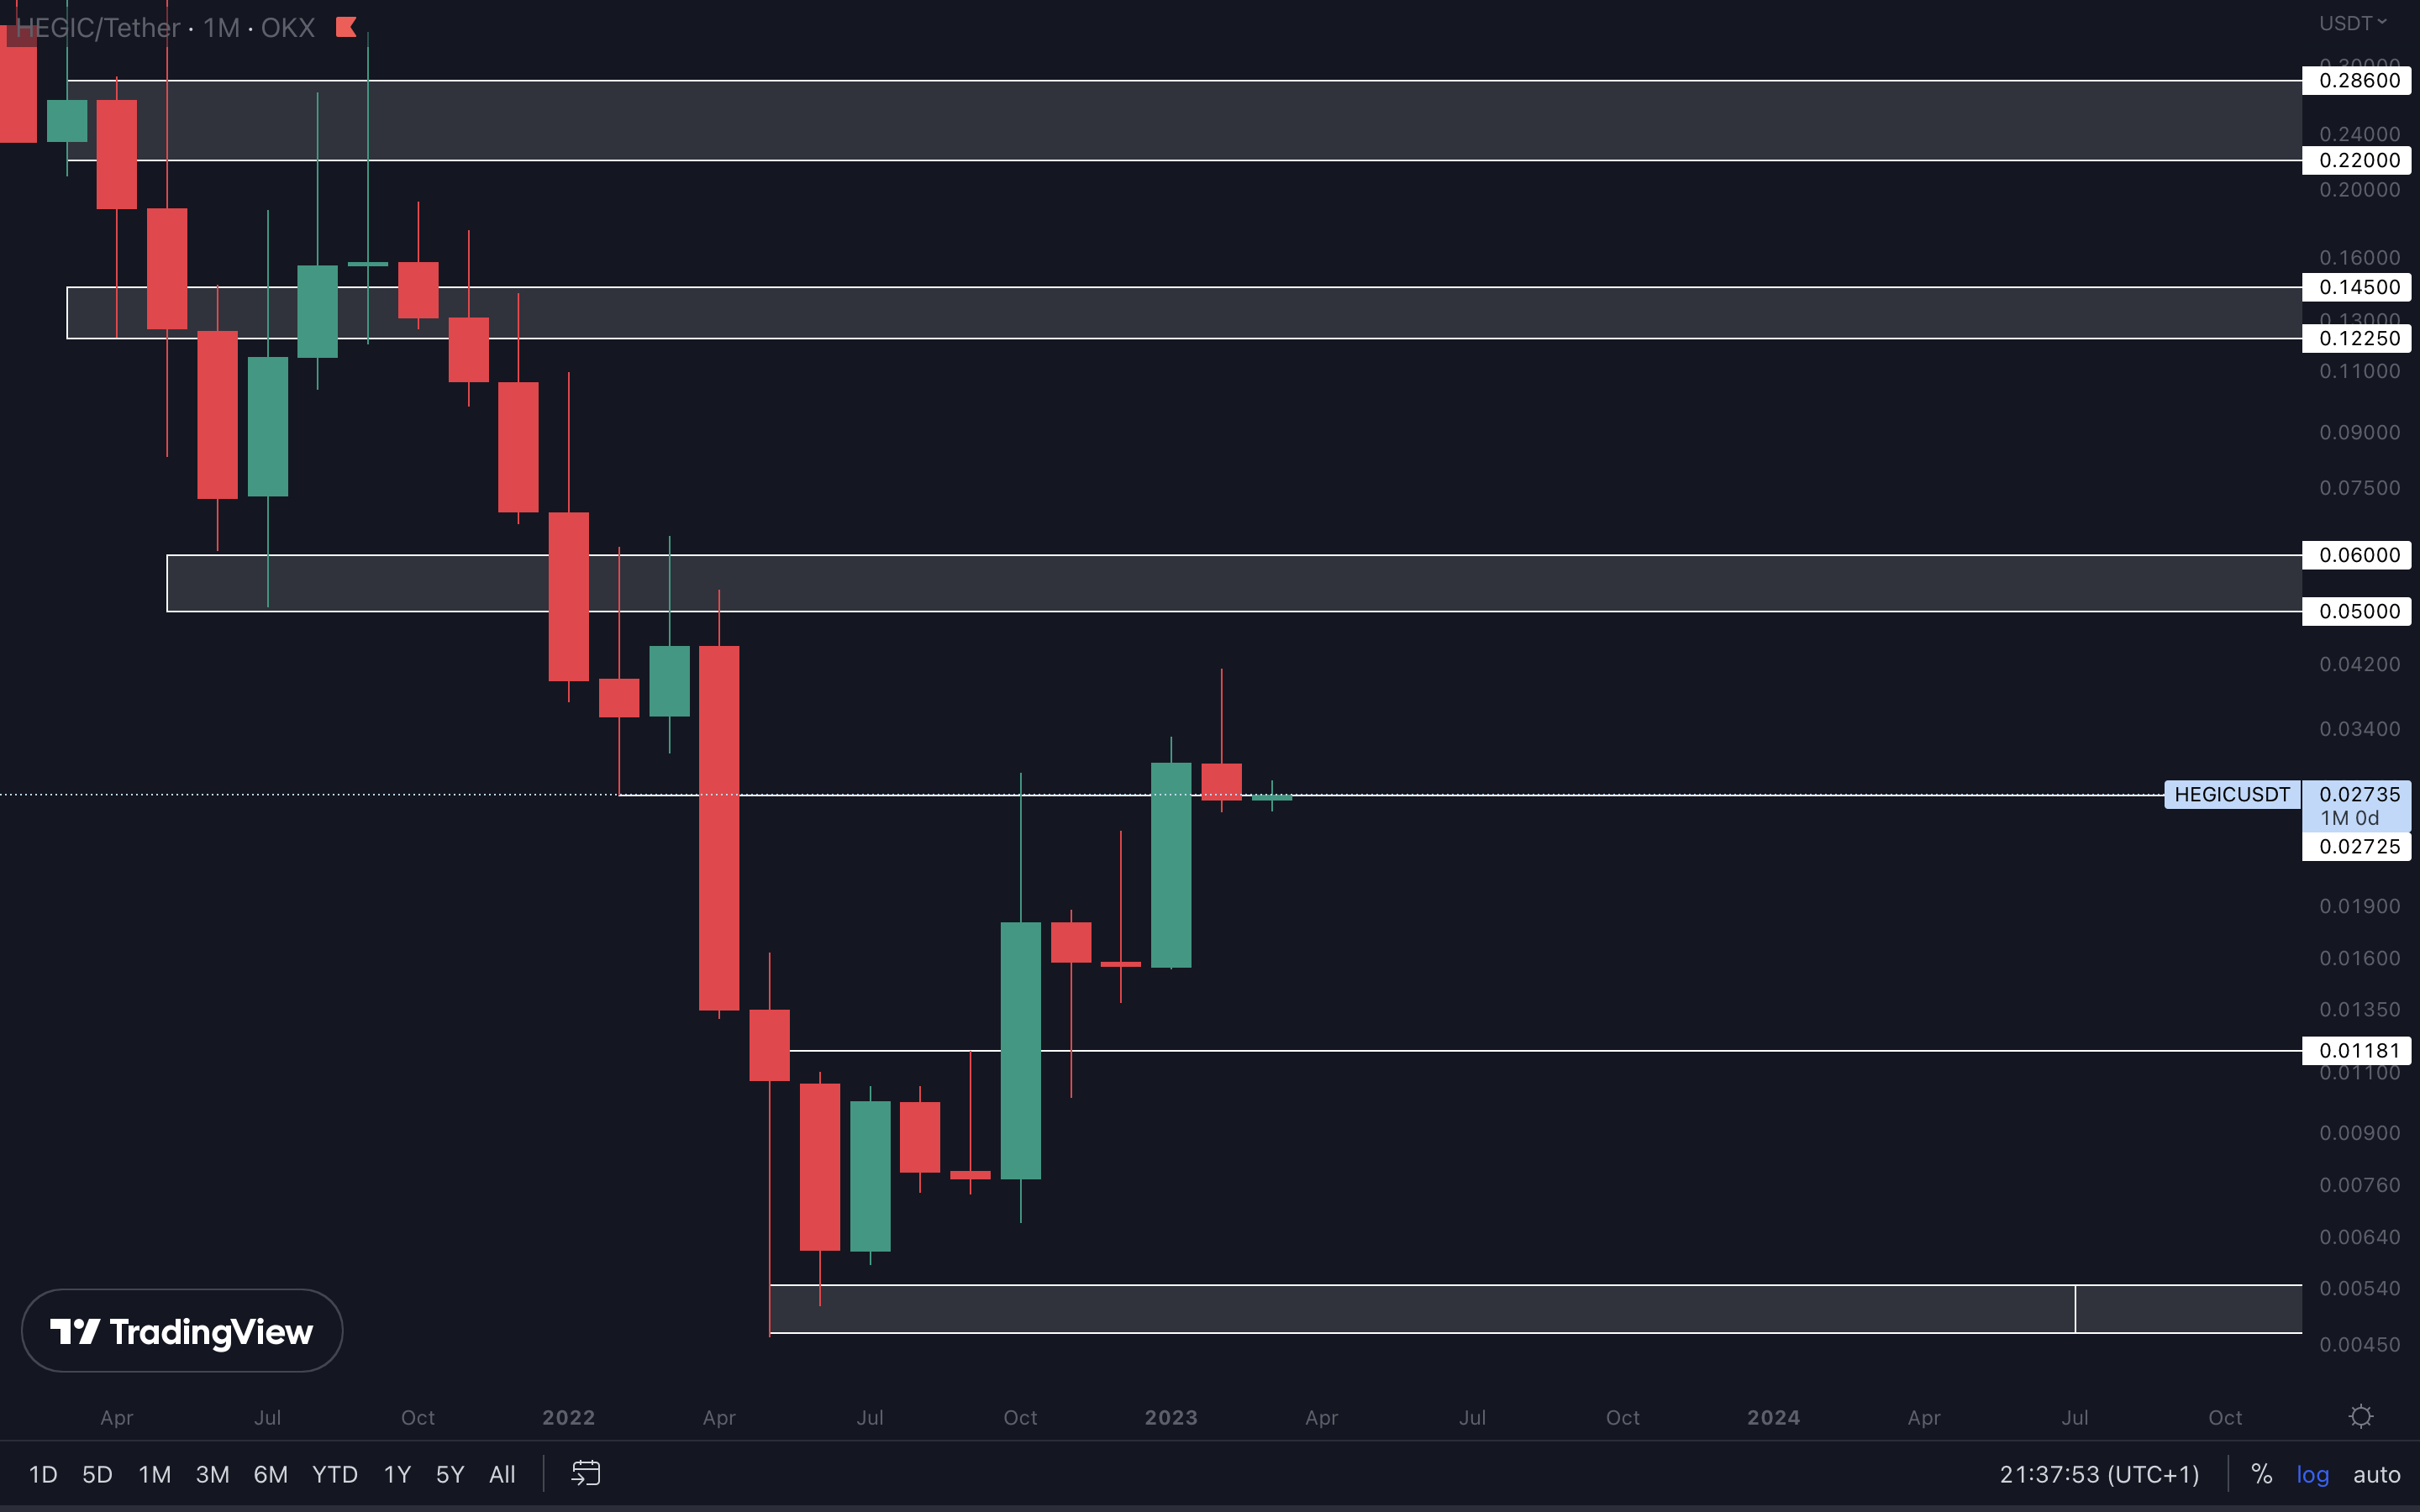
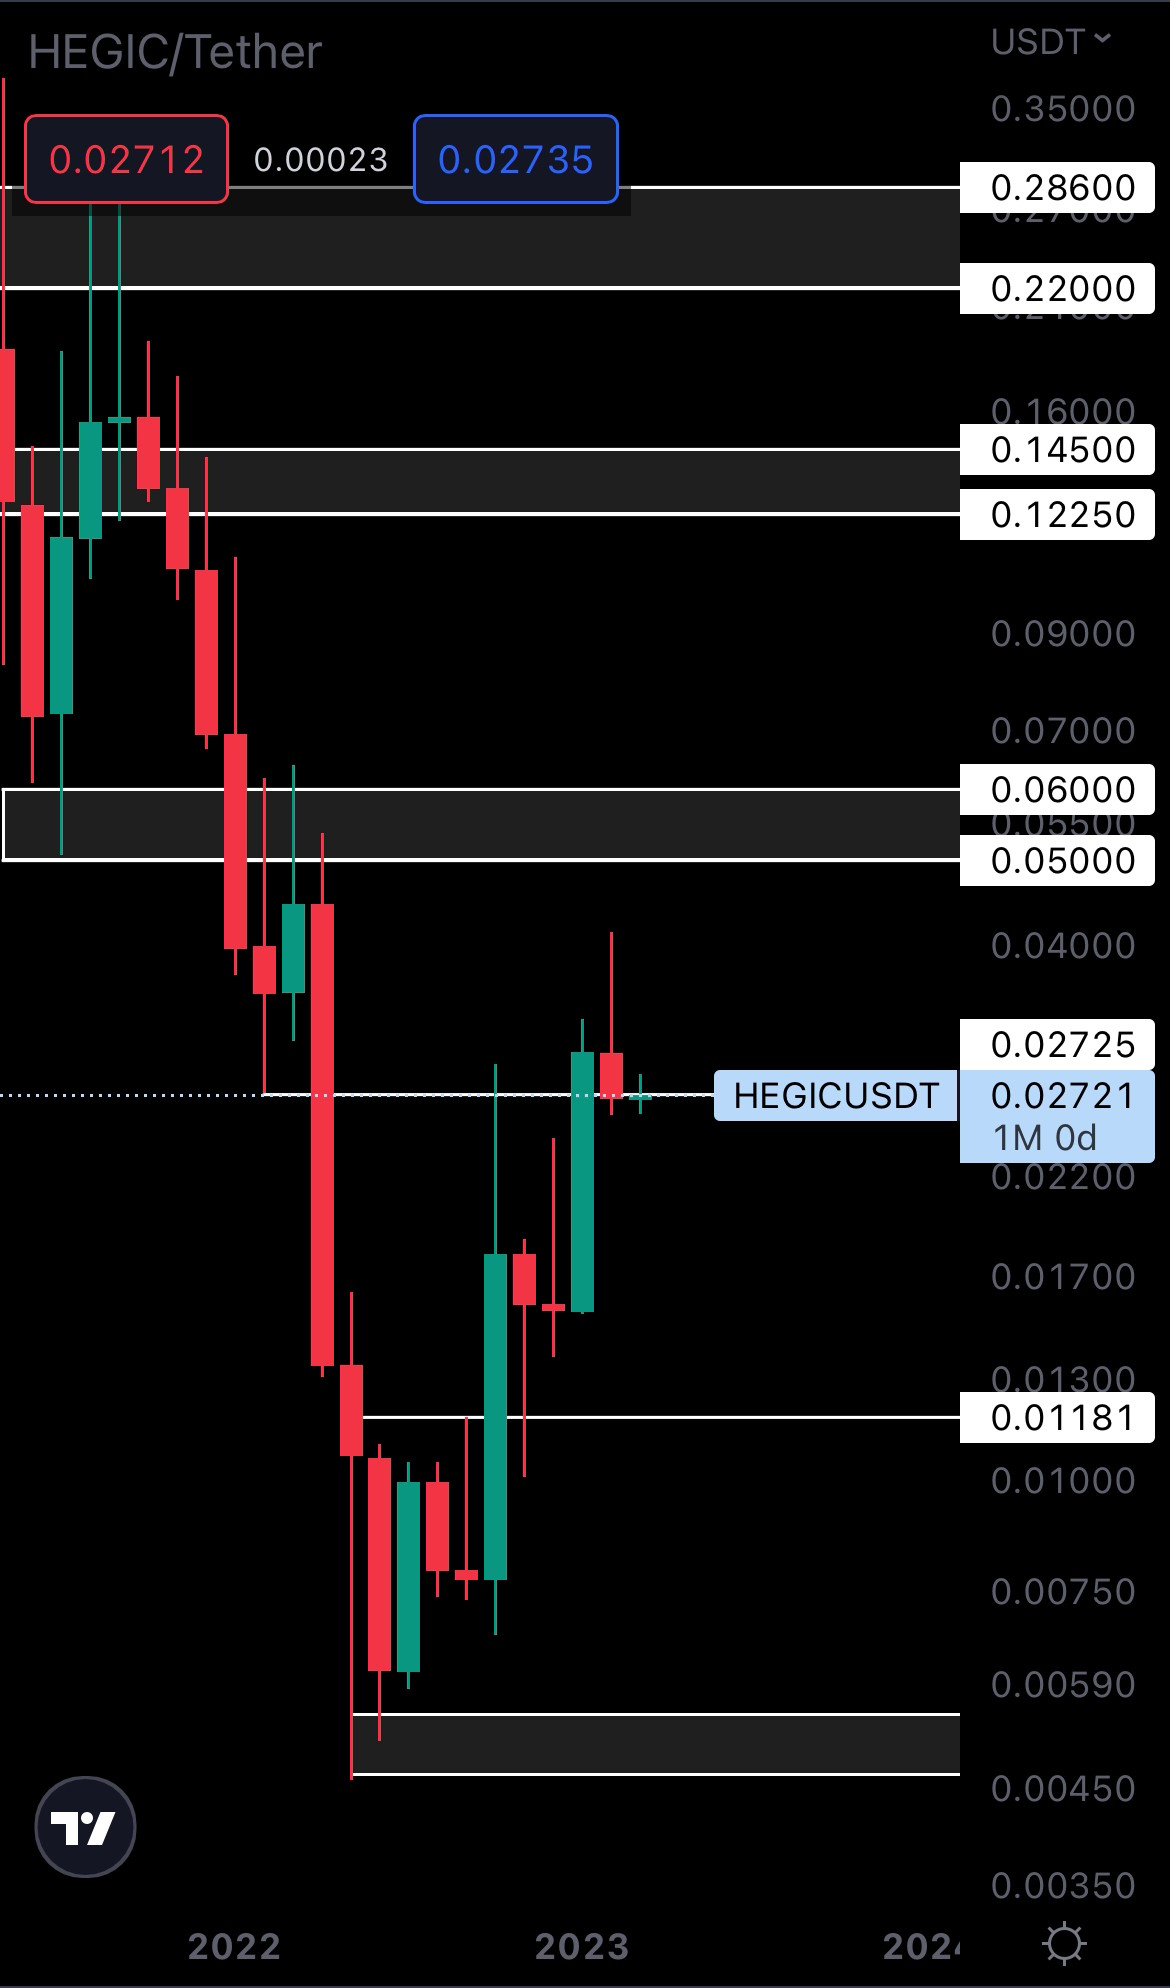
HEGIC closed February right under support, which might leave some room for second-guessing on whether it will go up from here or not. The only thing that matters is that HEGIC’s weekly market structure is bullish, and the asset is in a huge uptrend already. At this time, we have no signs of the larger trend changing, and only a break in market structures will provide that.
ASTR | Astar Network (Weekly)
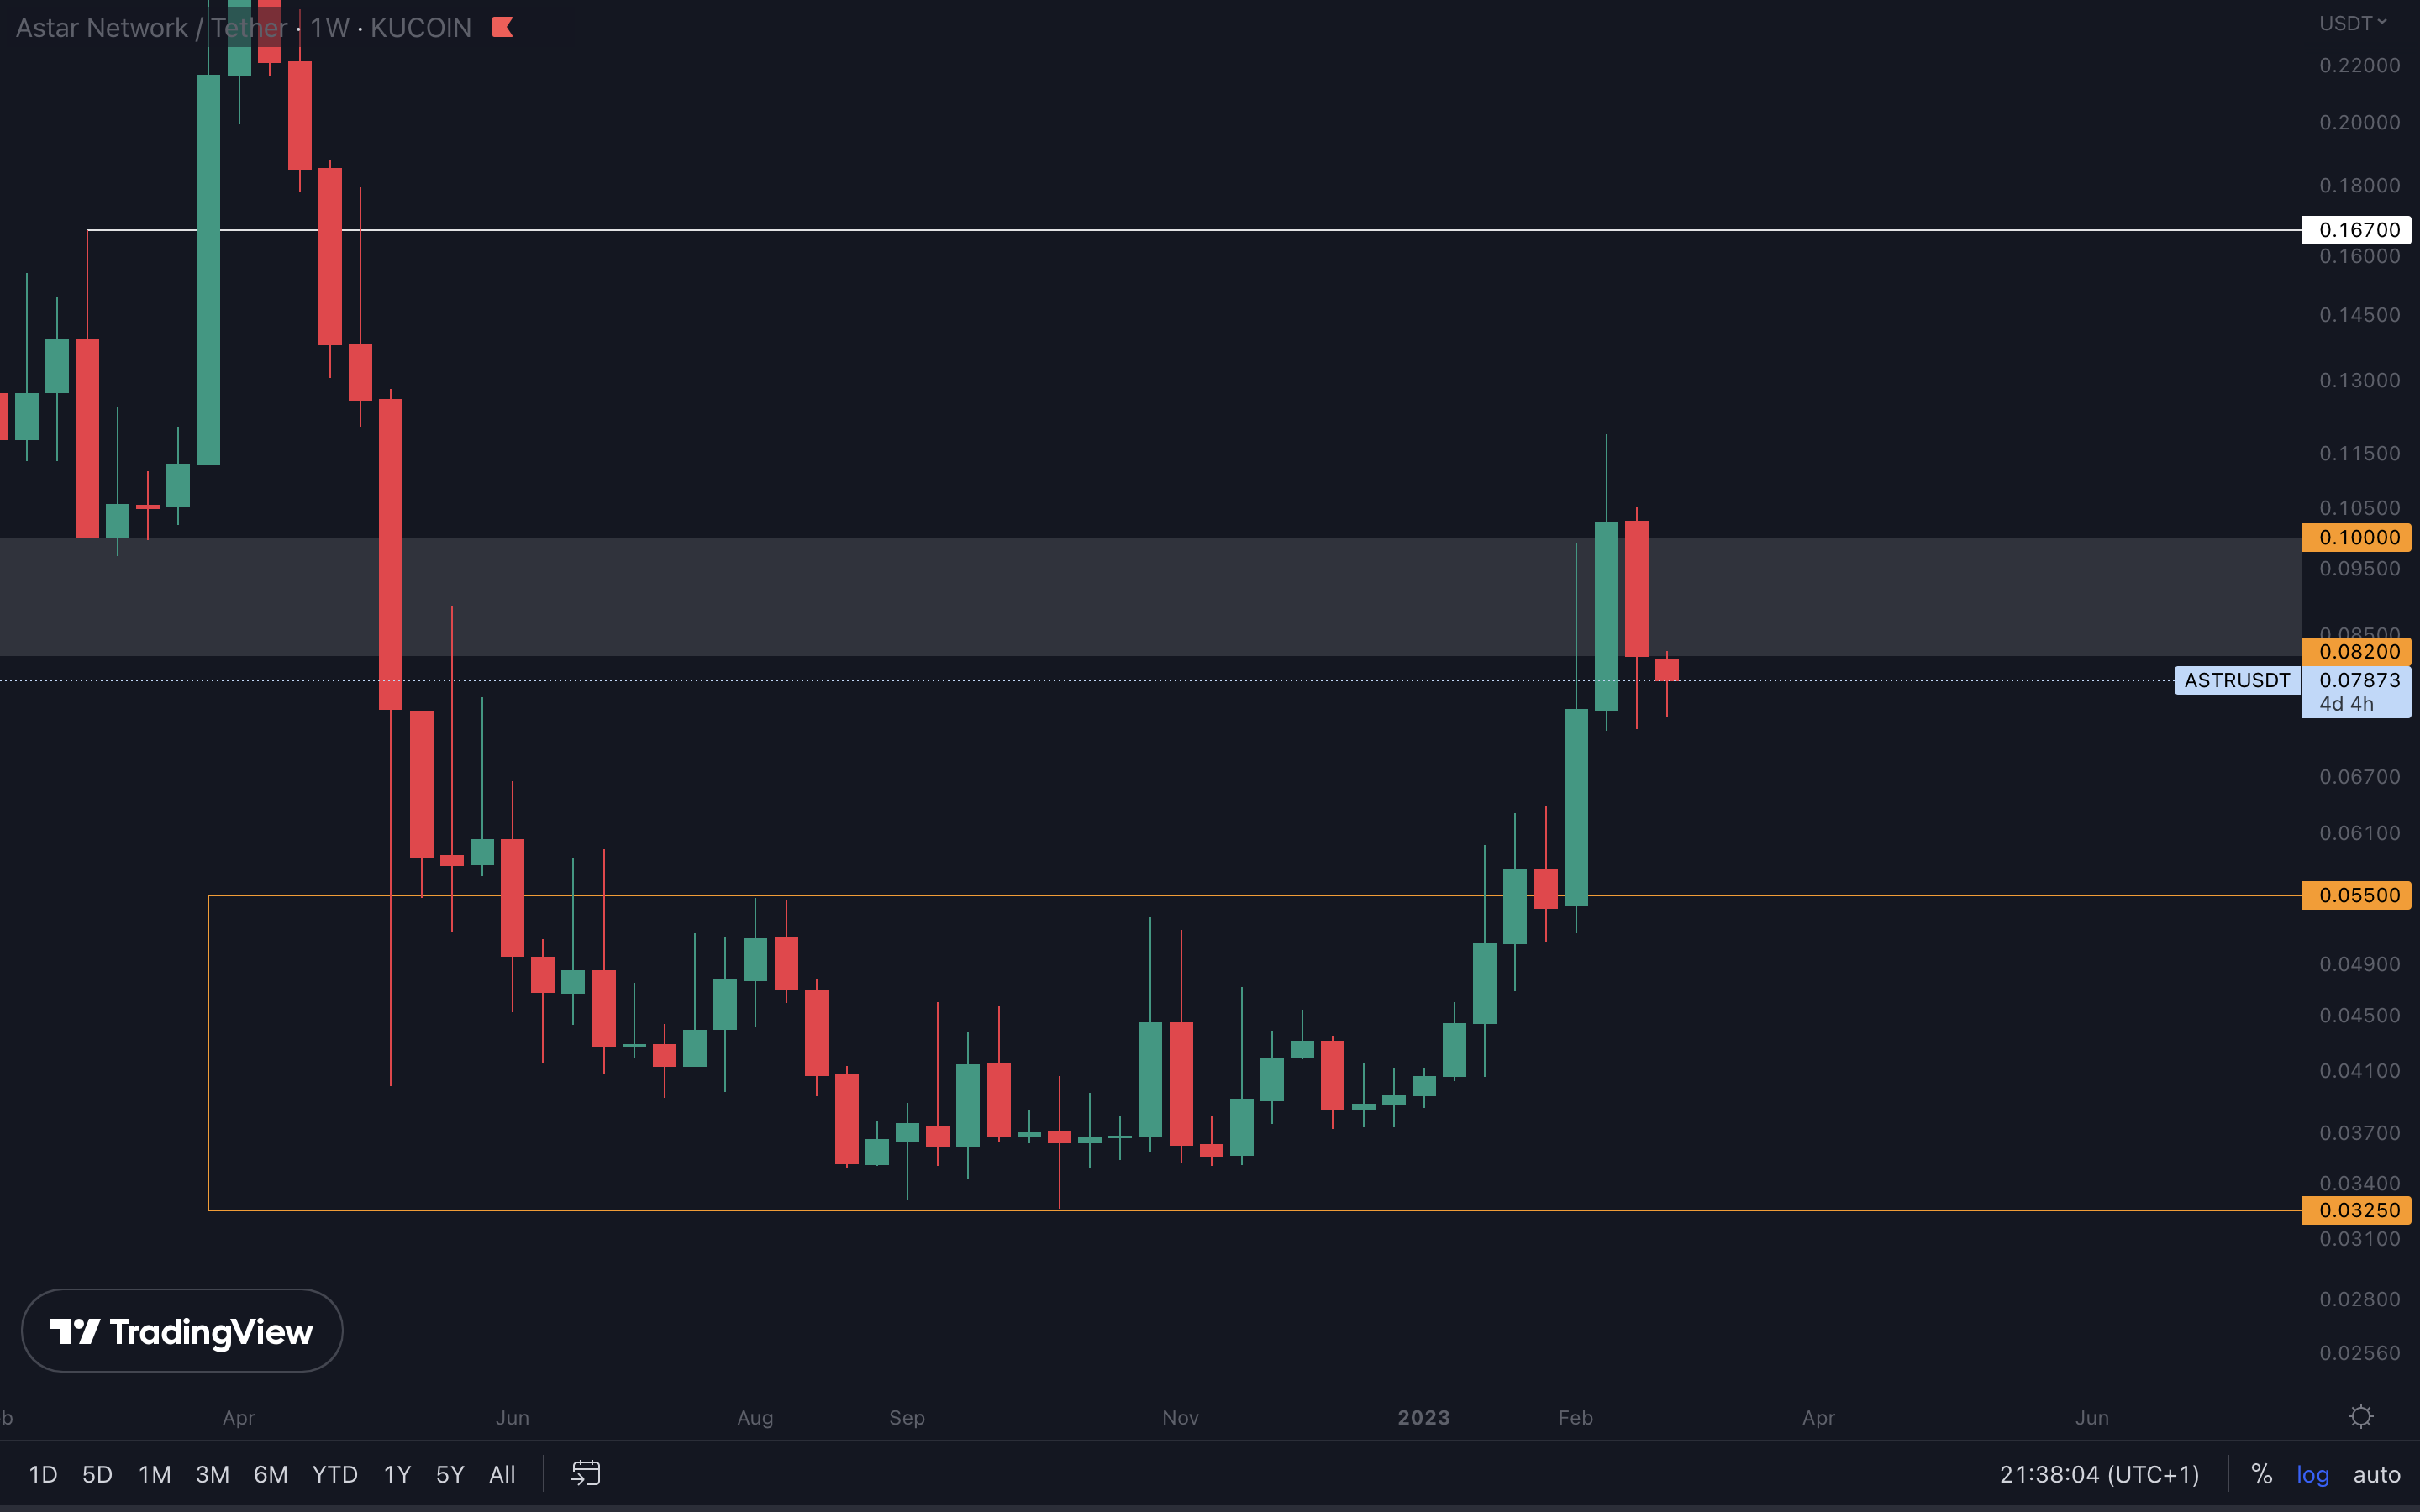
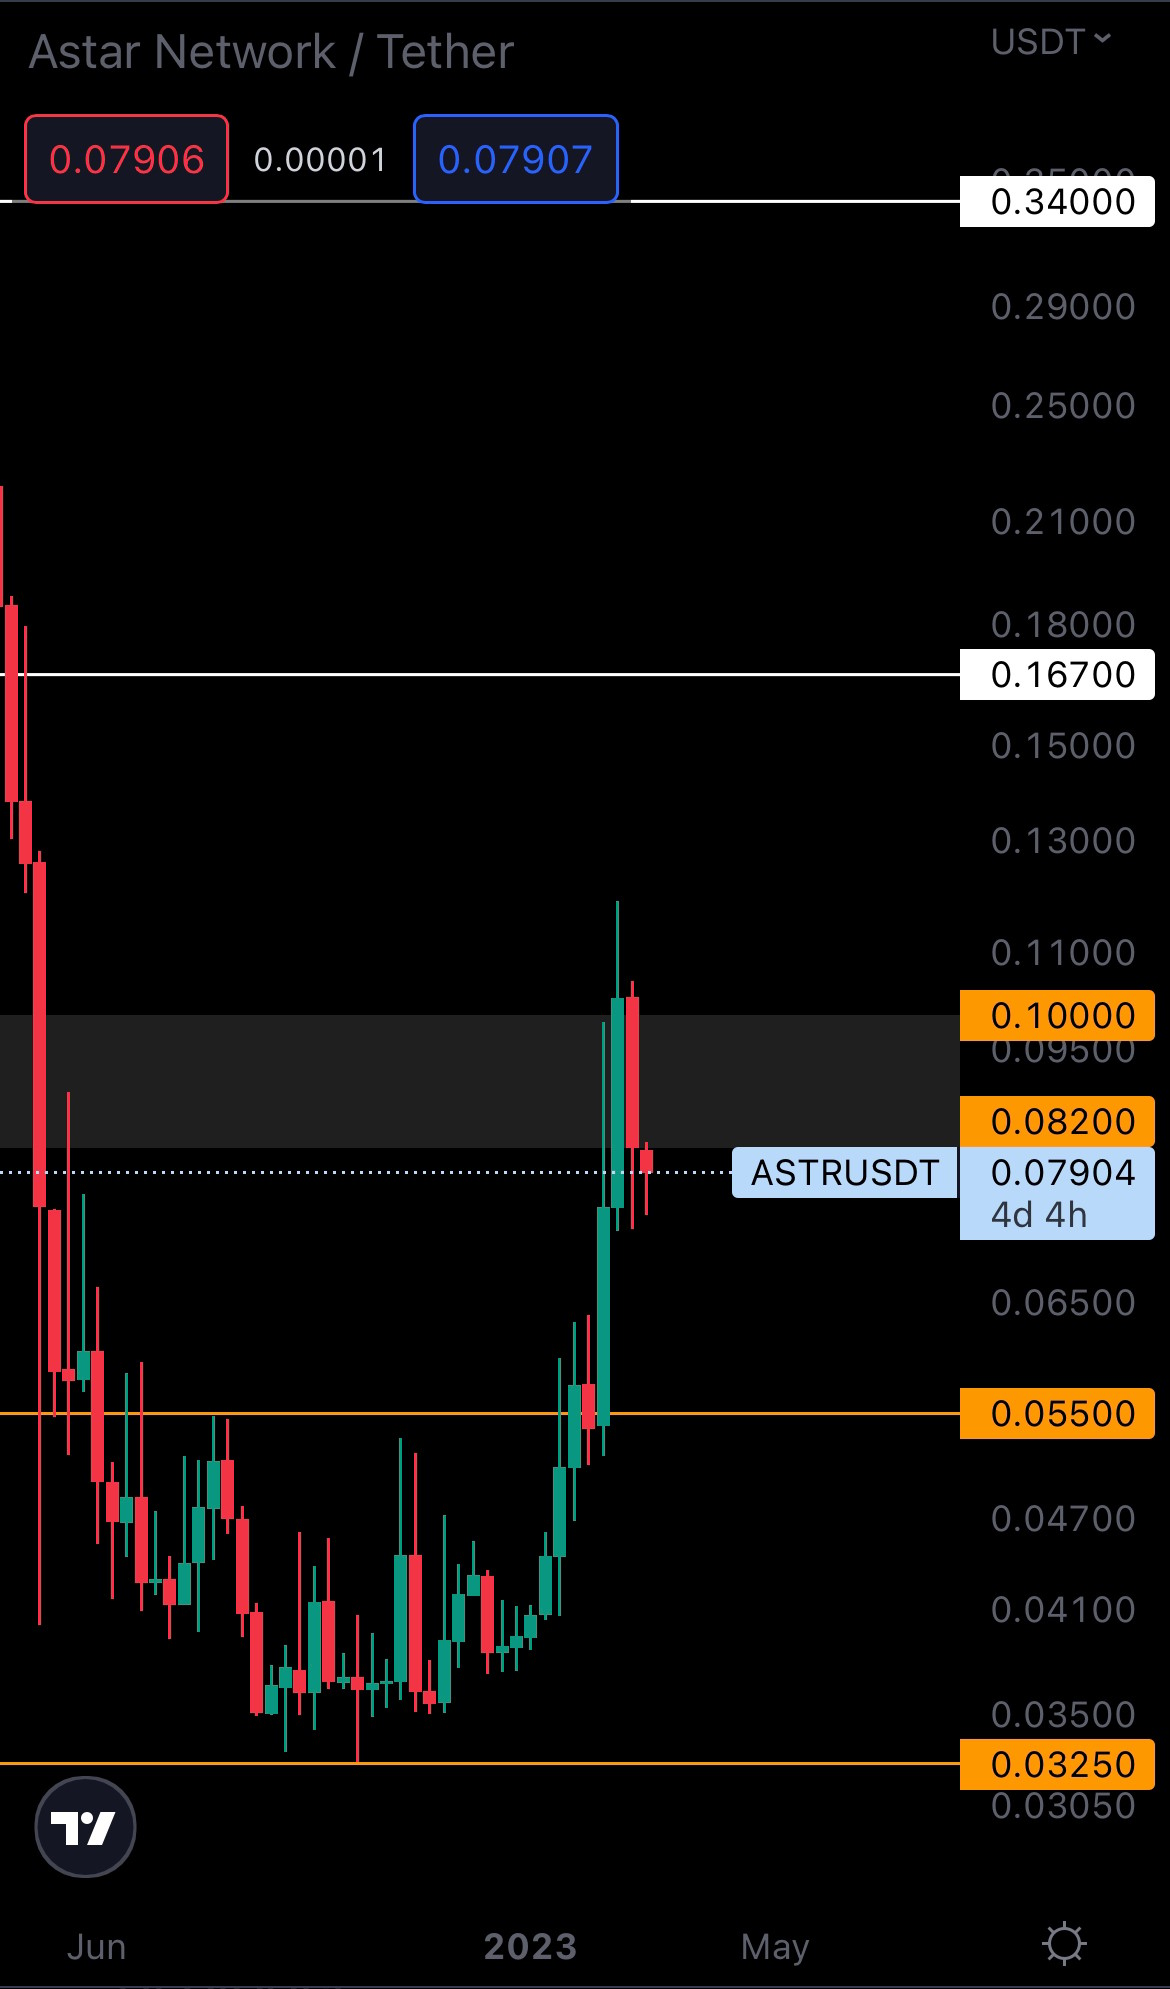
Our target for ASTR in Q1 was $0.10, and this level has now been reached. For significant upside to continue, we’ll need to see ASTR breaking above $0.10 (weekly closure above this level). This will put $0.16700 on the cards. It’s unlikely whether ASTR will reach $0.16700 or not, but when paired with our market expectations for Q2, this target might be reached at some point in the next quarter.
THOR | THORSwap (Monthly)
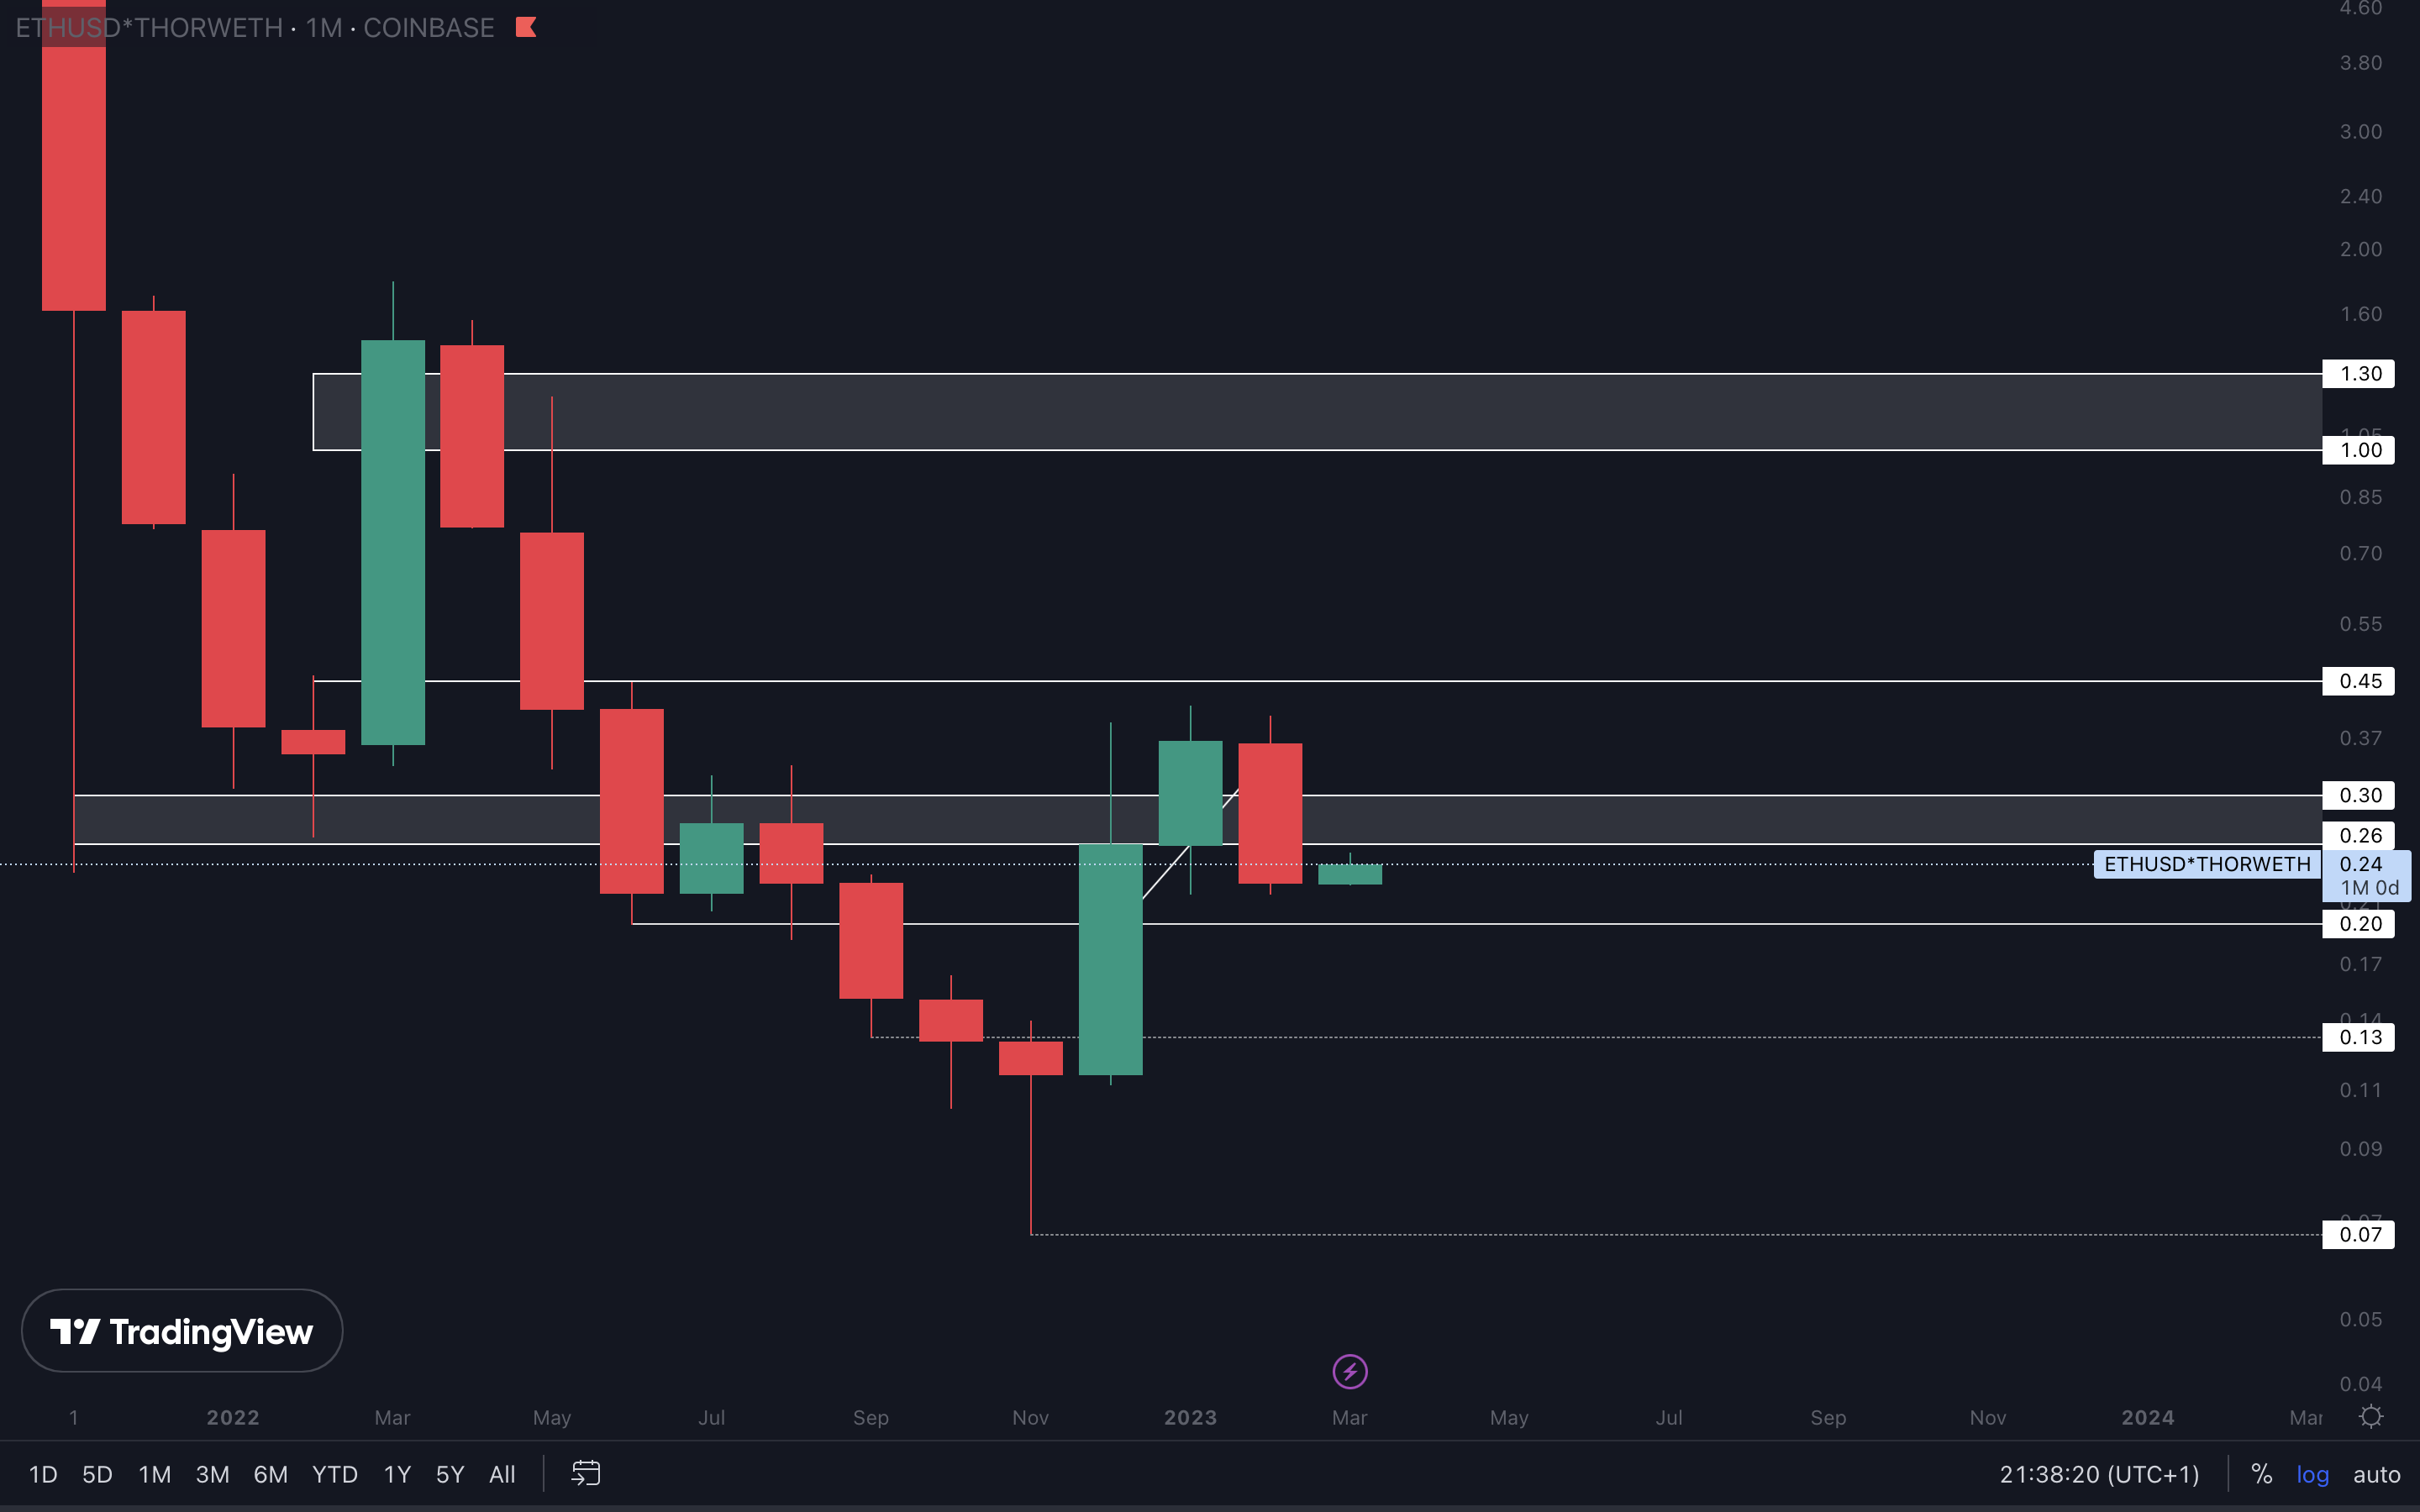
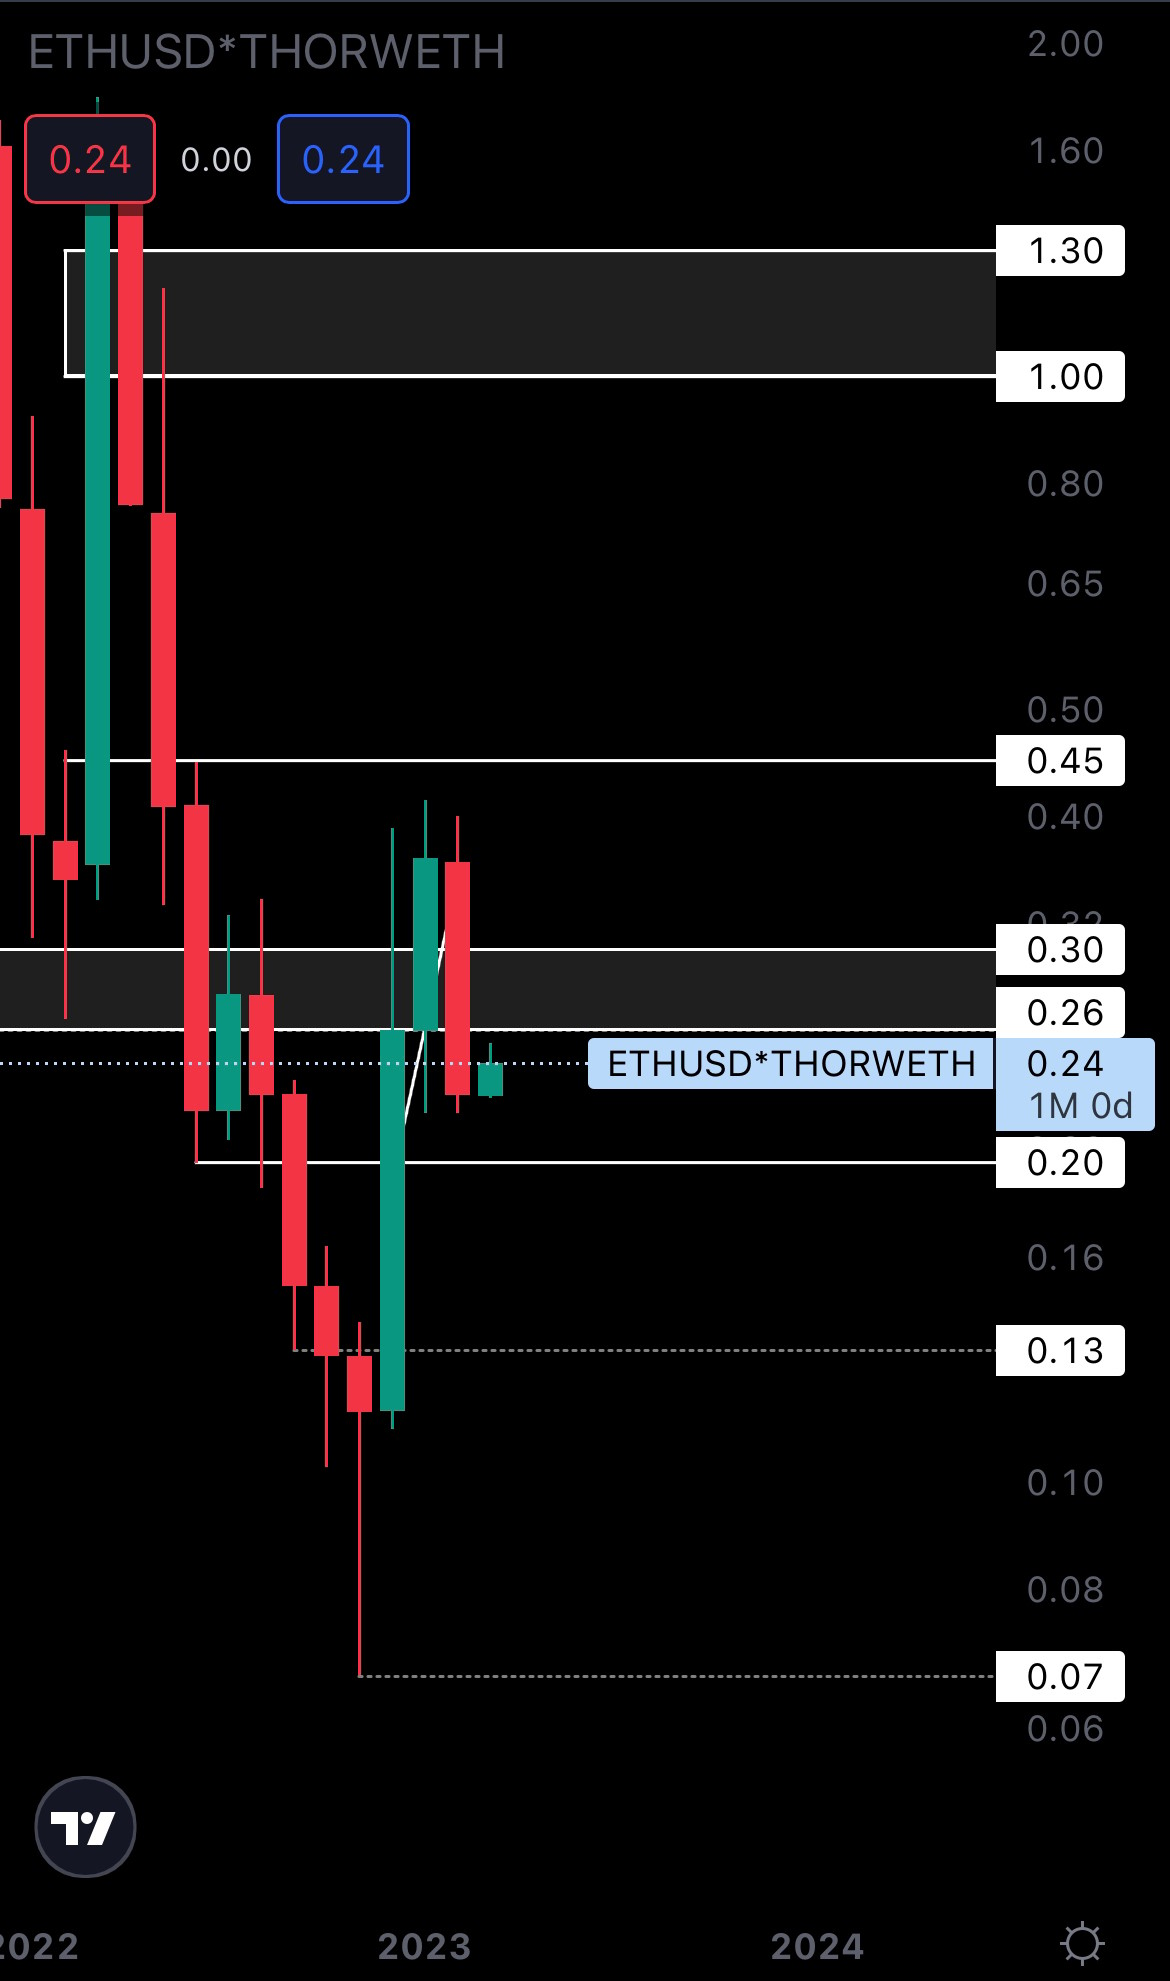
THOR closed last month’s candle as a bearish engulfing. This now confirms $0.20 as our next target not only on the weekly timeframe, but also on the monthly timeframe, which reinforces the possibility of it reaching that level. Expect THOR to drop to $0.20 during March.
MINA | Mina Protocol (Monthly)
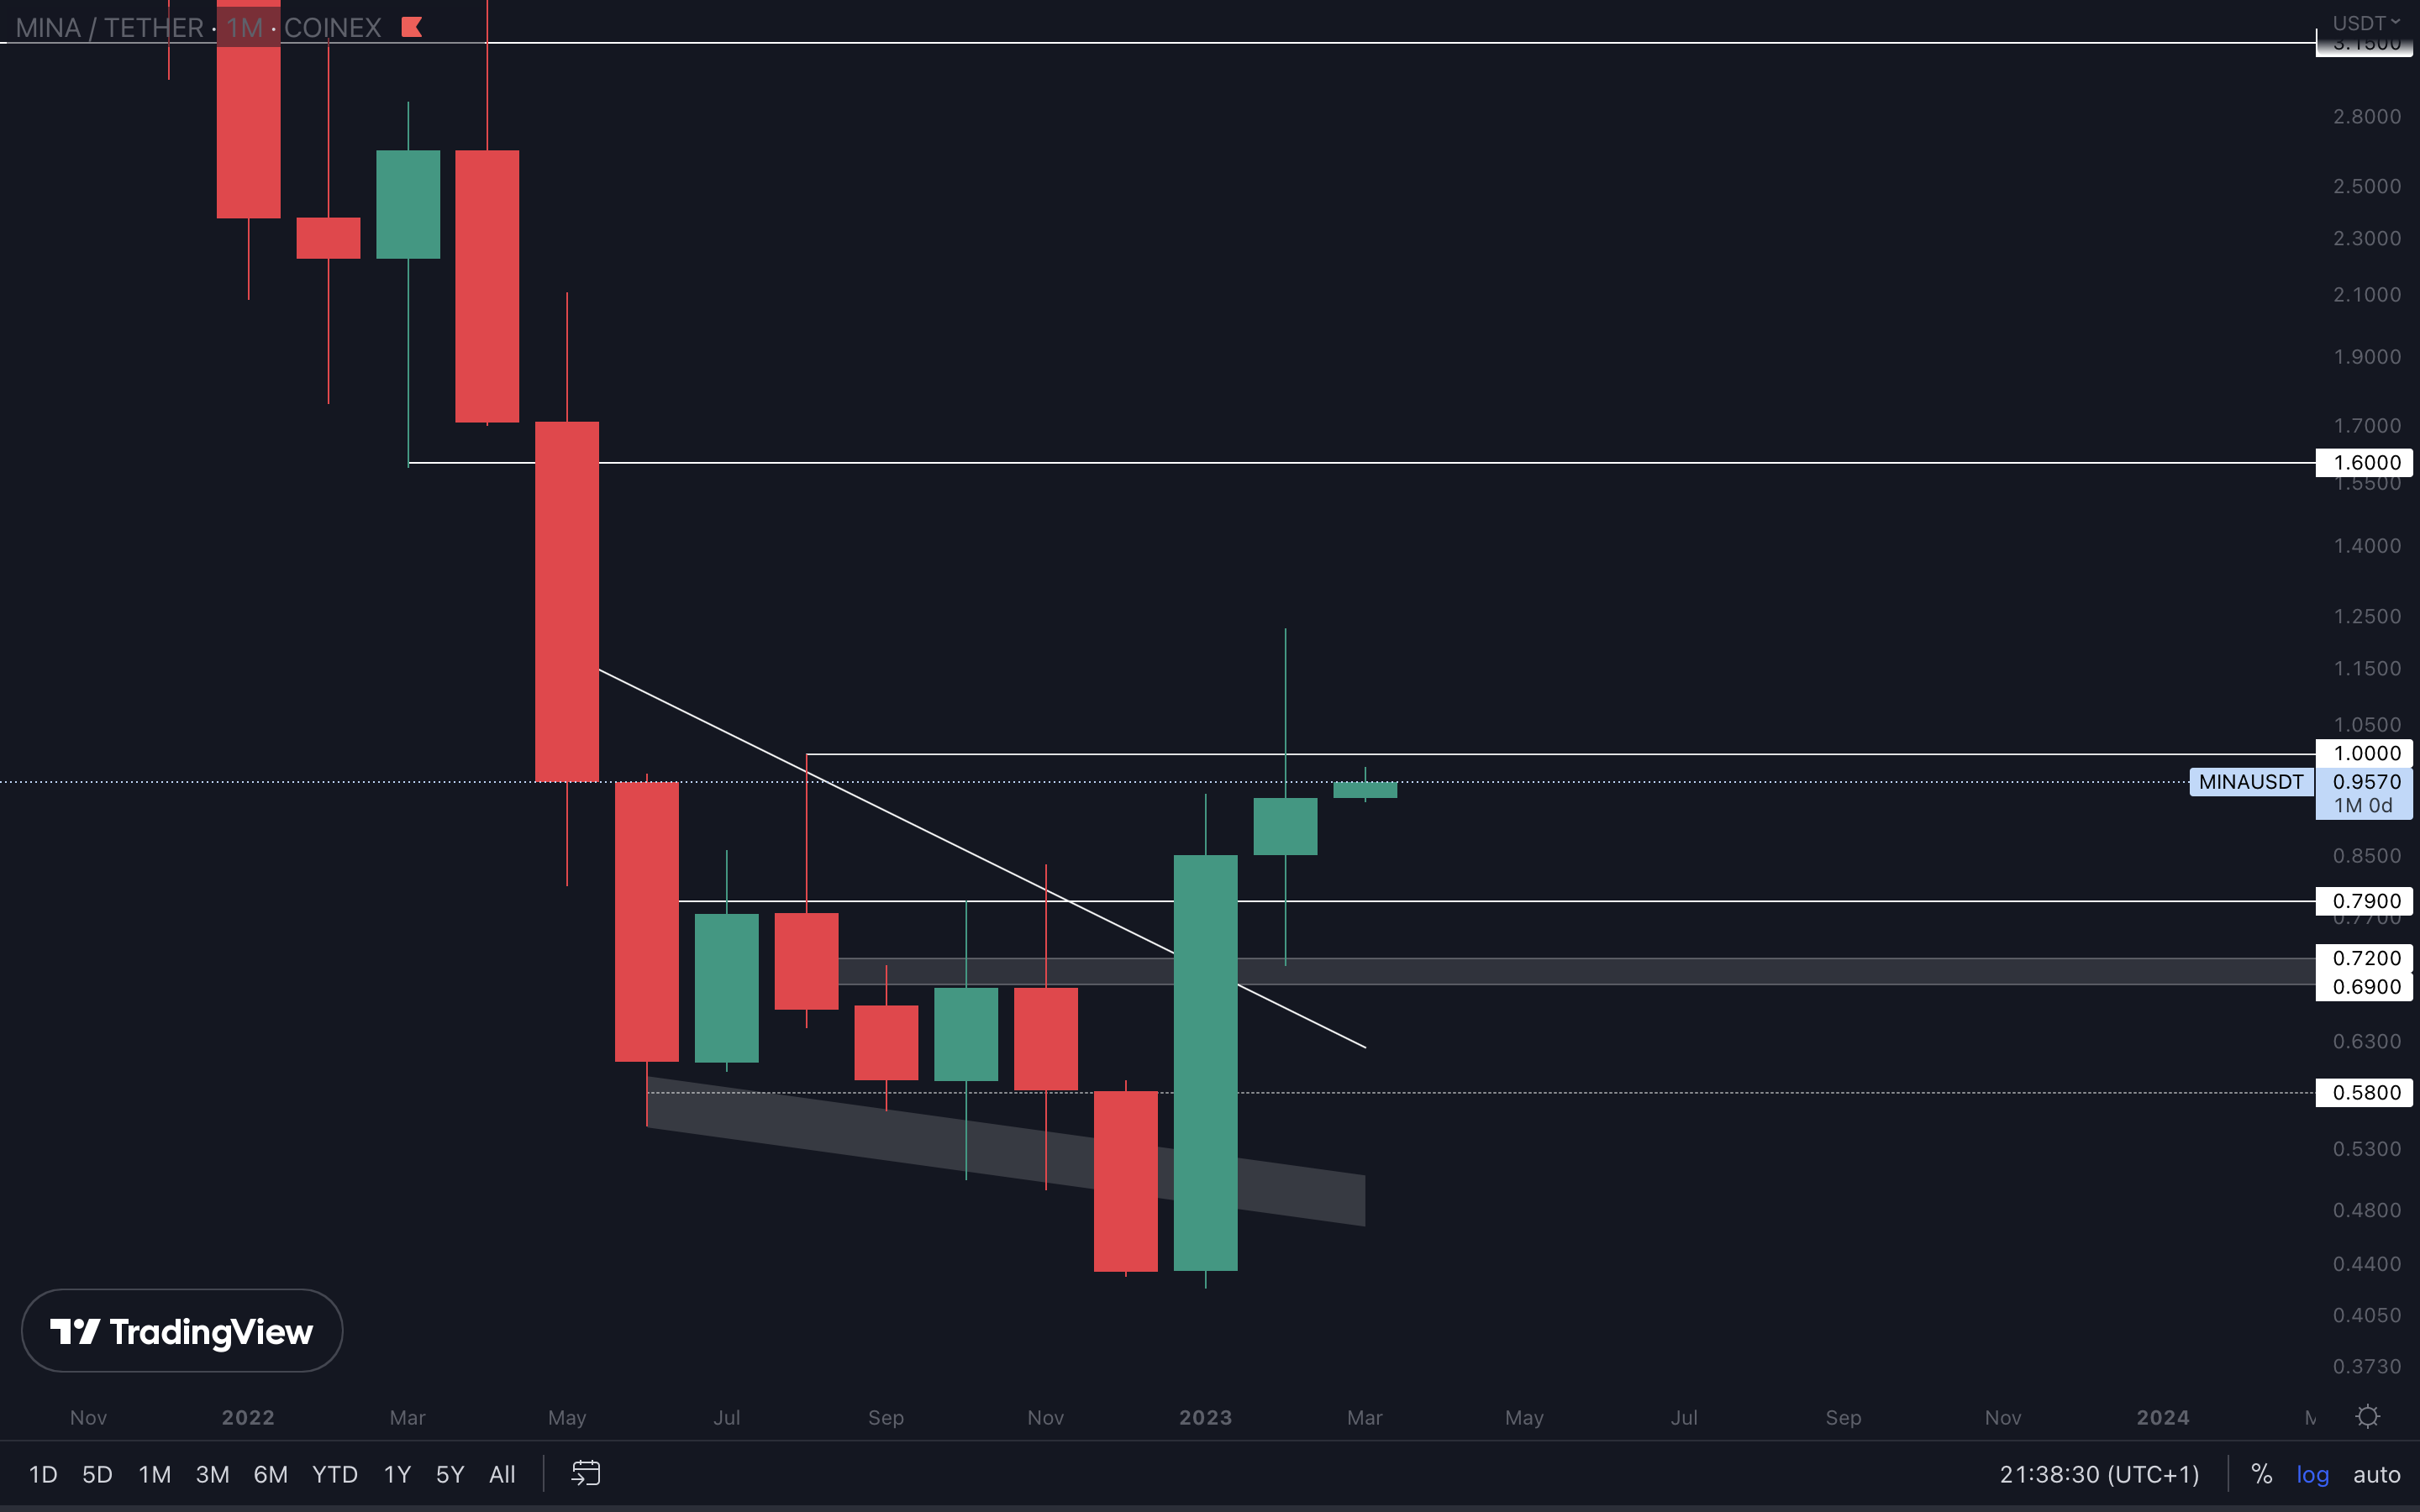
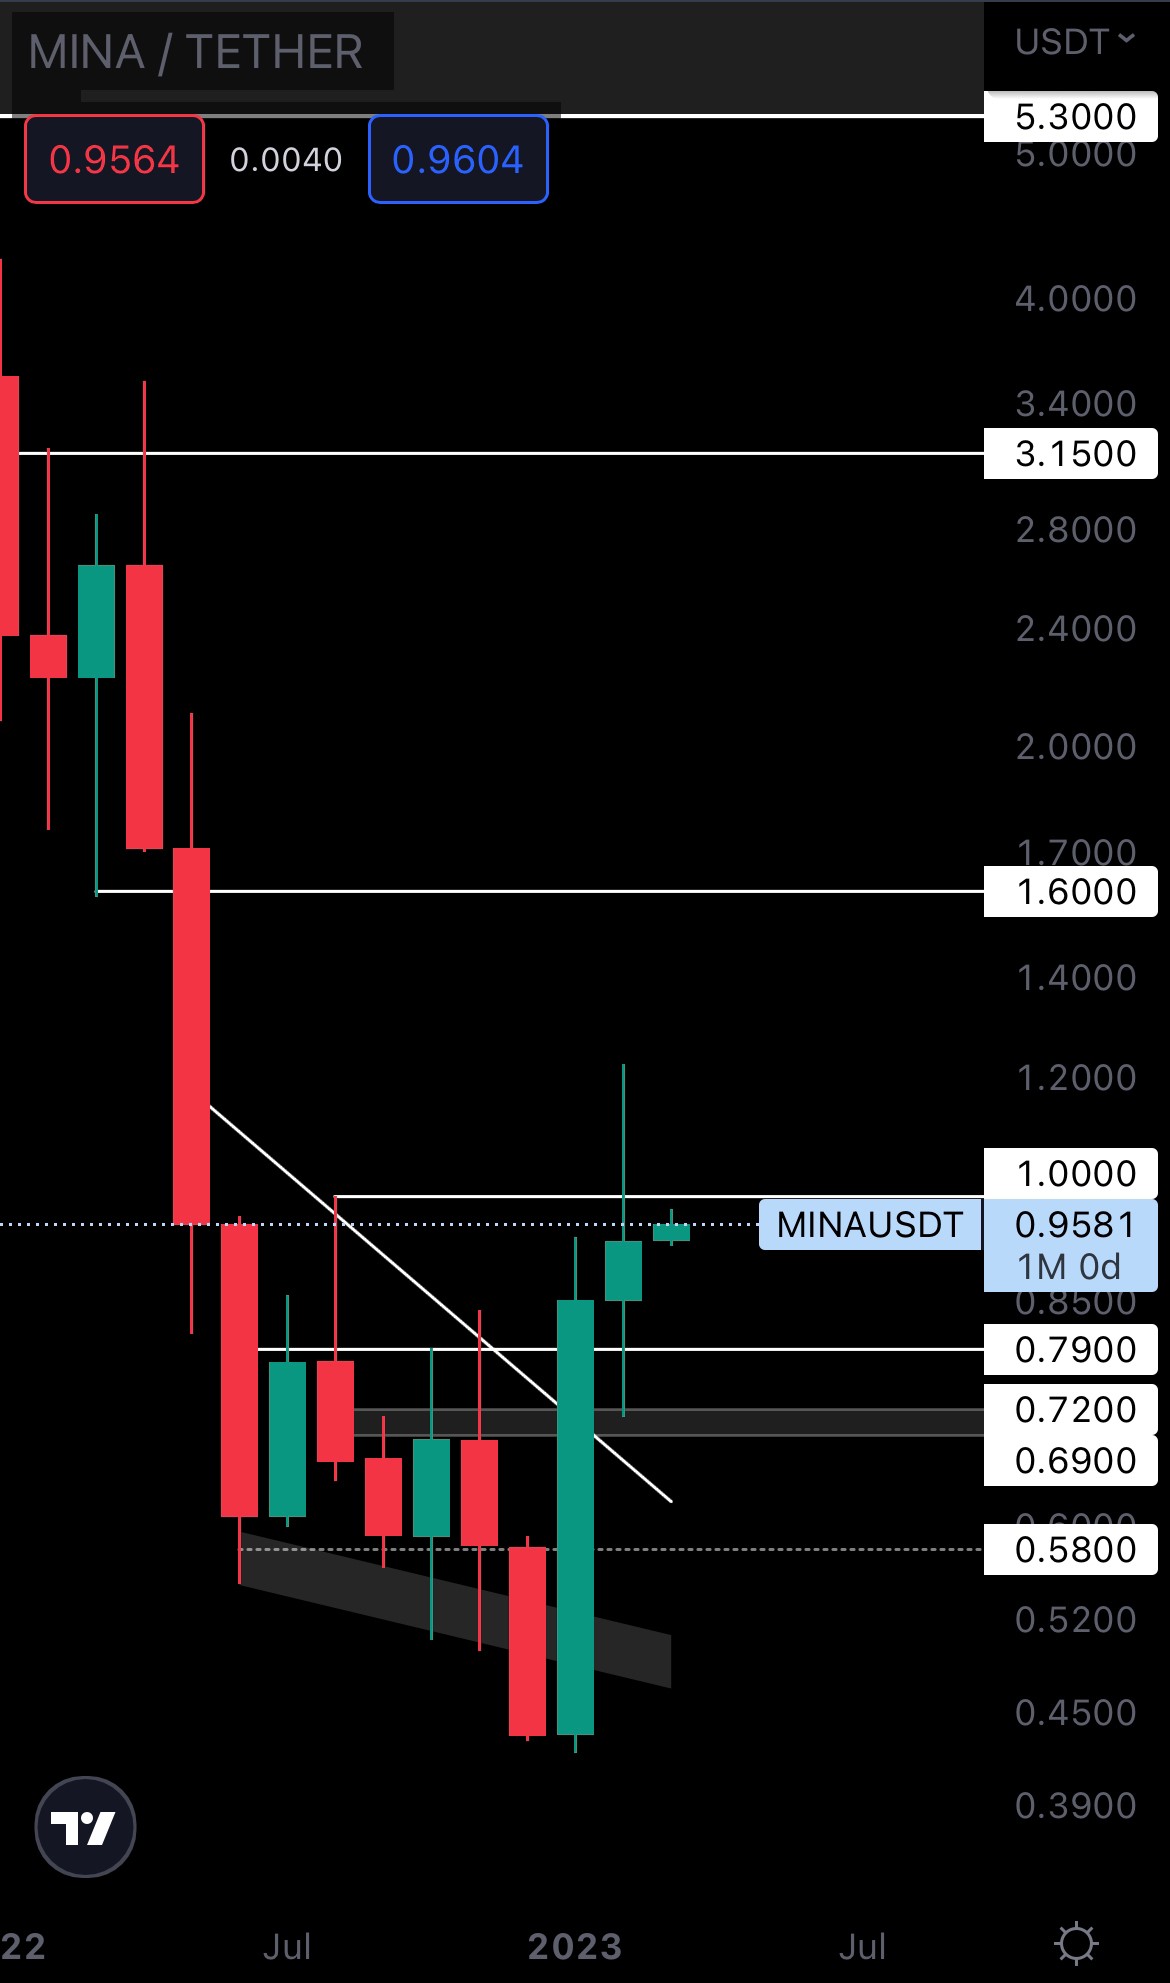
MINA had a great run in the last two months, but it has reached a major level of resistance, both technical and psychological (because it’s $1, round numbers such as this one are usually psychological resistances as well). Last month’s candle might indicate some exhaustion, which is why it’s necessary for MINA to reclaim $1 as support, otherwise, it could be going to $0.79 again during March. Because a confirmation of this will come later on the monthly timeframe, a weekly closure above $1 will do. MINA reclaiming $1 will open the door for $1.60 during Q2.
STG | Stargate Finance (Weekly)
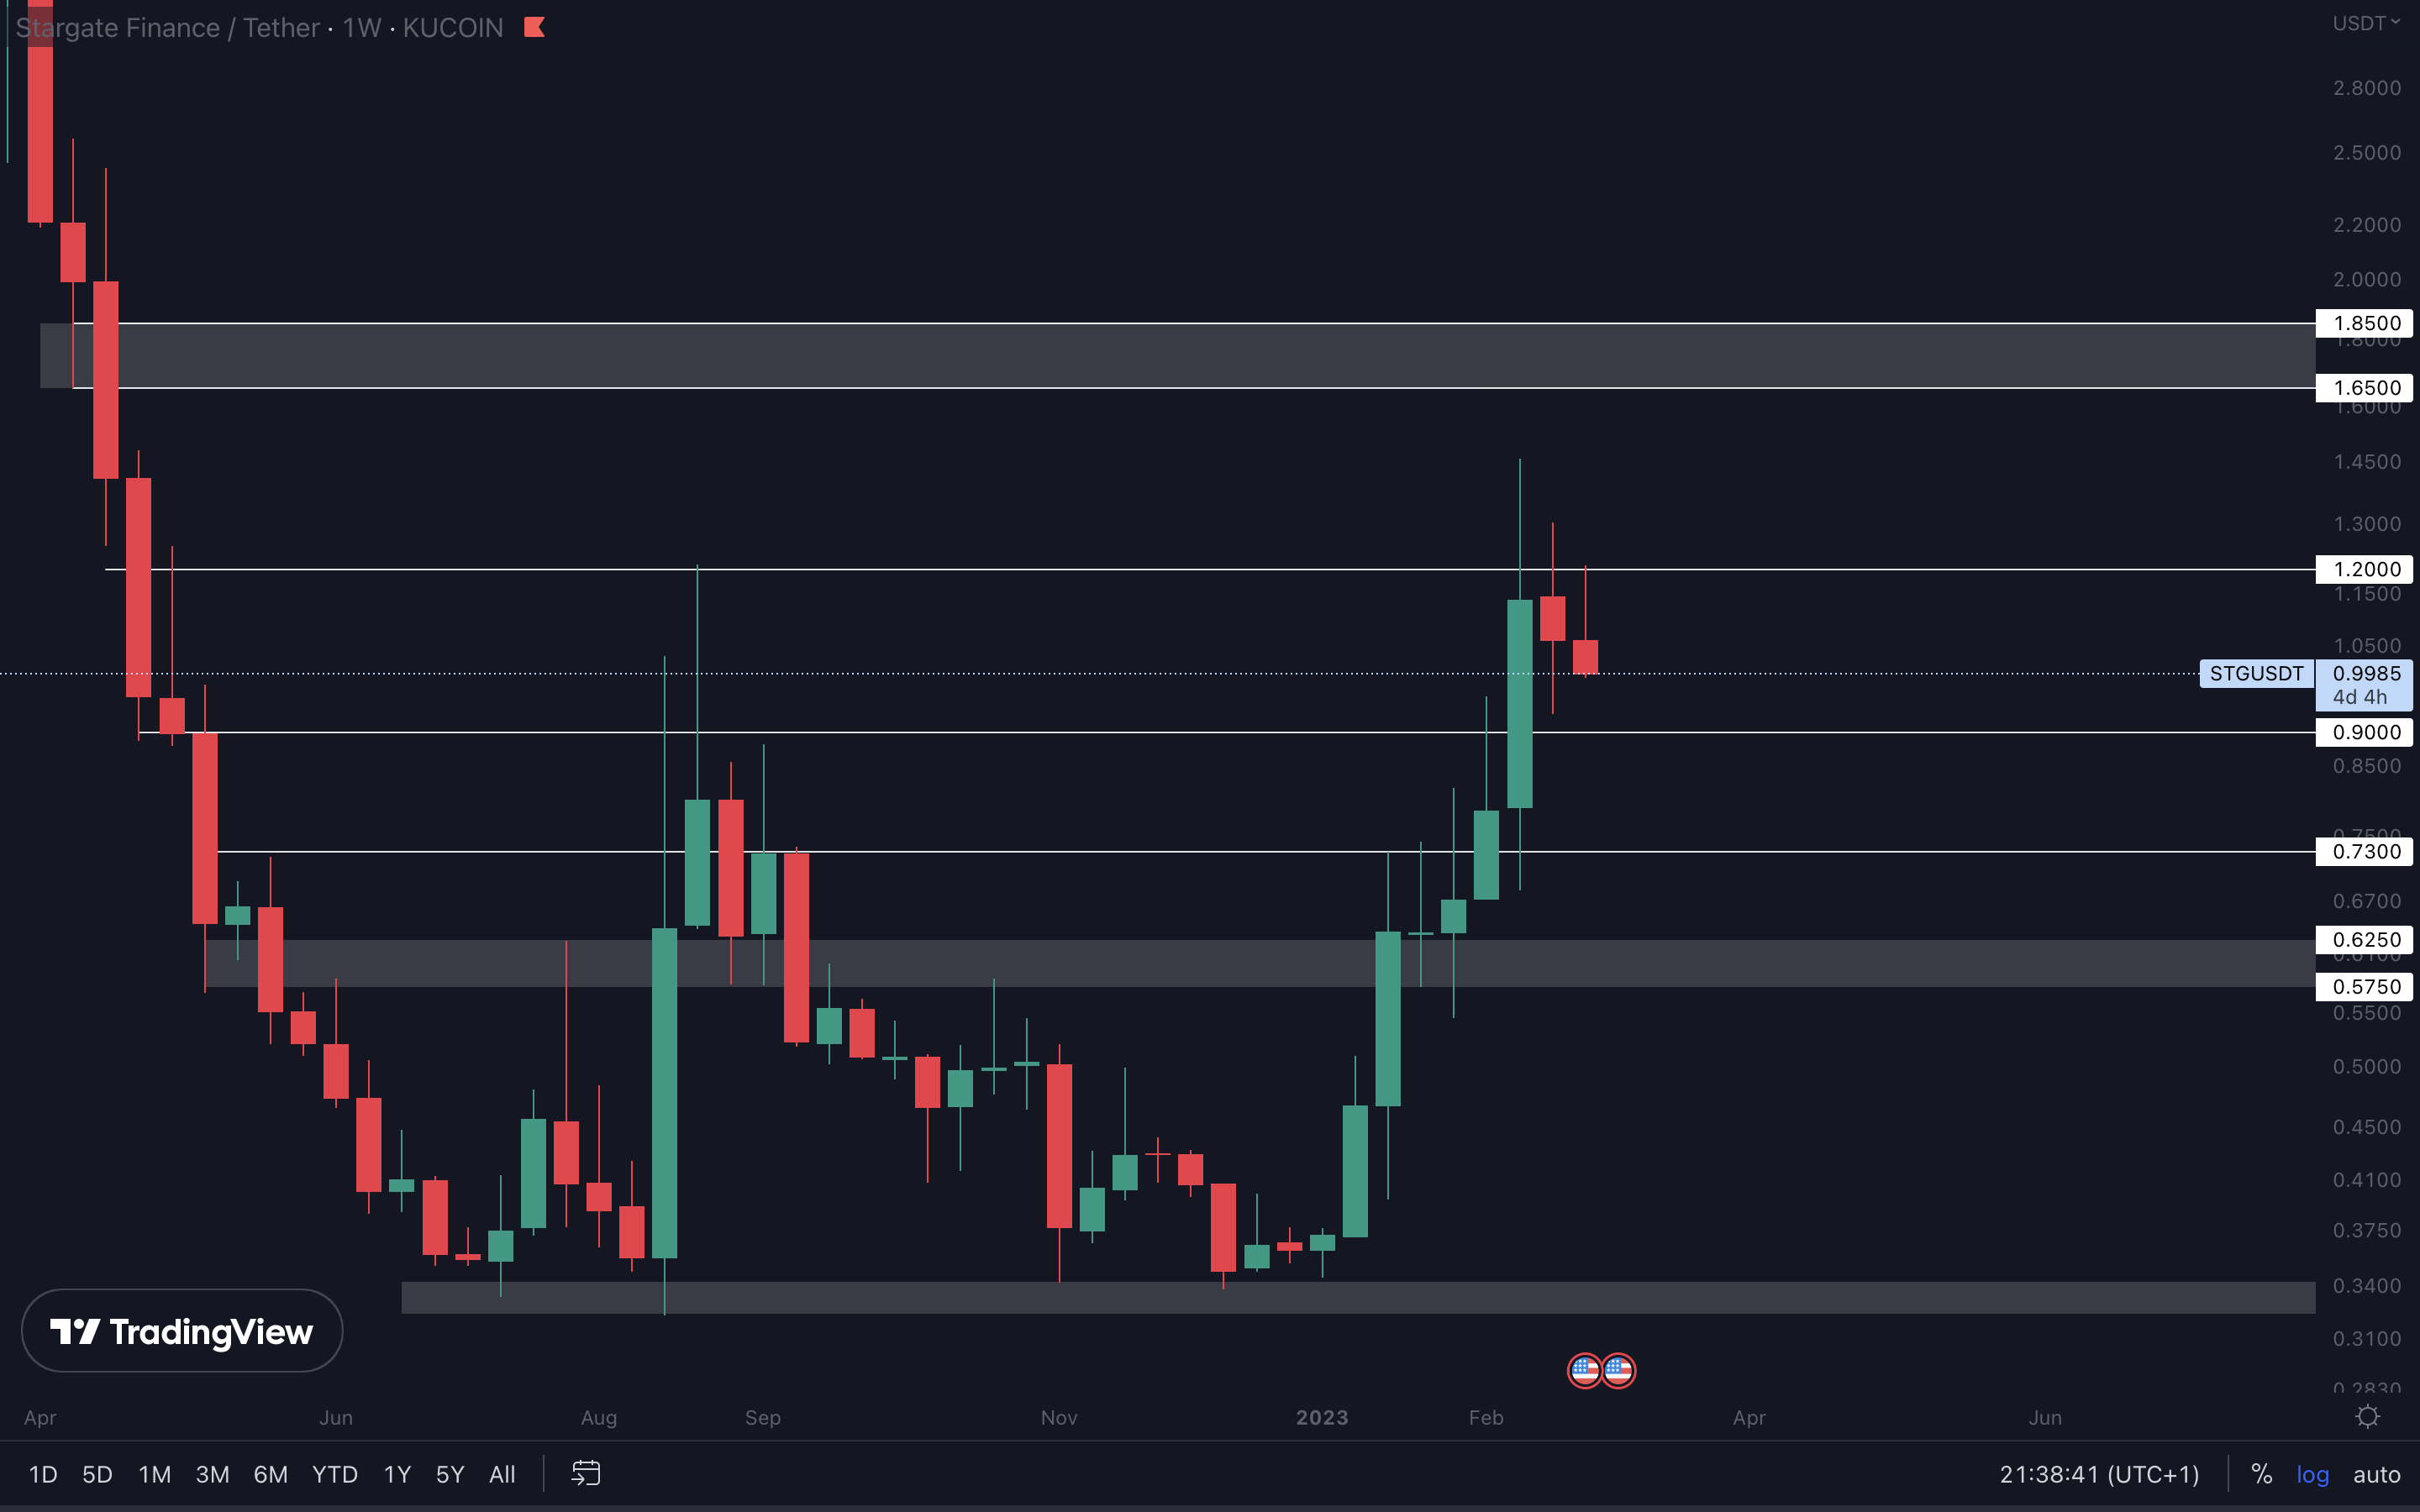
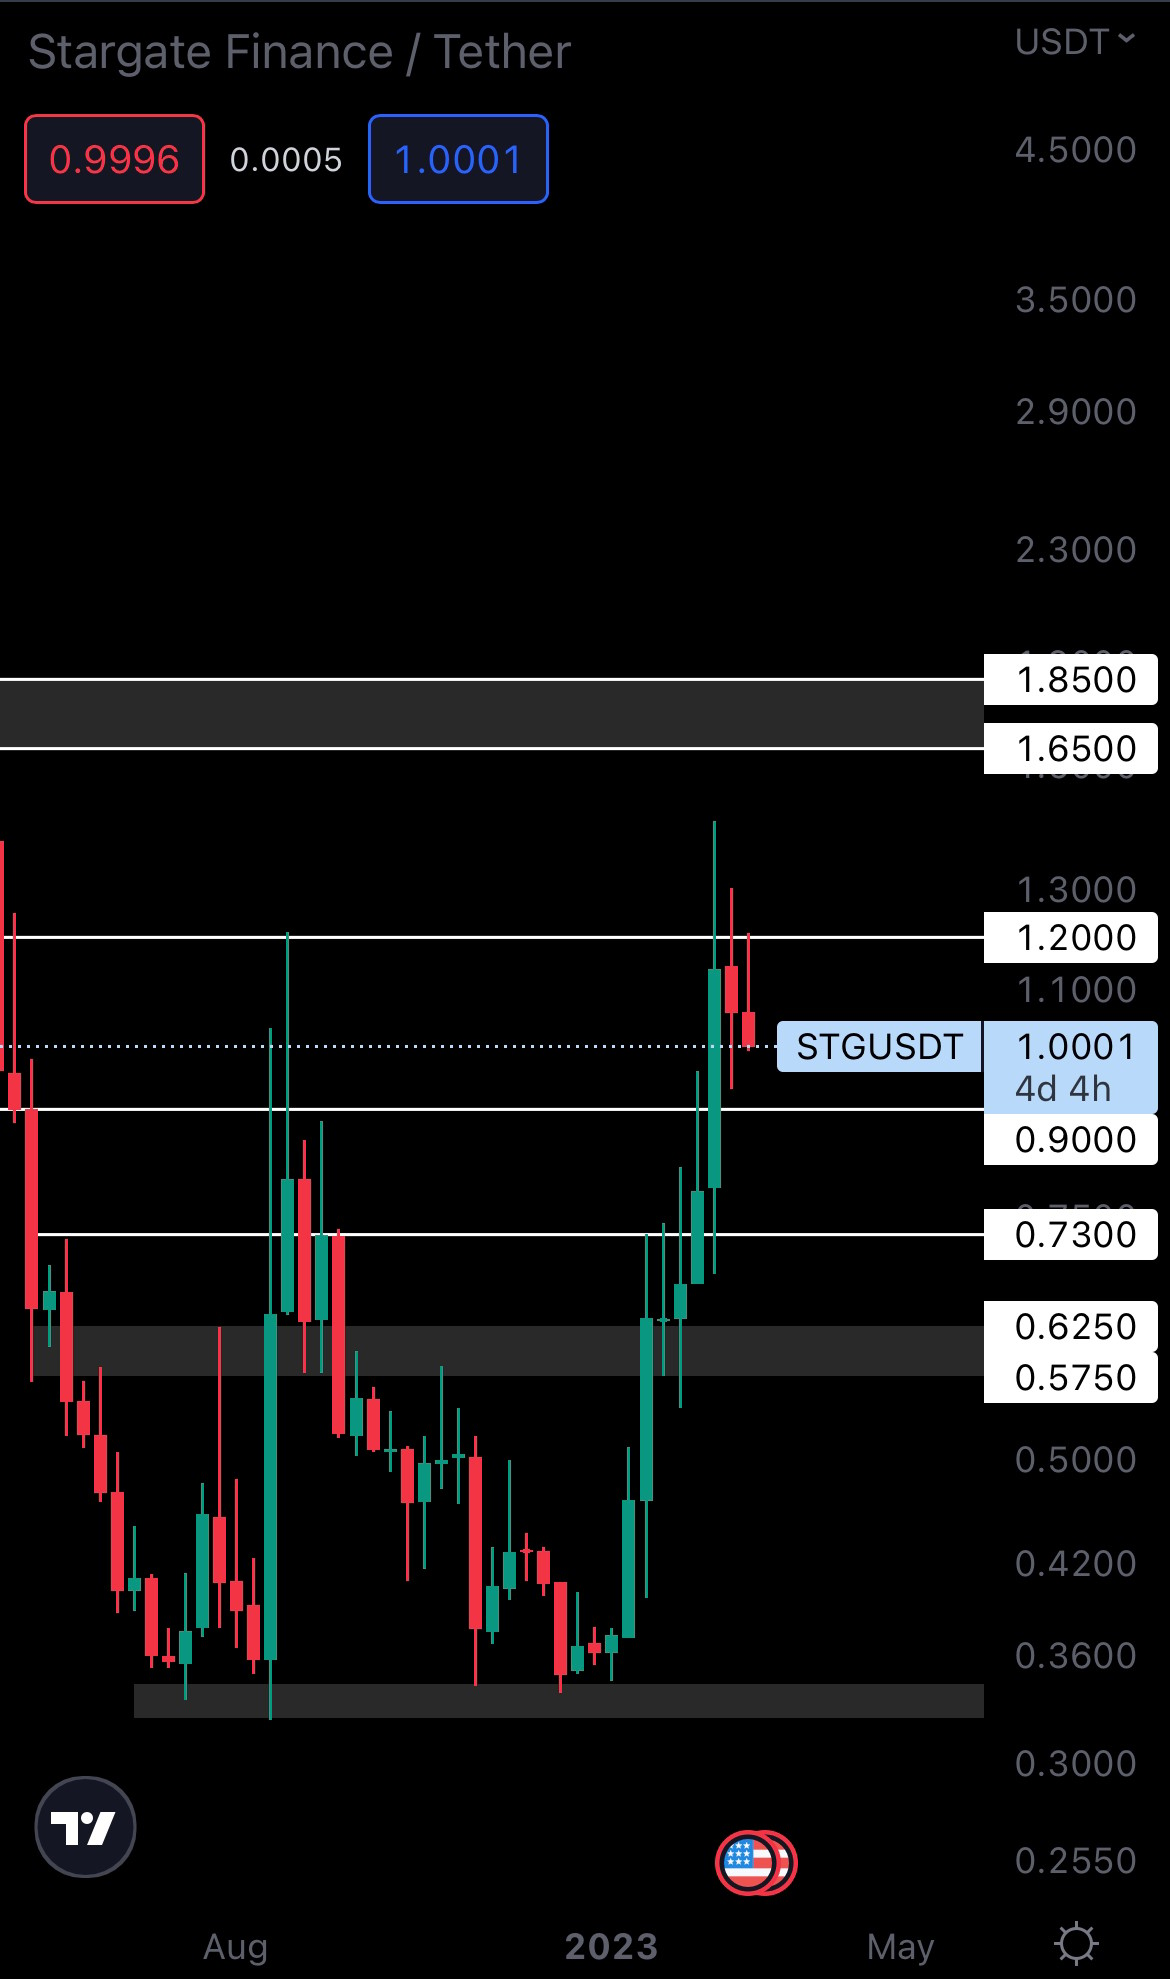
It looks like STG is headed for $0.90 after failing to reclaim $1.20. Its weekly market structure is bullish, so we might be looking at a higher low forming at some point, but you’ll find more on that in our weekly reports here. We’d like to see STG reclaiming $1.20. This will put $1.65 - $1.85 as our next target for this asset during Q2.
Cryptonary’s take
Although March is, overall, looking indecisive (this can be seen on the indexes), the foundation for a healthy Q2 is being set. Both indexes, Bitcoin and most altcoins are at support on higher timeframes and are showing bullish signals for the months to come.Here are a few action points for you as we head into March and the start of Q2:
- The market could be indecisive in March (with few exceptions). We recommend waiting for Bitcoin to break resistance ($25,150) as confirmation of upside during this month.
- Now’s the time to spot the juicy opportunities as we head into Q2. If you’re unsure where to start, you can check our latest SITG report where we share our newest investments.
- To maximize gains, focusing on altcoins is our best play.
Recommended from Cryptonary


