Save 23% ($351) & Get a Free 1-1 Call with our Team ⏰ : 0d 2h 59m 44s

Let’s dive into the key levels and price actions to watch this week for BTC, ETH, SOL, WIF, POPCAT, and SPX6900!
Disclaimer: This is not financial or investment advice. You are responsible for any capital-related decisions you make, and only you are accountable for the results.
BTC:
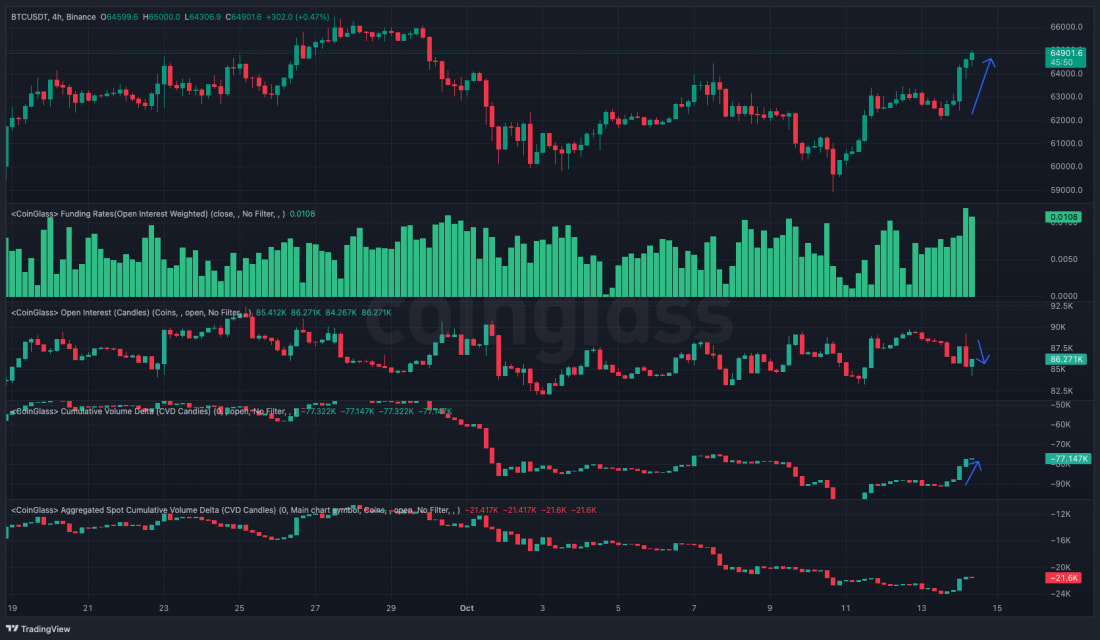
- Price has been pushed up by Spot buying, whilst Open Interest has decreased and Funding Rates are up (so Shorts closing out).
- From a mechanics viewpoint, this is what you want to be seeing.
Technical analysis
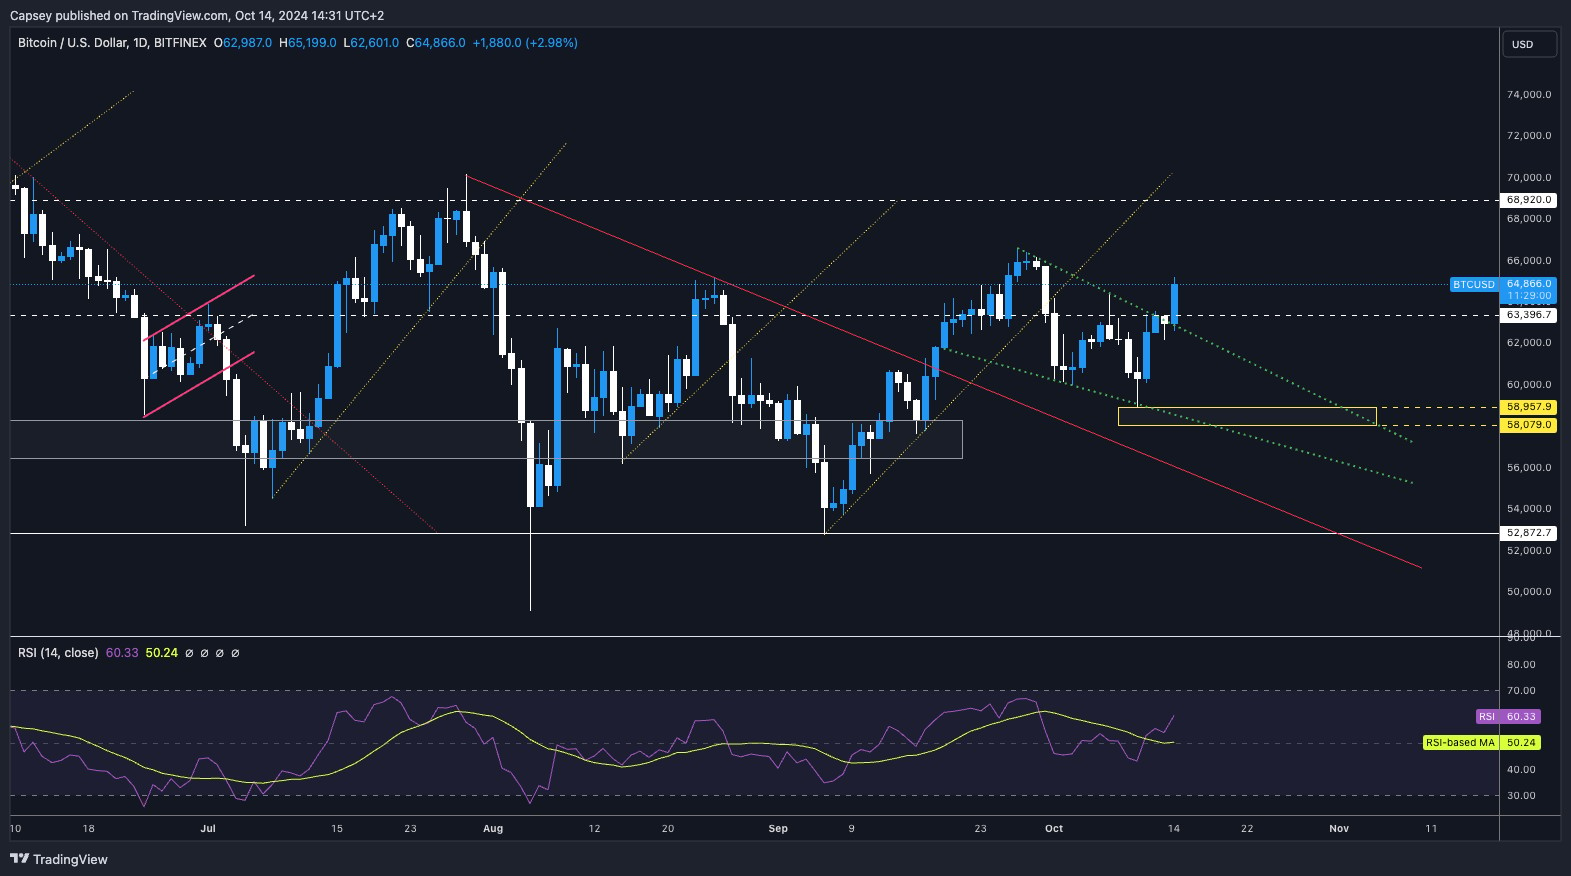
- We initially thought BTC might reject at the $63,400 level and pull back further. But, price has broken to the upside, great to see.
- Price has also broken out above the descending wedge, which we expected, but thought we might see that price pull back first.
- The $65k to $66k has previously acted as a resistance zone for price, so this is a key level for Bitcoin to overcome here.
- To the downside, we'd expect the $63,400 level to act as a new local support for price.
- The RSI has broken above the Moving Average and is now heading higher, but not yet close to being overbought.
- Next Support: $63,400
- Next Resistance: $66,000
- Direction: Neutral
- Upside Target: $66,000
- Downside Target: $63,400
Cryptonary's take
A really positive move here from Bitcoin, which is perhaps playing some catchup (to MicroStrategy, which has been ripping higher). Now it's possible that full risk-on attitude isn't ready to come back in, just weeks before what looks like a close US Presidential Election. However, chart-wise, BTC looks good, so we're positioned well.In the short term, it's possible that BTC struggles here as we're at a horizontal resistance ($65k to $66k). Therefore, it's possible we will see a slight pullback to potentially $63,400 before we can test higher from there. Very hard to call in the immediate short-term here. A break above $66k would be seen as a huge sign of strength, and we would be at full risk of this.
ETH:
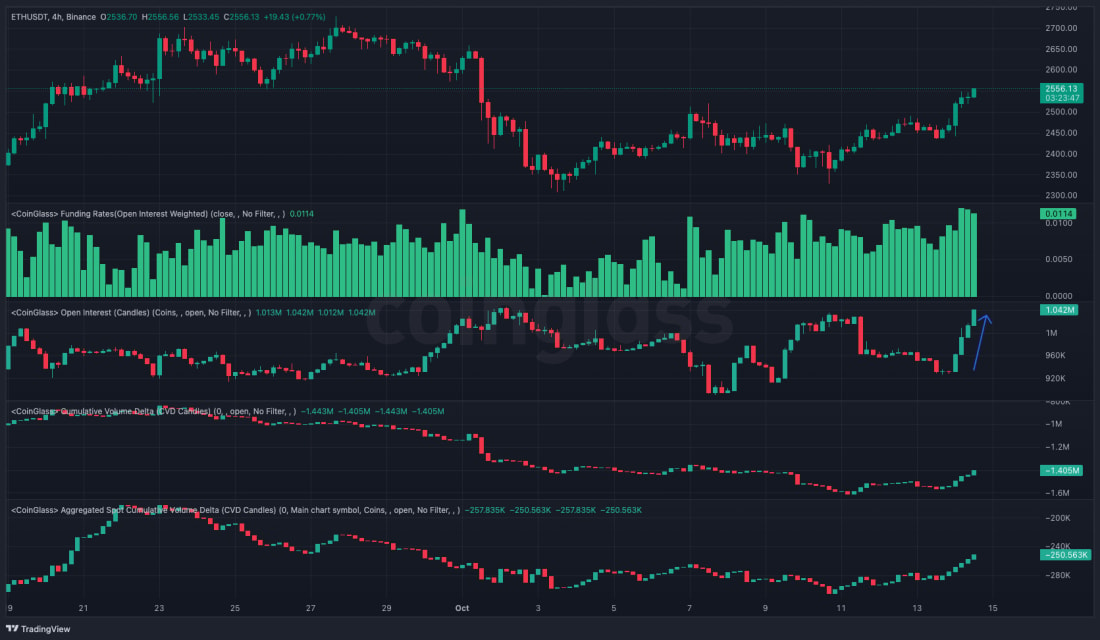
- We're seeing a large Spot bid come in (seen in increasing CVD). However, Open Interest has increased substantially, with Funding Rates quite positive, suggesting Longs have also piled in over the last 24 hours.
- Overall, this is a positive setup, particularly due to the Spot buying we've seen come in.
Technical analysis
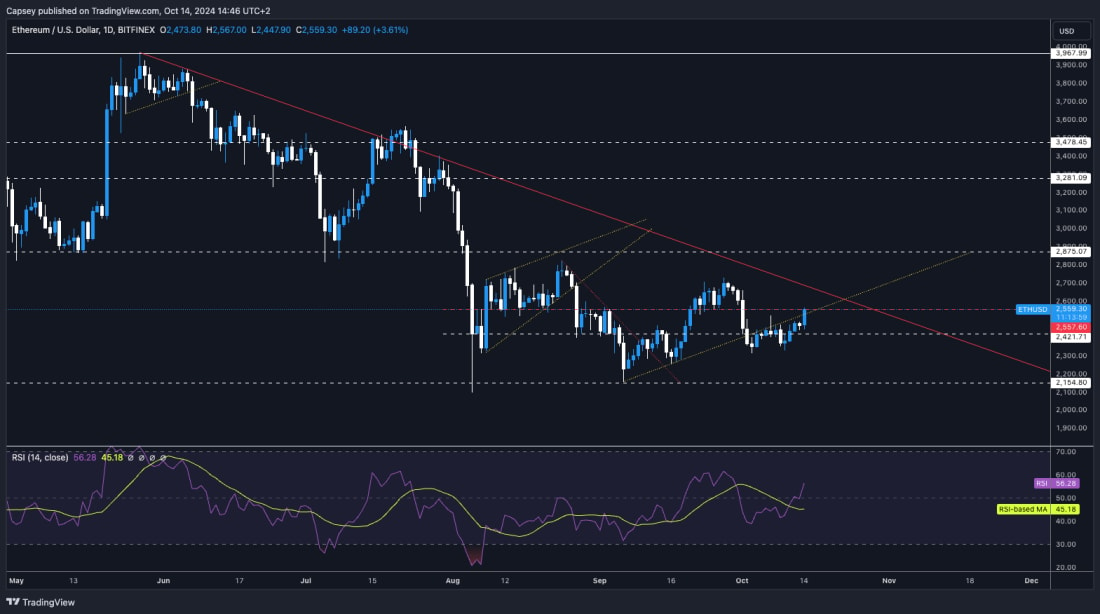
- Price is currently trying to reclaim back above the local uptrend line and the horizontal resistance of $2,557.
- The resistances for price will be the horizontal level of $2,557 and the main downtrend line.
- On the downside, the support will be $2,420 locally, and if there is a harder breakdown, $2,150 is the ultimate level.
- The RSI is breaking out higher, but it's still in the middle territory and nowhere near overbought territory - positive.
- Next Support: $2,557
- Next Resistance: $2,700
- Direction: Neutral
- Upside Target: $2,700
- Downside Target: $2,557
Cryptonary's take
ETH has a number of resistances that are just above the current price. However, we've seen good strength so far in today's move. We will now have to see if this has been followed through further. Over the coming days, it's possible we will see the price range bound between $2,420 and $2,600. If the price can hold above $2,557, that would be positive if the price can hold above the resistance line. This might also potentially set for a stronger move higher that could see a price breakout from the downtrend line.SOL:
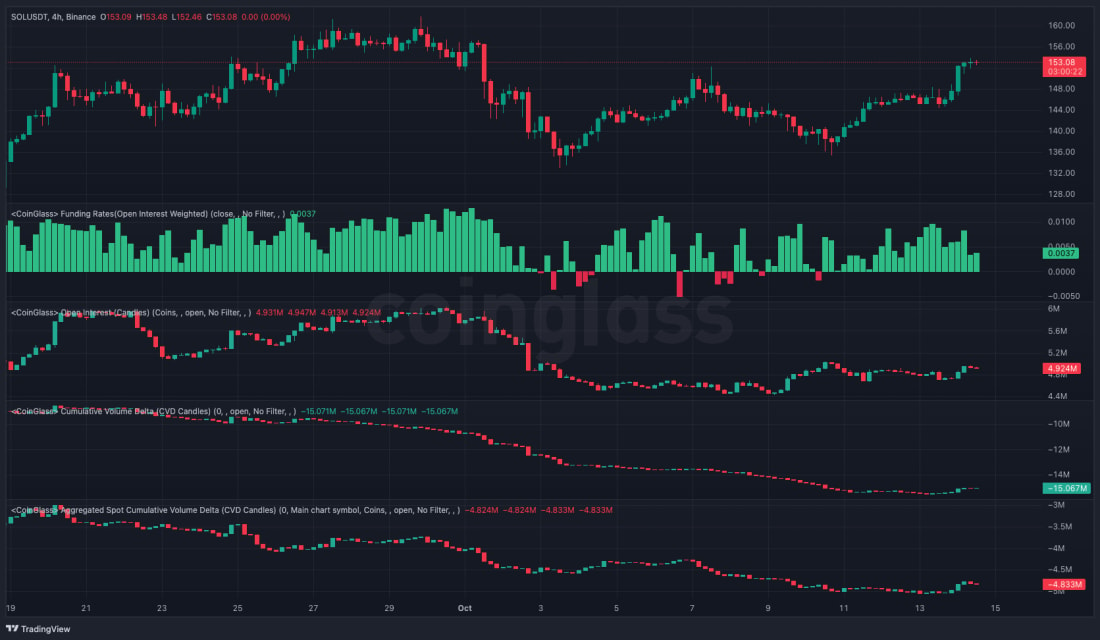
- SOL's Open Interest has increased slightly, whilst Funding Rates have decreased slightly.
- The price has likely moved higher due to a small spot bid, as shown in the slightly increasing CVD.
- Ultimately, from a mechanics viewpoint there are some slight changes here but not enough that they should be market moving.
Technical analysis
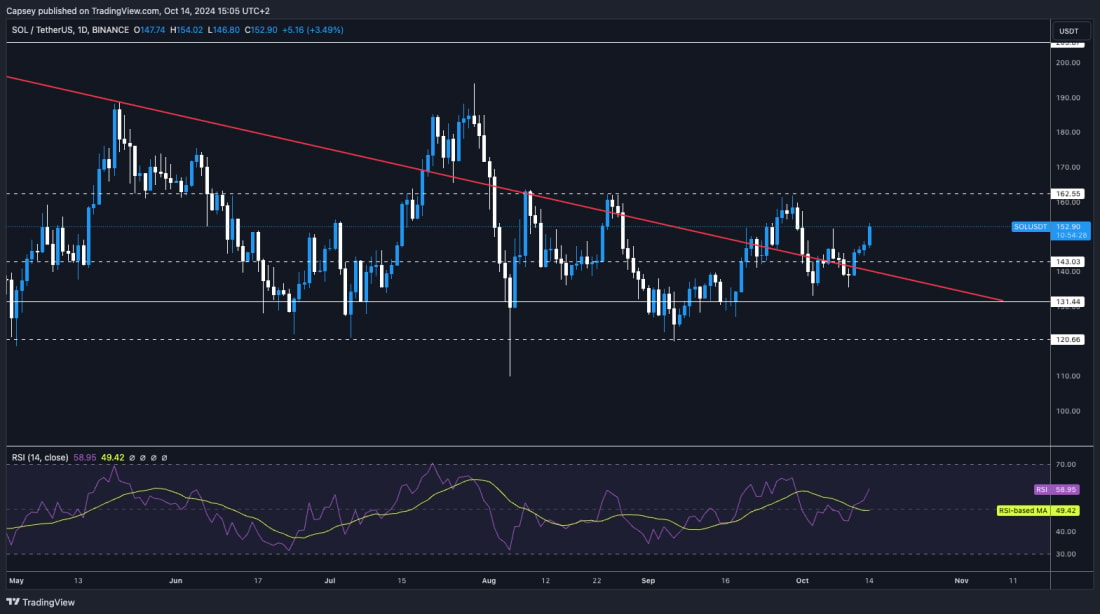
- Price has recovered back above the main downtrend line and it has now also more convincingly broken above the horizontal level of $143.
- On the upside, $162 remains the key horizontal resistance from which the price can break out. A breakout of $162 would most likely ignite full bull mode.
- To the downside, there are a lot of supports, with the local horizontal support at $143 and the main support at $131.
- SOL's RSI expectedly remains in the middle territory and not yet close to overbought territory.
- Next Support: $143
- Next Resistance: $162
- Direction: Neutral/Bullish
- Upside Target: $162
- Downside Target: $143
Cryptonary's take
It's possible that SOL can continue to grind higher over the coming days and retest $162. However, we're unsure that there will be enough strength in the short-term for price to comfortably clear above $162. We therefore expect price to be range bound between $143 and $162 this week. More of the same really.WIF:
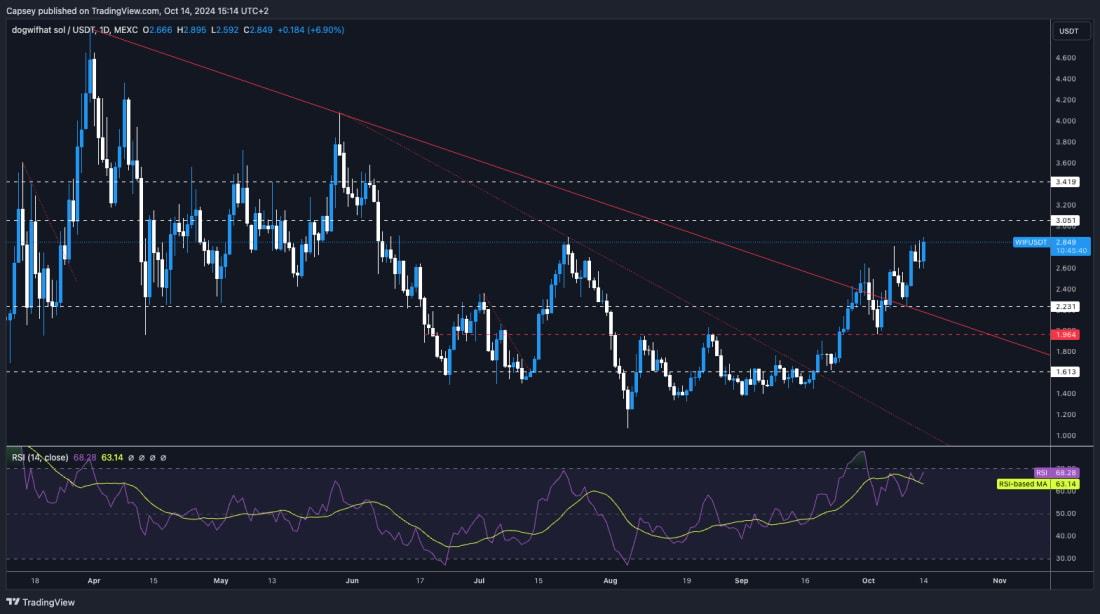
- As we expected and put in our last few updates, WIF looks really great and is continuing its grind higher than we expect to reach $3.05.
- $3.05 is a horizontal resistance, so it's possible to price short-term stalls out around there.
- Beyond $3.05, $3.40 is the next key level. If the price can get a clean break above $3.40, we'd expect the price to reach all-time highs relatively swiftly after.
- To the downside, $2.20 is the key level and the level we expect will be strong support for price, if price is to retest that low again.
- The RSI is close to being overbought in the daily timeframe, and it has put in multiple bearish divergences, so this might be the one sign suggesting some caution.
- Next Support: $2.20
- Next Resistance: $3.05
- Direction: Bullish
- Upside Target: $3.05 - $3.40
- Downside Target: $2.20
Cryptonary's take
So far, this is a really clean play from our calls on WIF over the last few weeks, with our $1.50- $1.80 Spot buys now being well in profit. The price has pushed higher, and we expect it to reach $3.05 in the coming week before cooling out slightly in the short term, but it will likely be just a consolidation rather than a major pullback. There are bearish divergences built up, which is something to be mindful of. However, we see this as being enough to stall the current momentum that WIF is seeing.POPCAT:
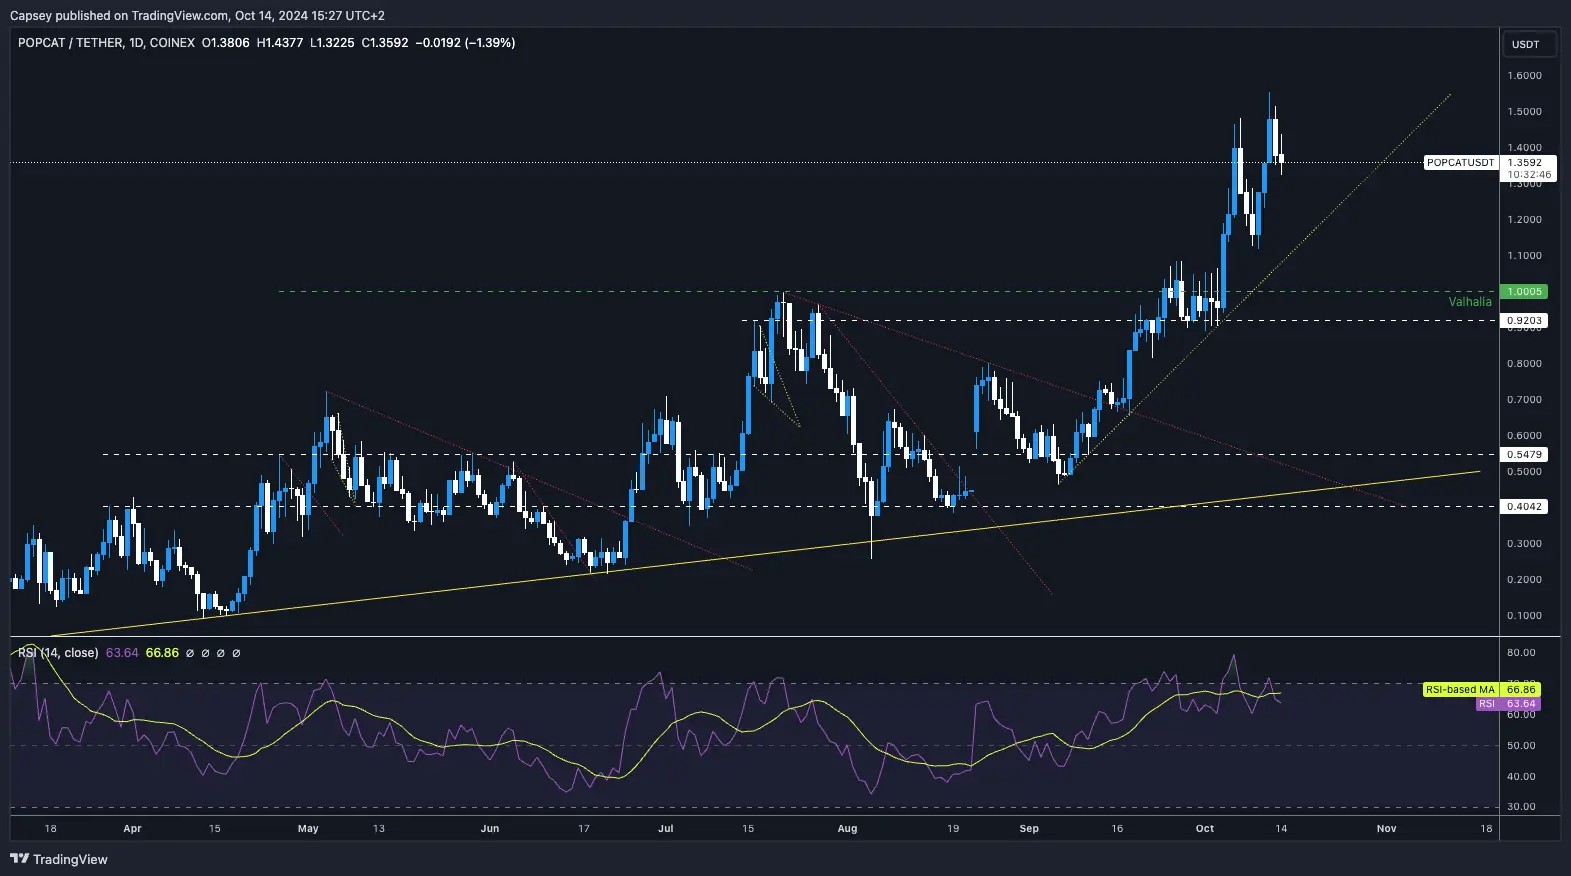
- A really nice bounce that ended up generating a new price all-time high.
- What really stands out to us here is that we have a new price high, yet a lower high on the RSI (bearish divergence) and in overbought territory. Historically, this has a good track record for a more meaningful pullback.
- Price is in an uptrend and the $1.00 to $1.10 area should be strong support for price, so we'd expect price to hold this range.
- To the upside, $1.50 is the horizontal resistance.
- Next Support: $1.00 - $1.10
- Next Resistance: $1.50
- Direction: Bearish
- Upside Target: $1.50
- Downside Target: $1.10
Cryptonary's take
Charting-wise, the above is pretty simple and clear-cut. The bearish divergence in overbought territory at new all-time highs is usually a good recipe for a more substantial pullback. The hope here is that strong overall market momentum may help prevent a pullback or at least limit its downside.We wouldn't be surprised to see POPCAT pull back to $1.10 if BTC were to pull back and retest $62k to $63k. We're not hugely confident in this outlook because of the current strong market dynamic, but we're reading off what the charts are telling us. Let's see.
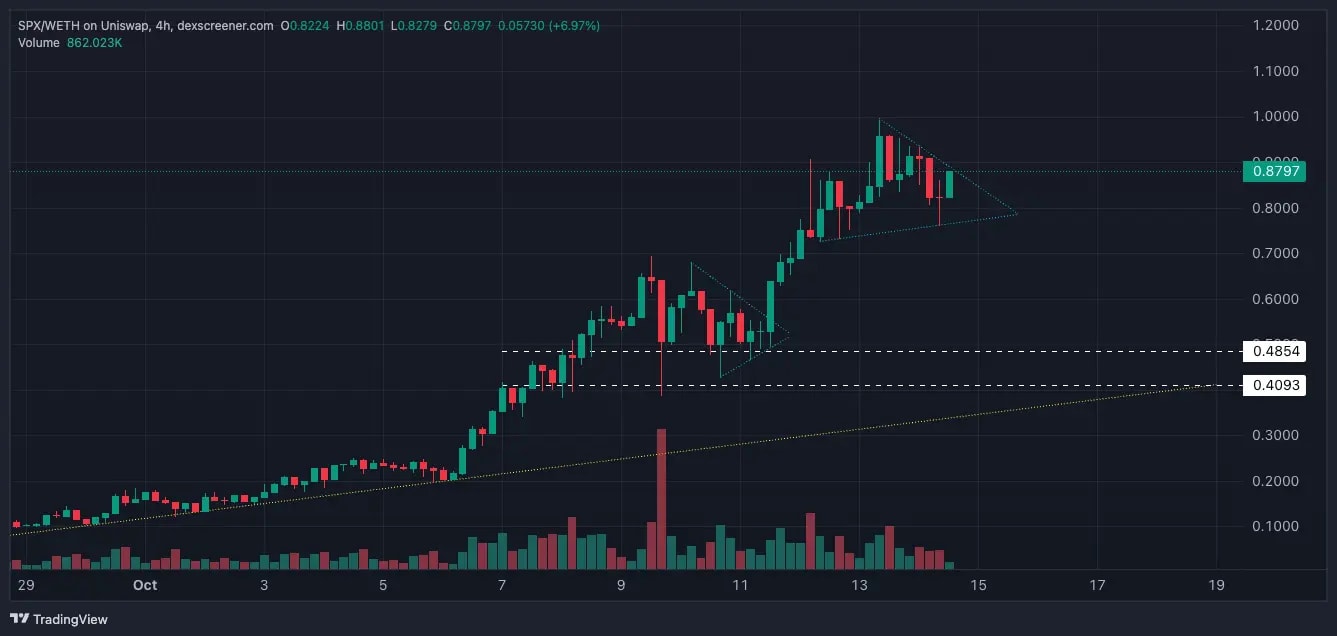
SPX:
- Note this is a 4-hour timeframe chart.
- SPX is setting up the same pattern as what we reported at the back end of last week, and then we saw the price break higher. Perfectly called.
- Price is now forming that pattern, a bullish pennant that has a bullish bias. Break-out targets would be $1.10 to $1.20. However, the $1b MCap level will be a key psychological level to pass.
- To the downside, the mid $0.70's would be support. It's possible that if price does pull back more substantially, this area is strongly bidded.
- We are seeing declining volumes which may indicate that momentum is at the beginning stages of fading in the short-term for SPX.
- Next Support: $0.70
- Next Resistance: $1.00
- Direction: Neutral/Bullish
- Upside Target: $1.10 - $1.20
- Downside Target: $0.70
Cryptonary's take
It's possible that SPX has a more meaningful correction at some point, but so far, the move has been phenomenally strong, with 20-30% corrections swiftly bought up. If we're right and the market is moving into a more bullish regime, then we'd expect a continuation of these more shallow pullbacks. If the price can break out of the pennant, then SPX could be well north of a $1b MCap before the weekend is here. Overall, it's a super hard one to call here, though.Recommended from Cryptonary


