Save 23% ($351) & Get a Free 1-1 Call with our Team ⏰ : 0d 2h 59m 43s
Altcoin shakeout: JUP, LINK, TRX, SUI moves
As the altcoin market struggles, JUP stands strong while Chainlink, Tron, and SUI fight to hold key levels. With TOTAL3 nearing lower lows, will altcoins recover, or is there more downside ahead? Let’s break down the latest market moves.

Disclaimer: This is not financial or investment advice. You are responsible for any capital-related decisions you make, and only you are accountable for the results.
JUP:
Market context
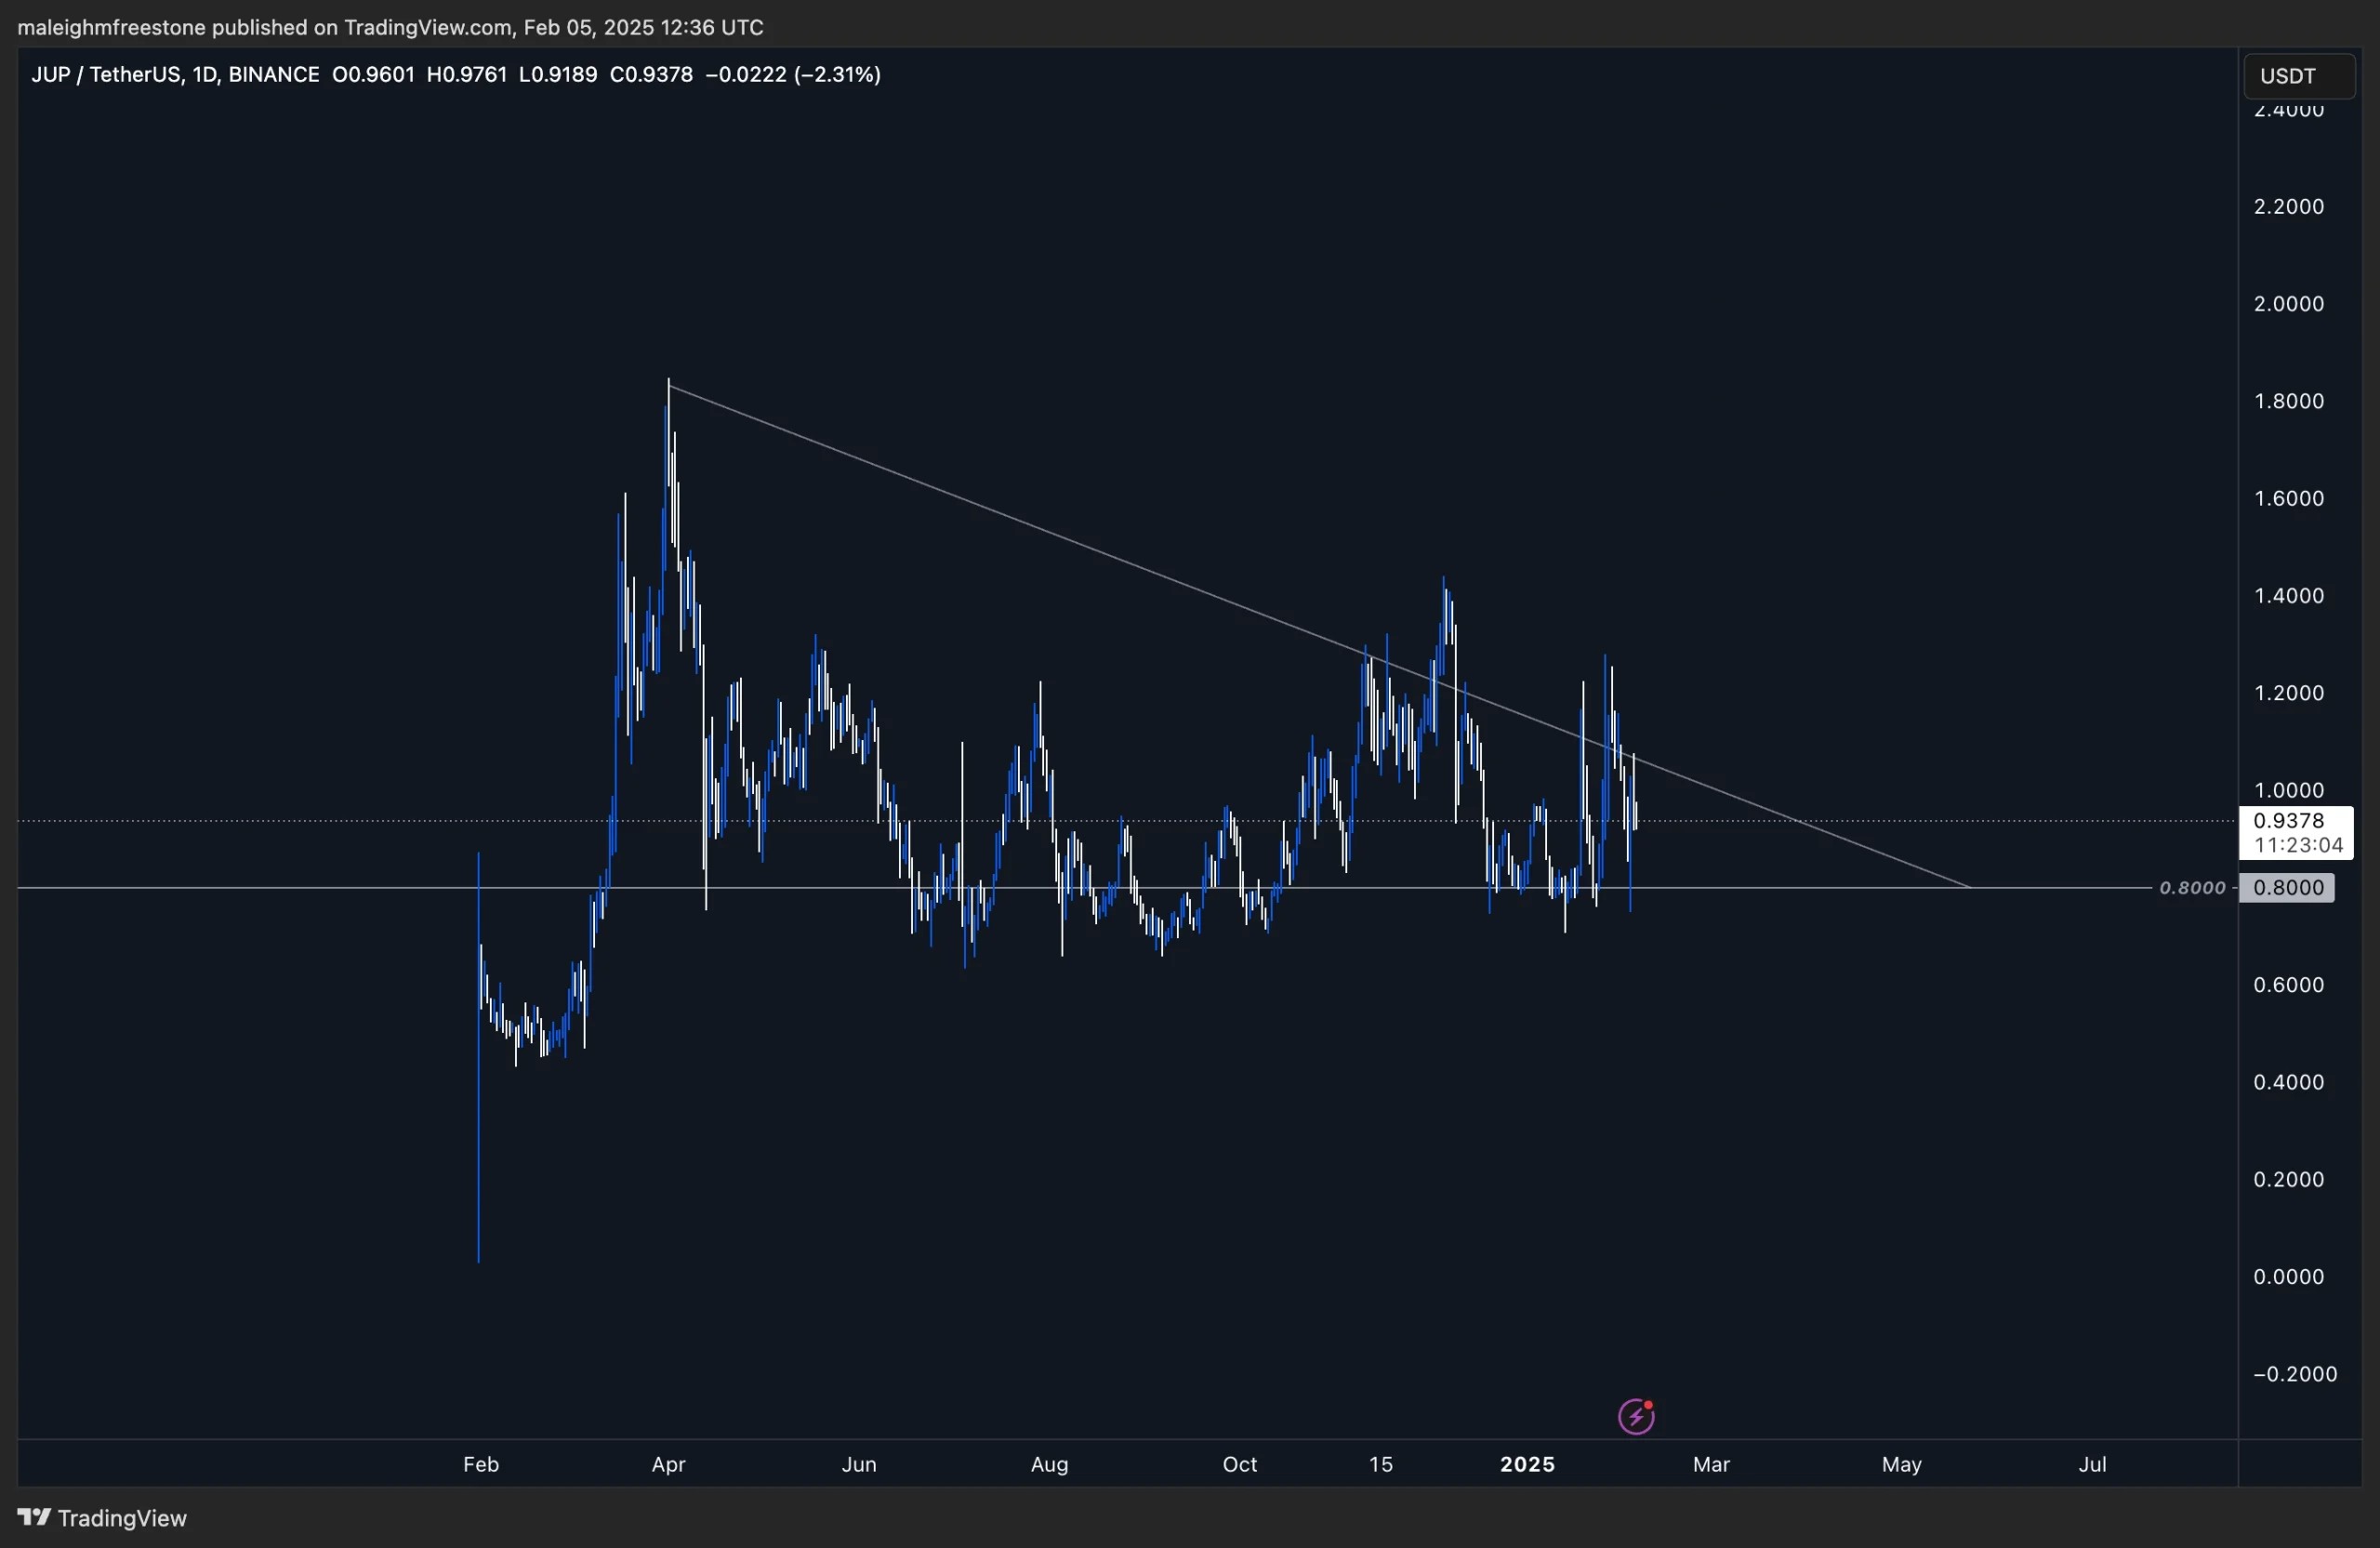
The broader altcoin market, represented by TOTAL3, has shown significant weakness after breaking structure and losing the critical $1 trillion level. This breakdown has created downward pressure across altcoins, with TOTAL3 nearly forming a lower low.Jupiter (JUP), however, has stood out by consolidating and remaining flat rather than following the broader market decline. This relative strength, in the face of a weak market, is noteworthy and suggests resilience.

Price action & technical analysis
JUP’s price action has been defined by tight consolidation since March, forming a wedge structure that suggests a buildup of pressure for a potential breakout.The key dynamics in play are:
- Lower Highs and Flat Support: Sellers are stepping down, creating lower highs, while buyers consistently defend the $0.80 support level. This creates a pivotal standoff where buy-side pressure is absorbing sell-side supply.
Key levels
- Support: ~$0.80 remains the critical level to hold, having been historically respected.
- Breakout level: A move above $1.00 would signal bullish confirmation and open the door for renewed momentum.
Fundamental & narrative drivers
JUP’s fundamentals align well with its technical positioning:- Airdrop completion: With most airdrops distributed, sell pressure from claimers is diminishing. This shift in dynamics often marks a sentiment change as remaining holders engage more actively in trading the token.
- Potential narrative boost: If broader market conditions stabilize, JUP’s extended consolidation could serve as a launchpad for a significant move, especially as attention returns to resilient altcoins.
Cryptonary’s take
JUP stands out as a resilient asset in a weak market. Its flat support at $0.80, combined with lower highs, sets the stage for a potential breakout. The longer this consolidation continues, the more aggressive the eventual move is likely to be.Key levels to watch:
- $0.80: Critical support—holding this level keeps the bullish setup intact.
- $1.00: A break above this level would confirm bullish momentum and signal the start of a new trend.
Chainlink ($LINK):
Overview
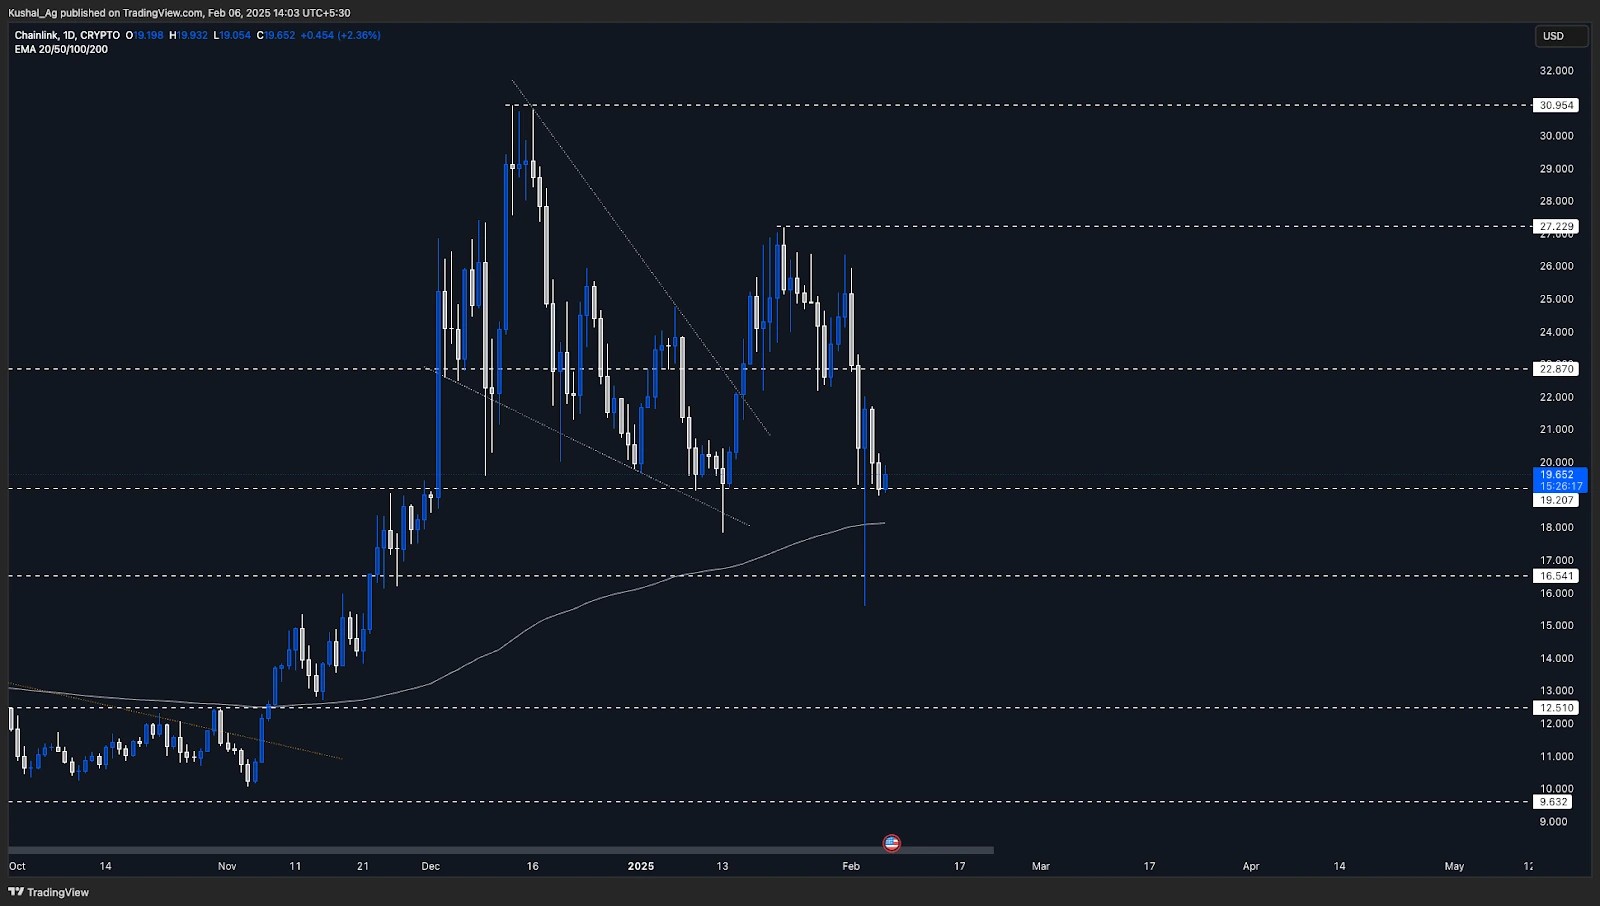
Chainlink ($LINK) has pulled back with the broader altcoin market, while Bitcoin continues to range within its higher timeframe consolidation. After breaking out from its wedge-like structure in mid-January, LINK surged to $27.2 before facing a 44% retracement, wiping out several support levels in the process.LINK is currently attempting to hold support at $19.2, with its recent wick reaching as low as $15.65. The 200 EMA on the daily time frame, currently at $18.14, has acted as a strong support level, contributing to the asset's recent stabilization.
Analysis & key levels
- Support zones:
- $19.2: Key level LINK is trying to hold.
- $18.14: 200 EMA - Daily time frame.
- $16.54: Support till which LINK wicked and also liquidated a little below it.
- Resistance zones:
- $22.87: The first major resistance level that must be reclaimed for a bullish shift.
- $27.22: The local high from mid-January, which previously acted as resistance.
- $30.95: The December 2024 high.
Potential scenarios
- Bullish case: If LINK holds above $19.2 and reclaims $22.87, we could see a move toward $27.22 in the short to medium term. Breaking above that could reignite bullish momentum for a potential move to the December highs.
- Bearish case: If LINK fails to hold $19.2 and loses the 200 EMA (~$18.14), there's a chance it could retest the $16.54 support zone. A further breakdown could extend losses toward lower-demand areas, depending on wider market conditions.
Cryptonary's take
Despite the market-wide shakeout, Chainlink has shown a decent bounce from key support levels and has made deep wicks, particularly at the 200 EMA and $16.54 region. While it remains range-bound, its ability to reclaim $22.87 and sustain above $19.2 will be critical in determining its next directional move.For now, LINK is in a consolidation phase, with the potential for both scenarios to play out depending on broader market sentiment. Holding these higher timeframe support levels and reclaiming resistances gradually will be key for LINK's next leg higher.
Tron ($TRX):
Overview
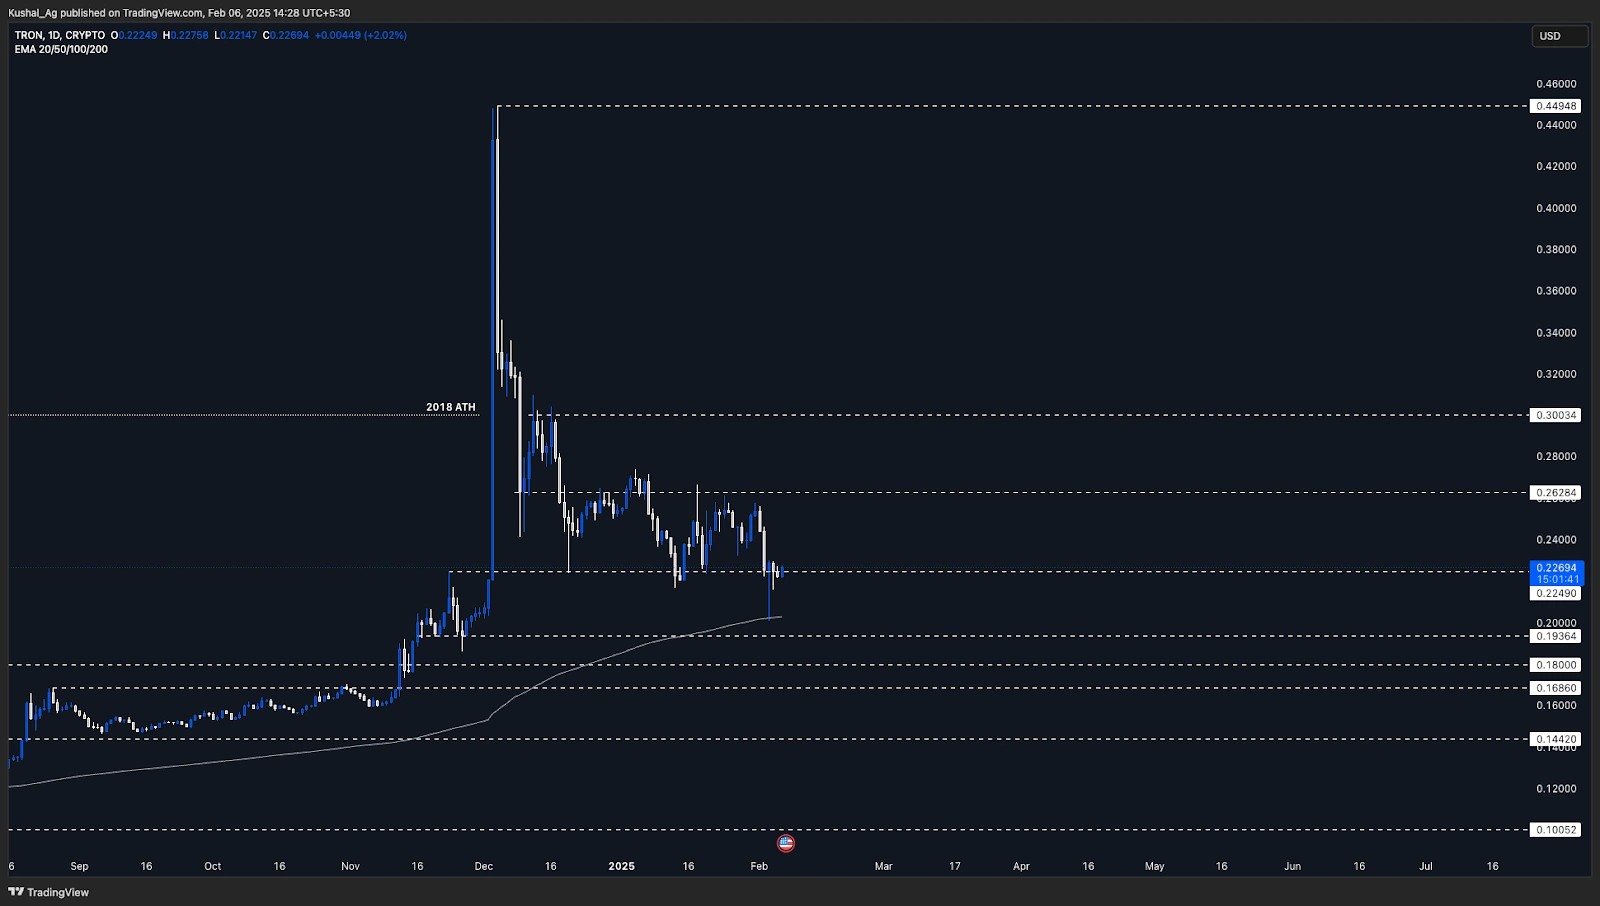
Tron ($TRX) has been range-bound between $0.262 on the top side and $0.224 on the bottom side for the past few weeks. Recently, it experienced a wick down to $0.20, aligning exactly with the 200 EMA on the daily time frame. Following this liquidity sweep, Tron reclaimed the range and is now trading at $0.226, sitting right at the bottom of this consolidation range.Analysis & key levels
- Support levels:
- $0.224: The bottom of the current range, where Tron is currently sitting.
- $0.20 : 200 EMA - Daily.
- $0.193 & $0.18: Deeper historical support levels.
- Resistance levels:
- $0.262: The top of the range, a key level Tron must break and hold above for any bullish continuation.
- $0.30: A major psychological level and a historical resistance zone, previously acting as Tron's 2021 high.
Potential scenarios
- Bullish case: If Tron holds above $0.224 and the wider market remains stable, it could range between $0.224 - $0.262 before attempting a breakout above $0.262. A successful reclaim could open doors to further upside movement toward $0.30.
- Bearish case: If Tron loses the $0.224 support, a retest of the 200 EMA (~$0.20) is likely. If this fails to hold, a deeper correction toward $0.193 or $0.18 could be on the table.
Cryptonary's take
Tron has proven its strength by recovering swiftly from the recent dip to the 200 EMA and reclaiming its range-bound structure. Holding above $0.224 is key for maintaining a neutral to bullish outlook, while a break below this level could bring lower supports into play.With Bitcoin's consolidation affecting altcoins, a neutral-to-bullish trend in the wider market could support Tron's continued range-bound movement before an eventual breakout attempt toward $0.262 and beyond.
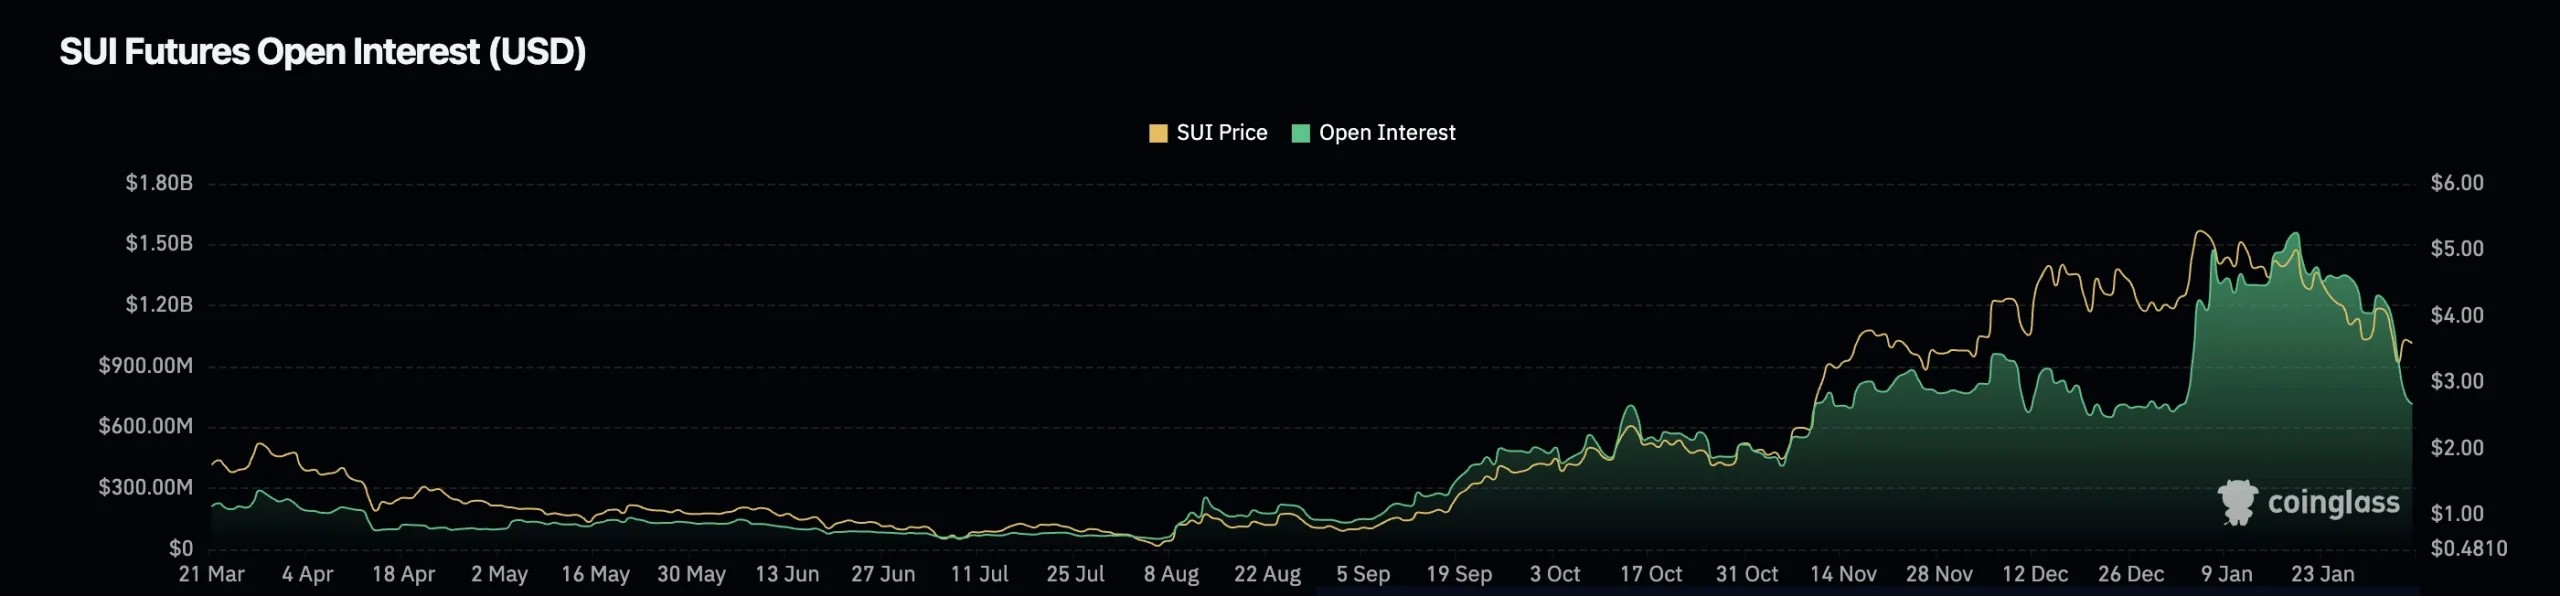
SUI:
Market context
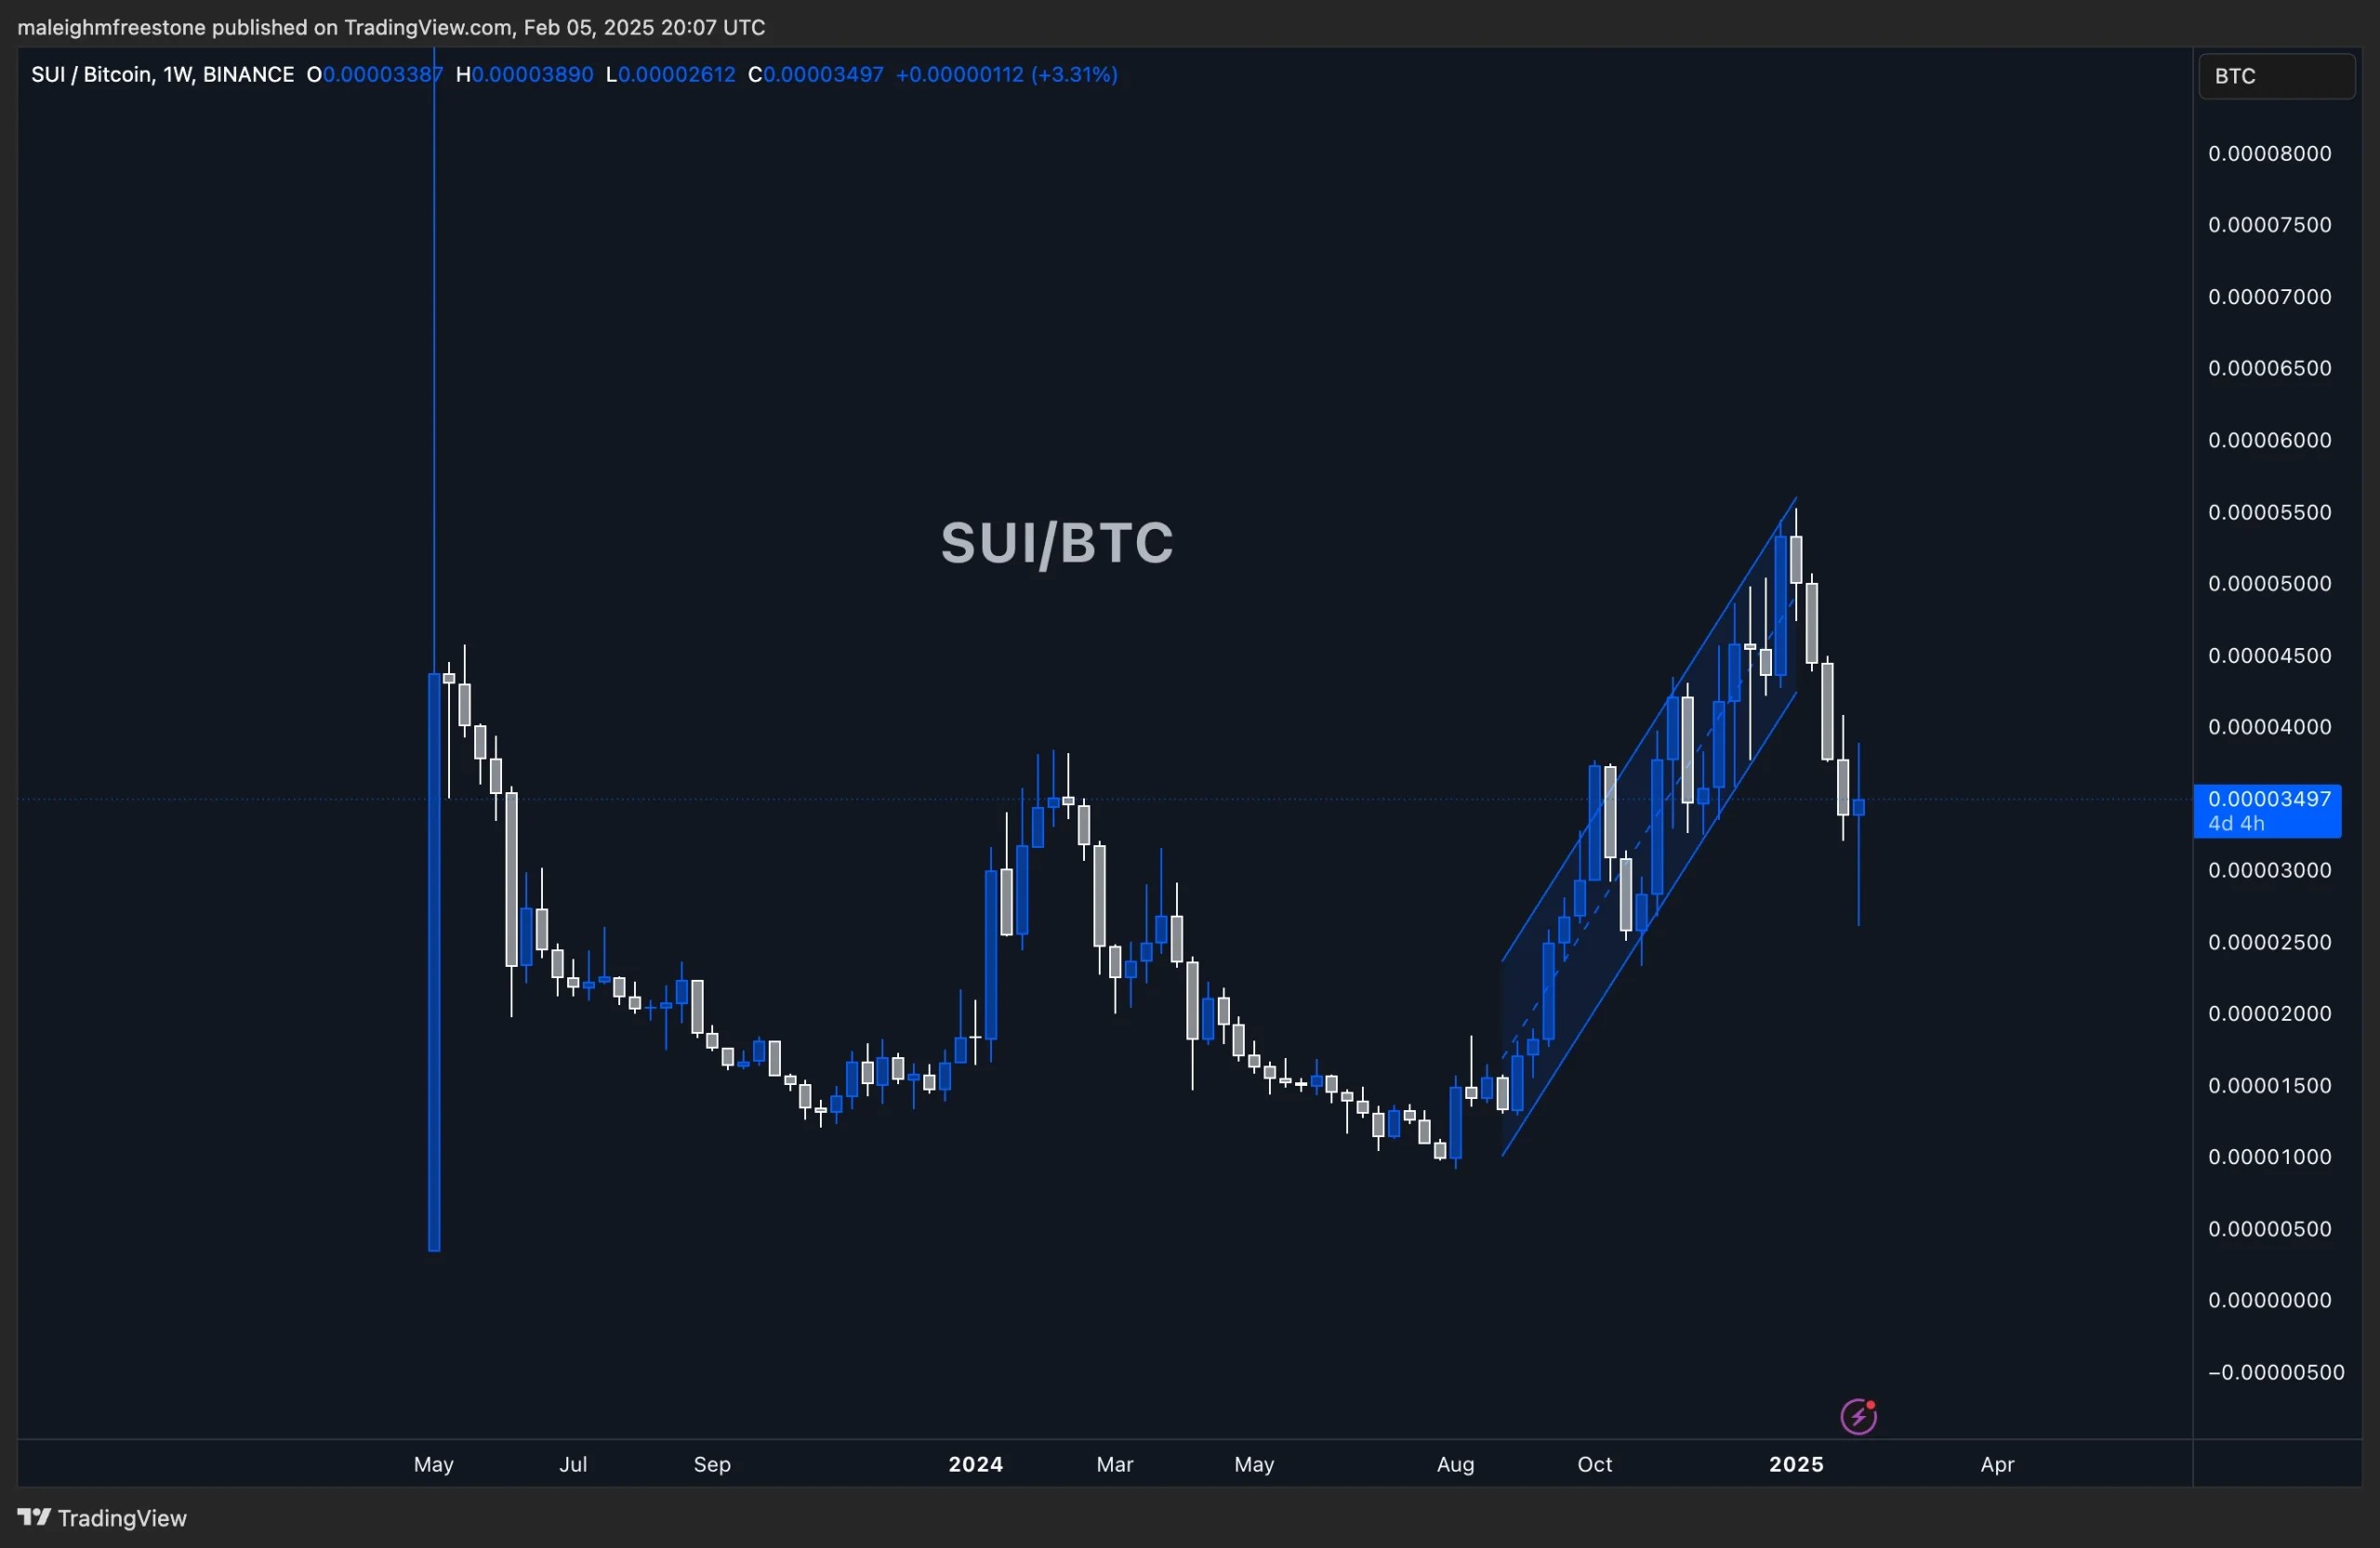
SUI has been one of the strongest assets in the market, running over 1,000% since August, moving from $0.50 to $5. Unlike most altcoins, it has actually been bullish against BTC since last year, making it one of the few assets to consistently outperform.Given how aggressive its move up was, this pullback is justified and even healthy for SUI, not other assets—it shakes out weak hands, generates new demand, and allows fresh market participants to step in. If we compare it to TOTAL3, SUI’s structure aligns quite closely, meaning broader altcoin weakness is a factor in this pullback.
Monthly chart analysis
Zooming out, this is really just a higher timeframe swing low forming. Pulling Fibonacci from August lows to the highs, SUI is trading into the 61.8% retracement, which is a textbook area for buyers to step in. The key zone is between $2.6 and $2.4, with $3 acting as a more conservative level if it doesn’t fully retrace.The daily chart already gave us a bullish hammer wick, meaning buyers have already shown interest here. If the price trades back into this range, it’s a prime accumulation area for anyone looking to build a position.

Market mechanics
Playbook
SUI at $2.6 to $2.4 is a buy zone, plain and simple. It aligns with the 61.8% Fib retracement, previous support, and the hammer wick reaction. If price sweeps that wick and fills it, that’s an even stronger buy opportunity. If you want to be conservative, $3 is an early entry option, but the real range for strong accumulation sits lower.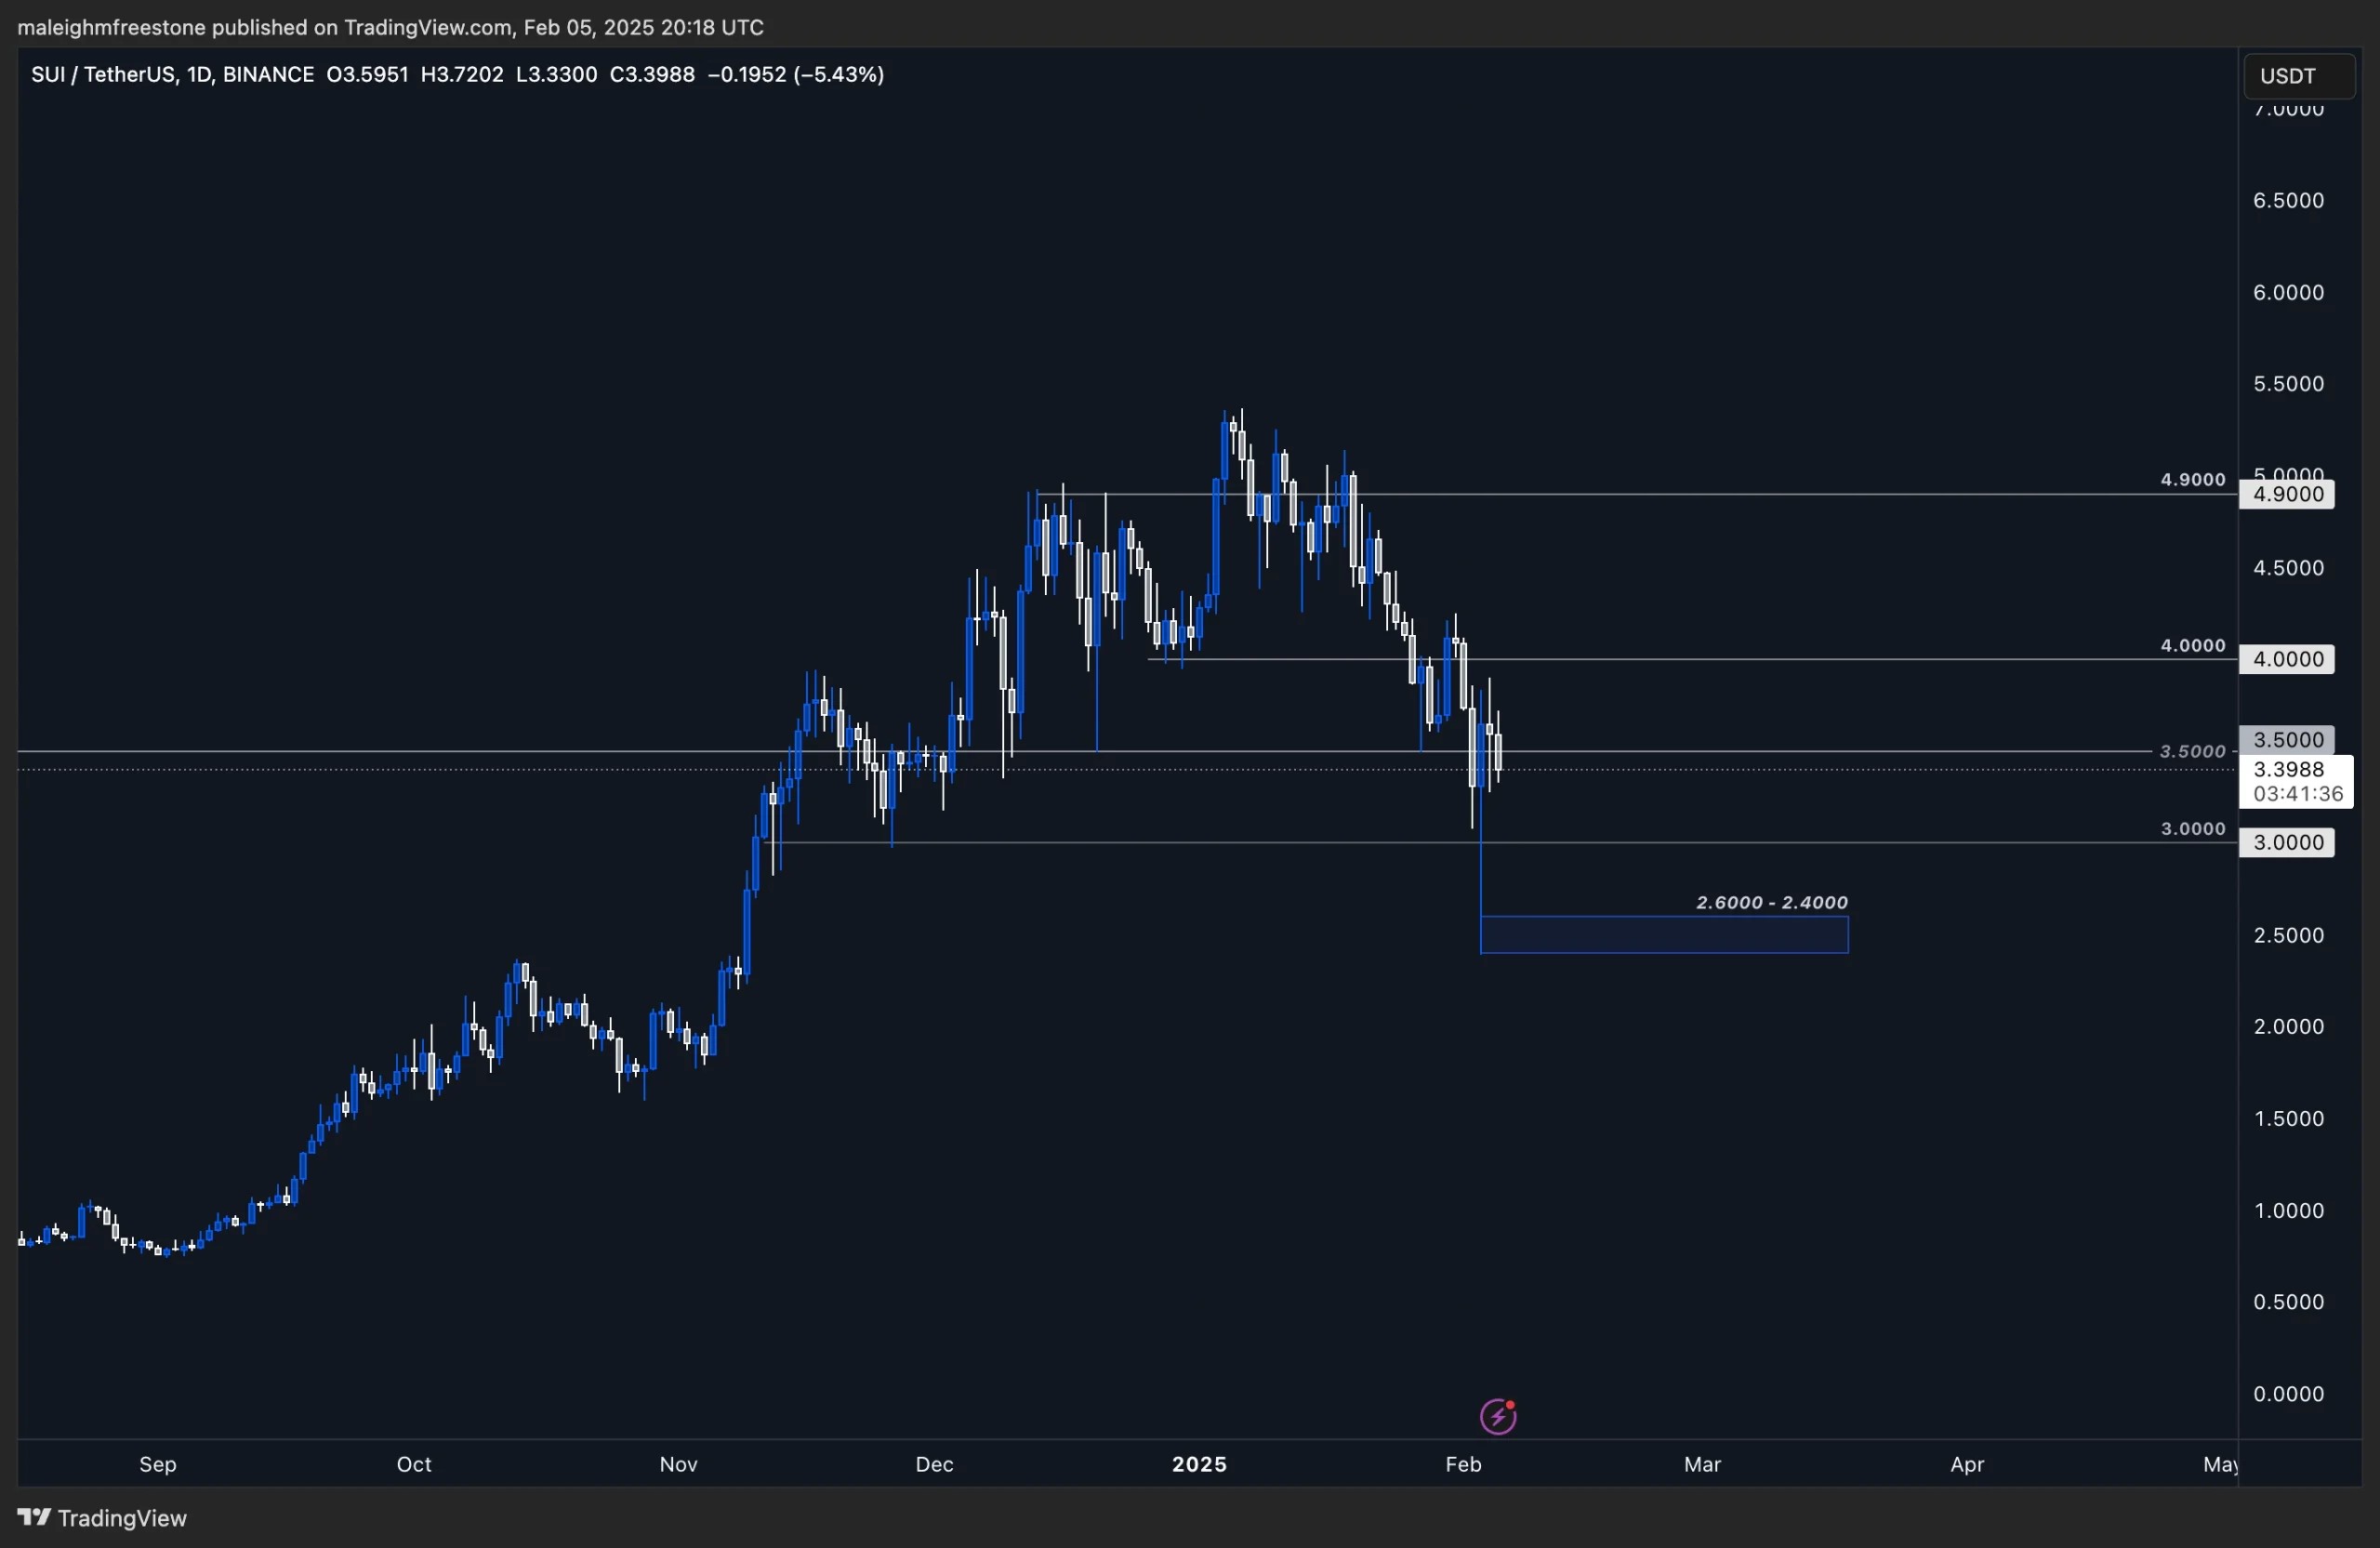
Cryptonary's take
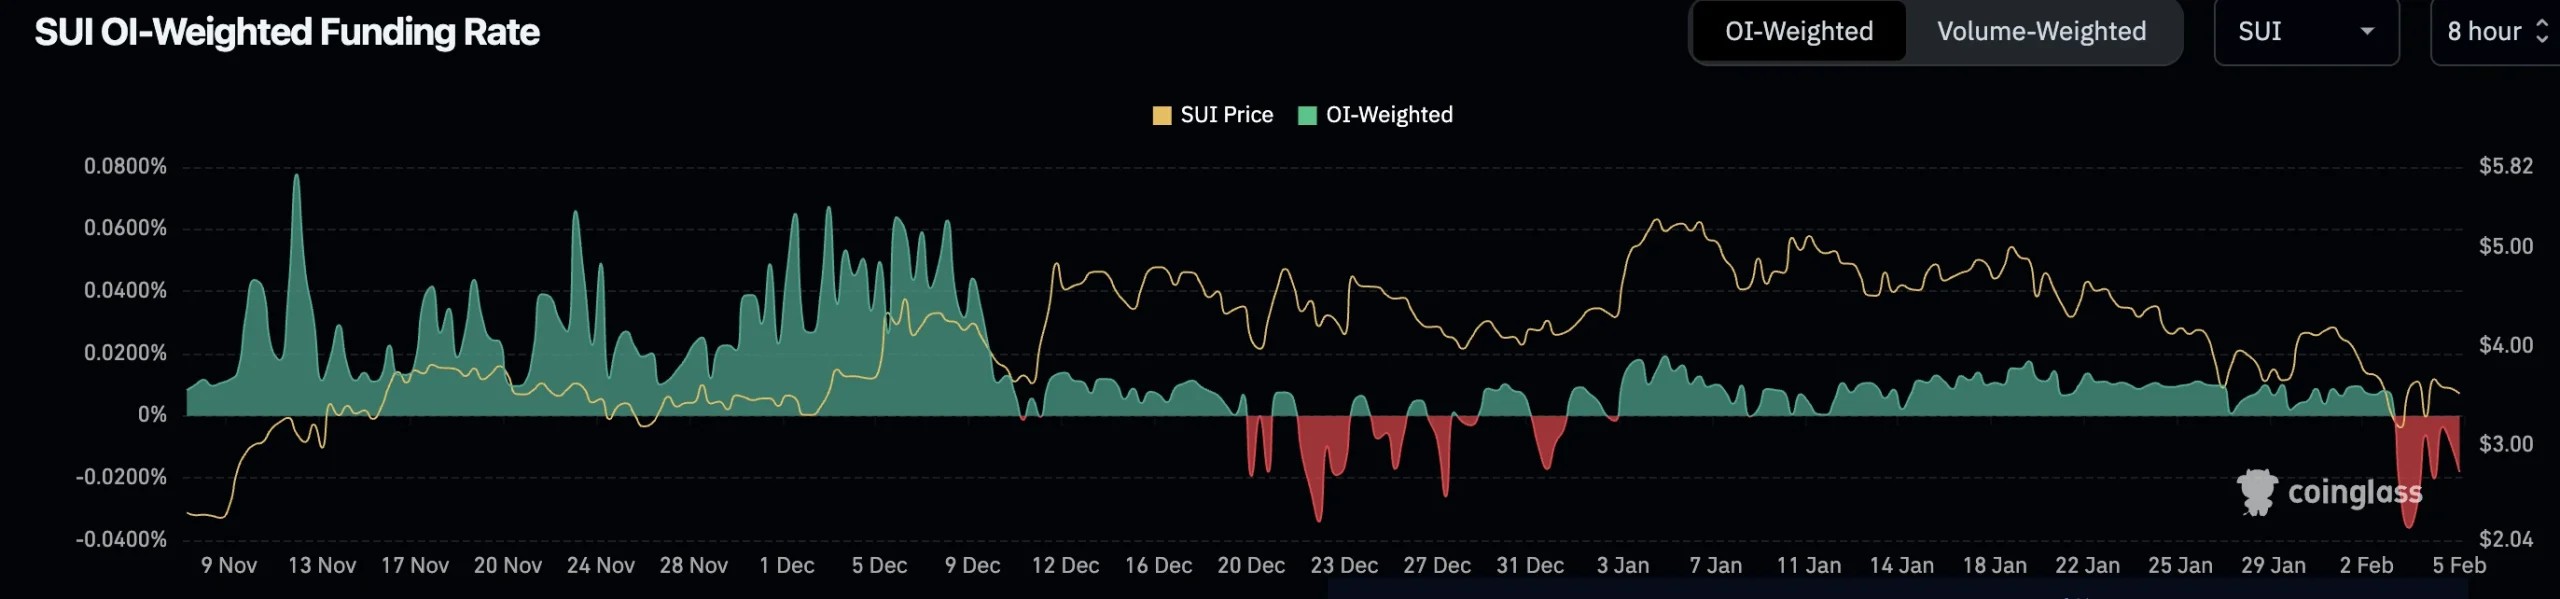
SUI is a top-tier performer that’s simply going through a necessary reset. Unlike most alts, it hasn’t broken market structure on the monthly, and this pullback fits perfectly within a bullish macro potential to generate a nice move higher if we get more upside sentiment. Leverage has been wiped, funding flipped negative, and we’ve already seen buyers defend this level once. If the price comes back down, it’s a high-conviction buying opportunity.Recommended from Cryptonary


