Save 23% ($351) & Get a Free 1-1 Call with our Team ⏰ : 0d 2h 59m 44s

Disclaimer: This is not financial or investment advice. You are responsible for any capital-related decisions you make, and only you are accountable for the results.
KASPA:
Market context
Kaspa (KASPA) recently made a notable move, wicking directly into the designated build box between $0.09 and $0.109, a level we outlined in the last analysis. This asset has shown a clear, higher timeframe bullish structure, demonstrating resilience compared to many other assets in this market cycle.
Playbook
Trend: KASPA has followed a strong trend of higher highs and higher lows since November 2023, maintaining a consistent bullish structure. This pattern includes key levels:- Higher high printed on November 13, 2023.
- Higher low on January 29, 2024.
- Followed by higher highs and lows in February, April, and July.
- The latest higher low was confirmed in October 2024, reinforcing the trend.
Price action
KASPA wicked into the build box, moving below the trendline level but reclaiming it with strength. This reaction indicates potential for continued upside and reinforces its structural strength.Key levels
Build Box: $0.09 - $0.109.- This range is identified as a strong support and a potential launch point for further bullish movement.
- Past moves from this range have led to decent gains.
- Given KASPA's stability, spot accumulation in the build box between $0.09 and $0.109 could be a low-risk entry.
- Leverage isn't recommended here due to the opportunity cost of building spot positions based on the overall market context and its potential to move around current sentiment.
Cryptonary's take
KASPA isn't currently in our CPRO picks, nor are we invested. However, its strength in maintaining a higher timeframe bullish structure is noteworthy, especially as it continues to respect each higher high and higher low. Holding within this structure gives it a solid foundation to break out if momentum returns to the cycle. This is one to watch closely for trend continuation as a strong player for the remainder of the cycle.AVAX:
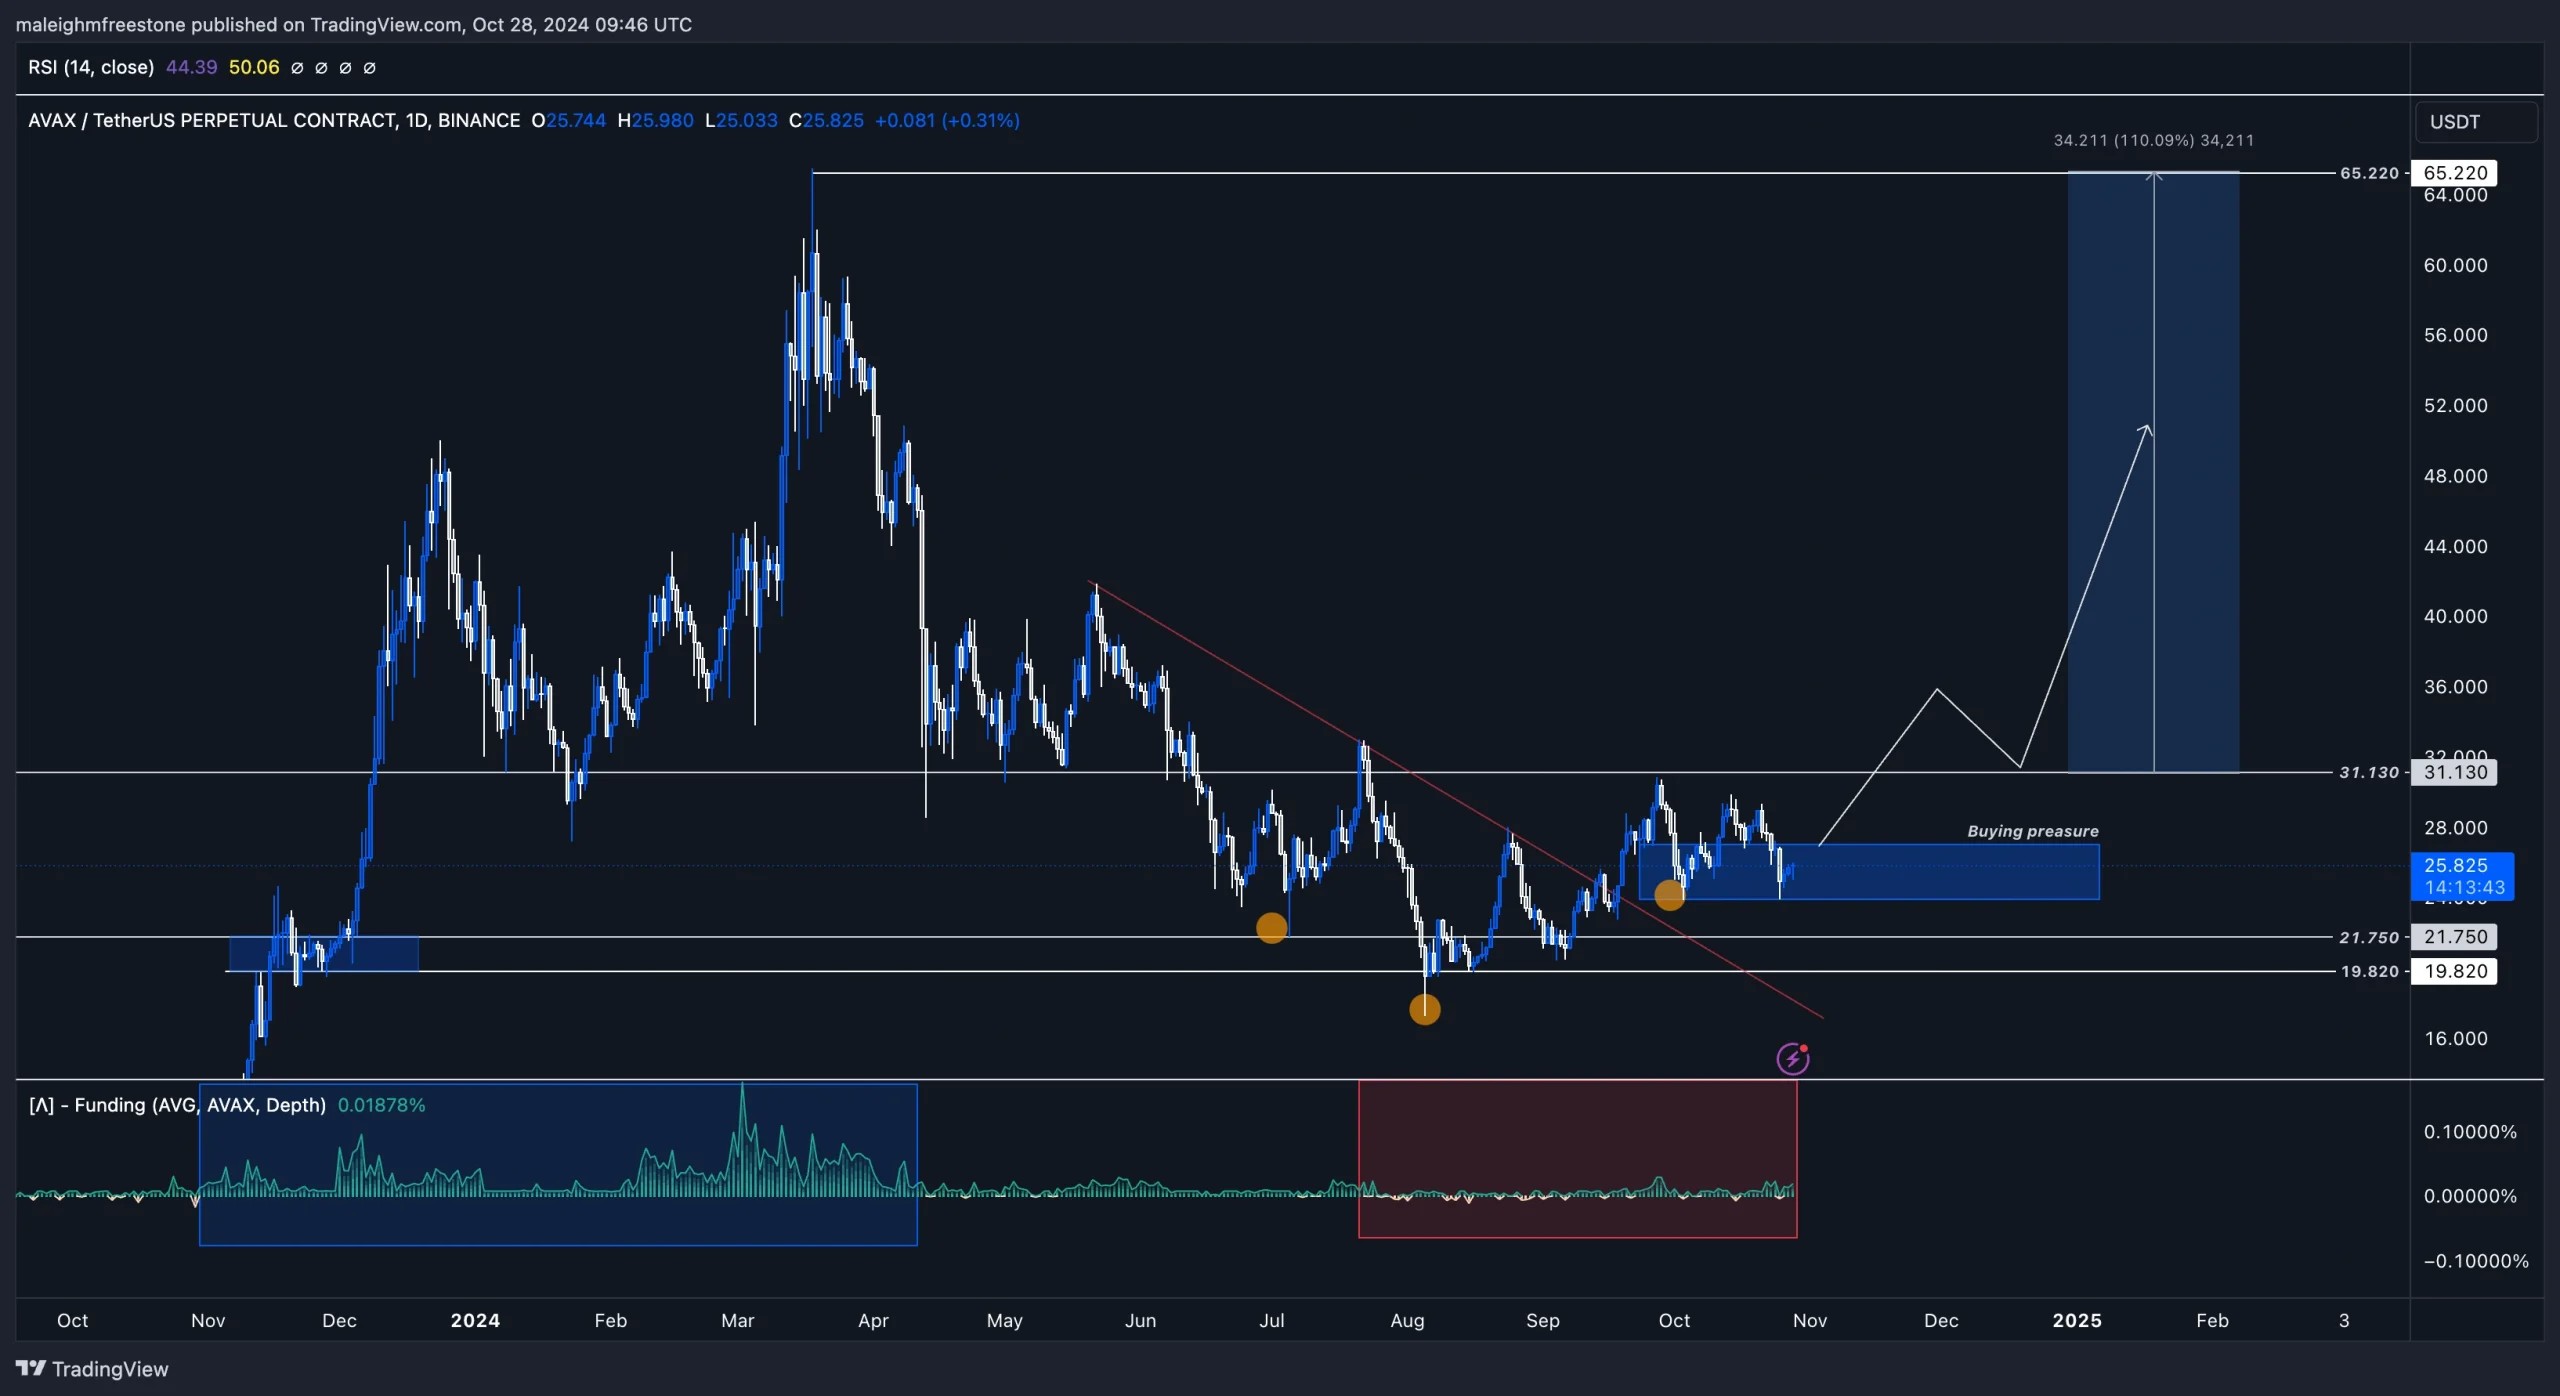
Market context
AVAX is showing strong signs of a potential bottoming formation with a clear inverted head and shoulders pattern forming. This aligns with areas where we've seen significant negative funding, particularly from July 22 onwards, suggesting a shift in sentiment as the price reached lows around $21.750 and $19.820.Historically, AVAX's price action has reacted to periods of negative funding by rallying higher, making this alignment a key indicator of a possible reversal. A rounded bottom structure is also observed, adding further conviction for a bullish move, especially as we consider Total3's similar pattern, indicating broader altcoin strength.
Market mechanics
Funding Rate: From November last year, funding has generally remained positive or near equilibrium, indicating sustained interest in longs. However, from April 2024, a bearish trend emerged in funding, intensifying into significant negative levels by July 22. This shift in funding sentiment corresponds with the recent lows and strengthens the argument for a potential bottom in AVAX.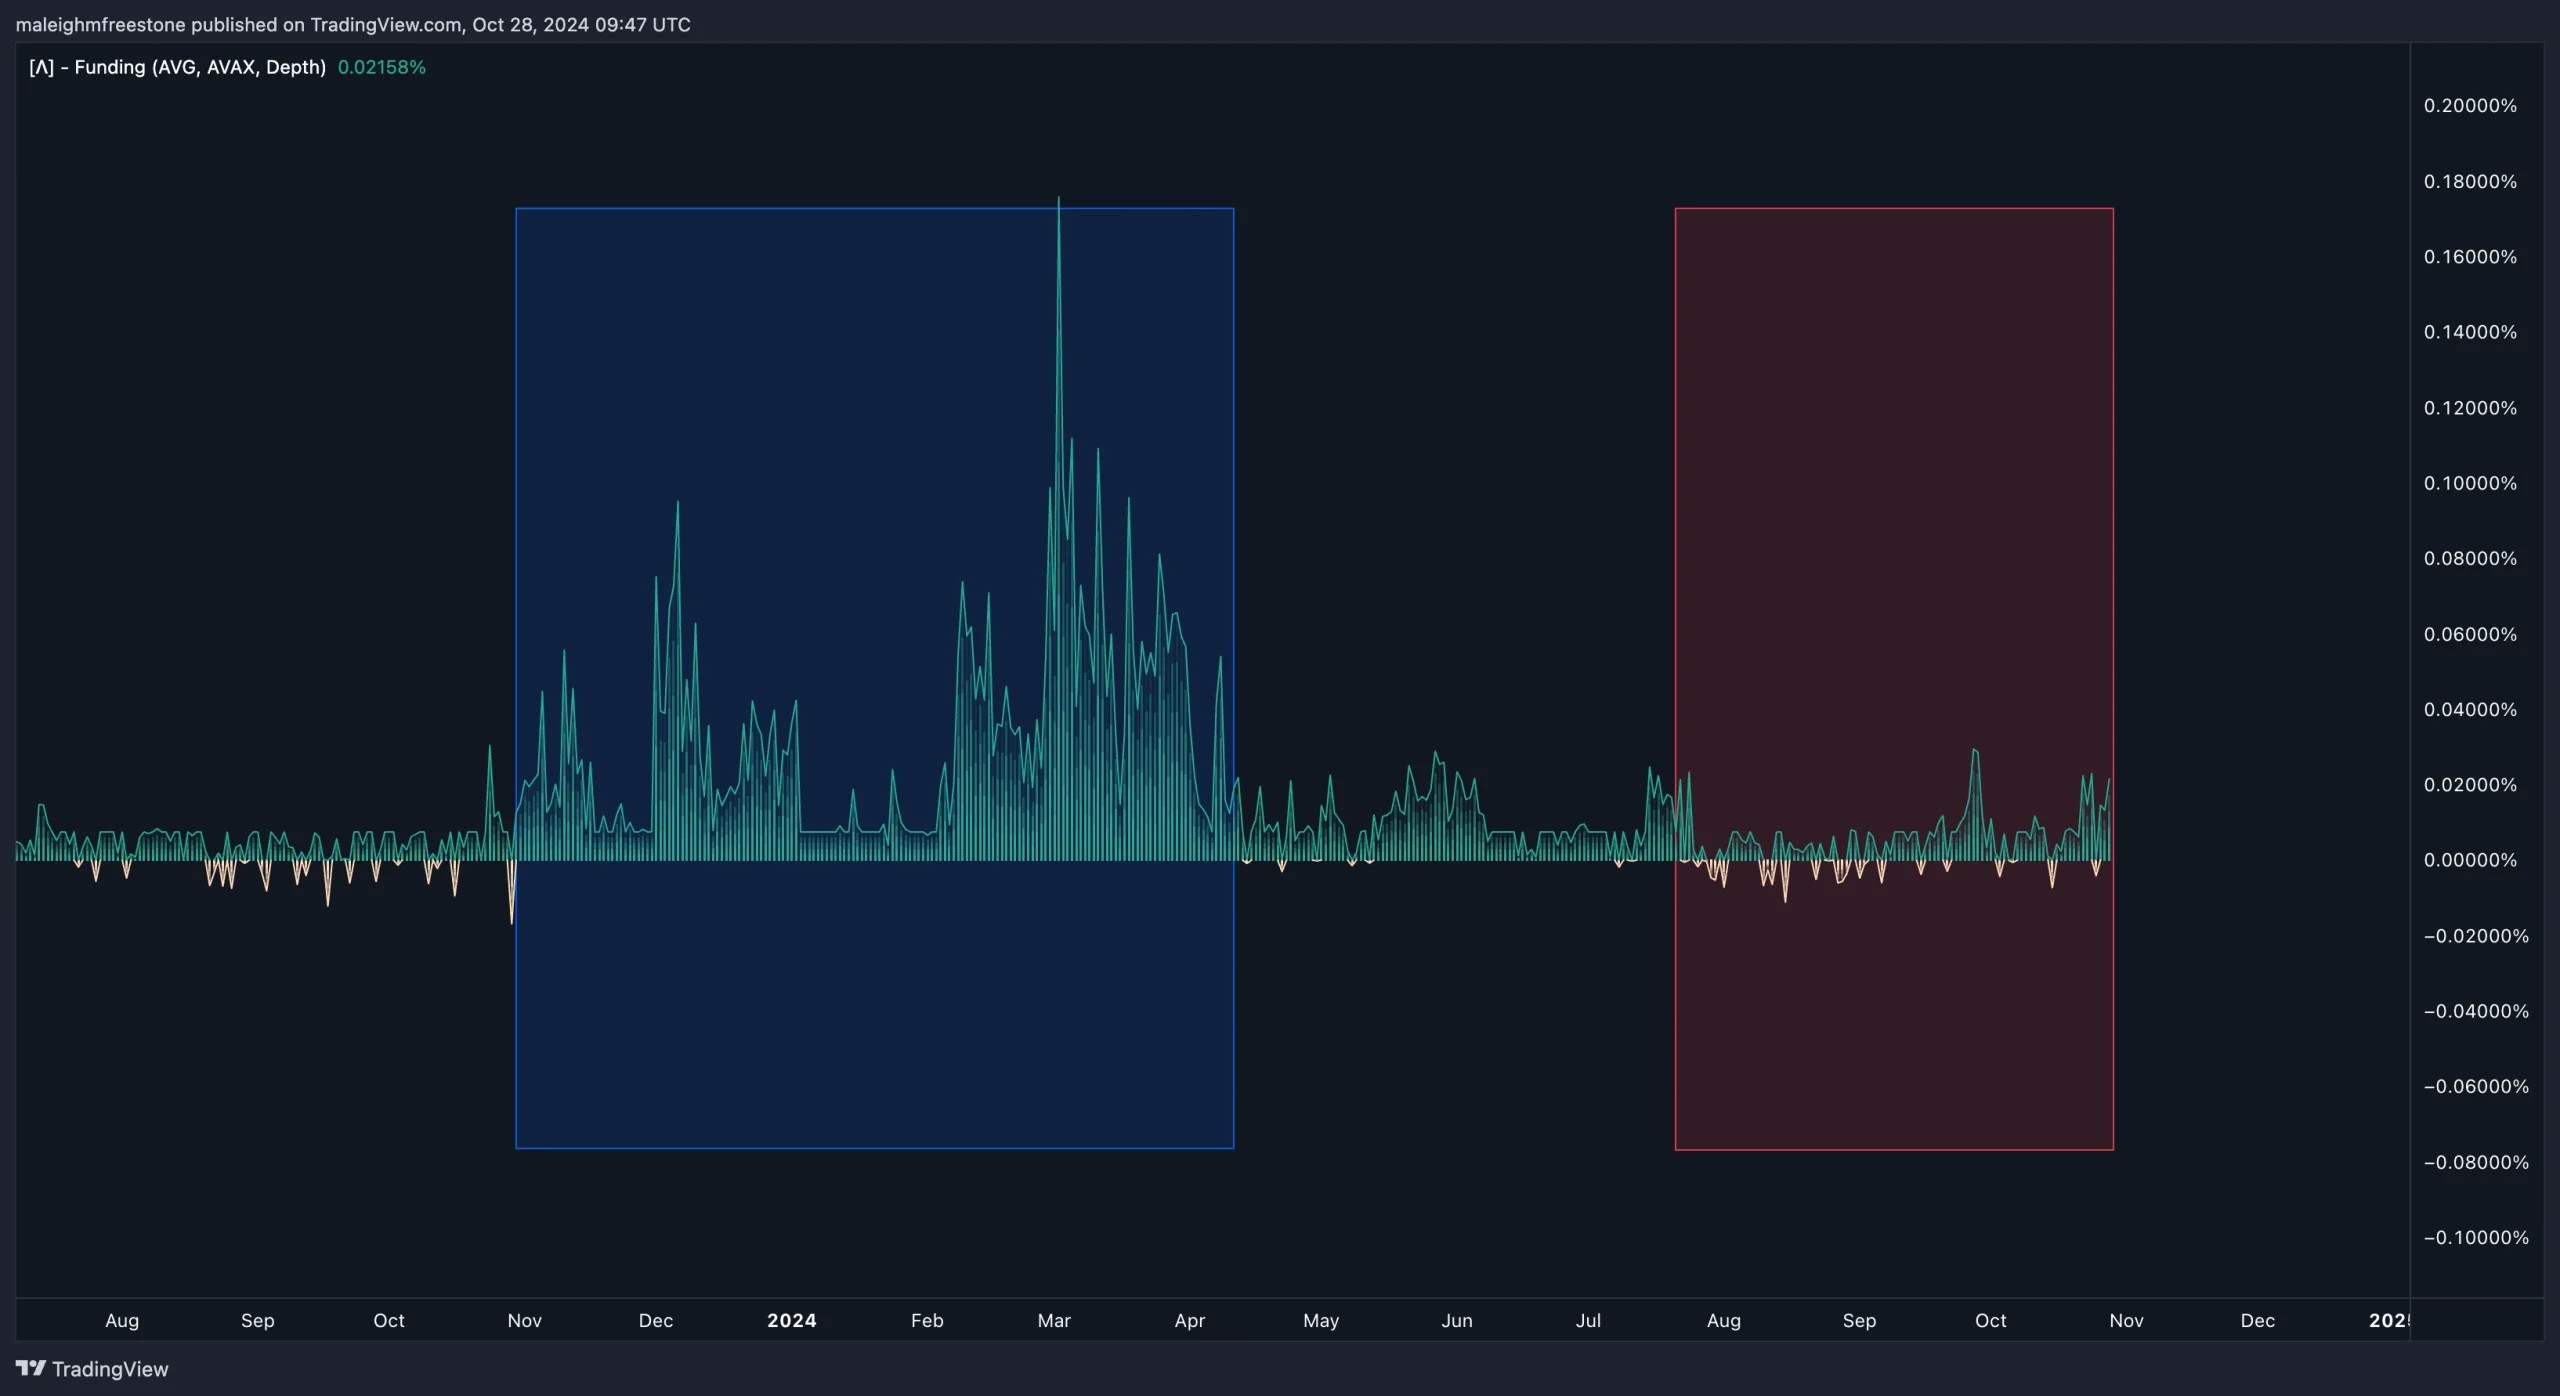
Playbook
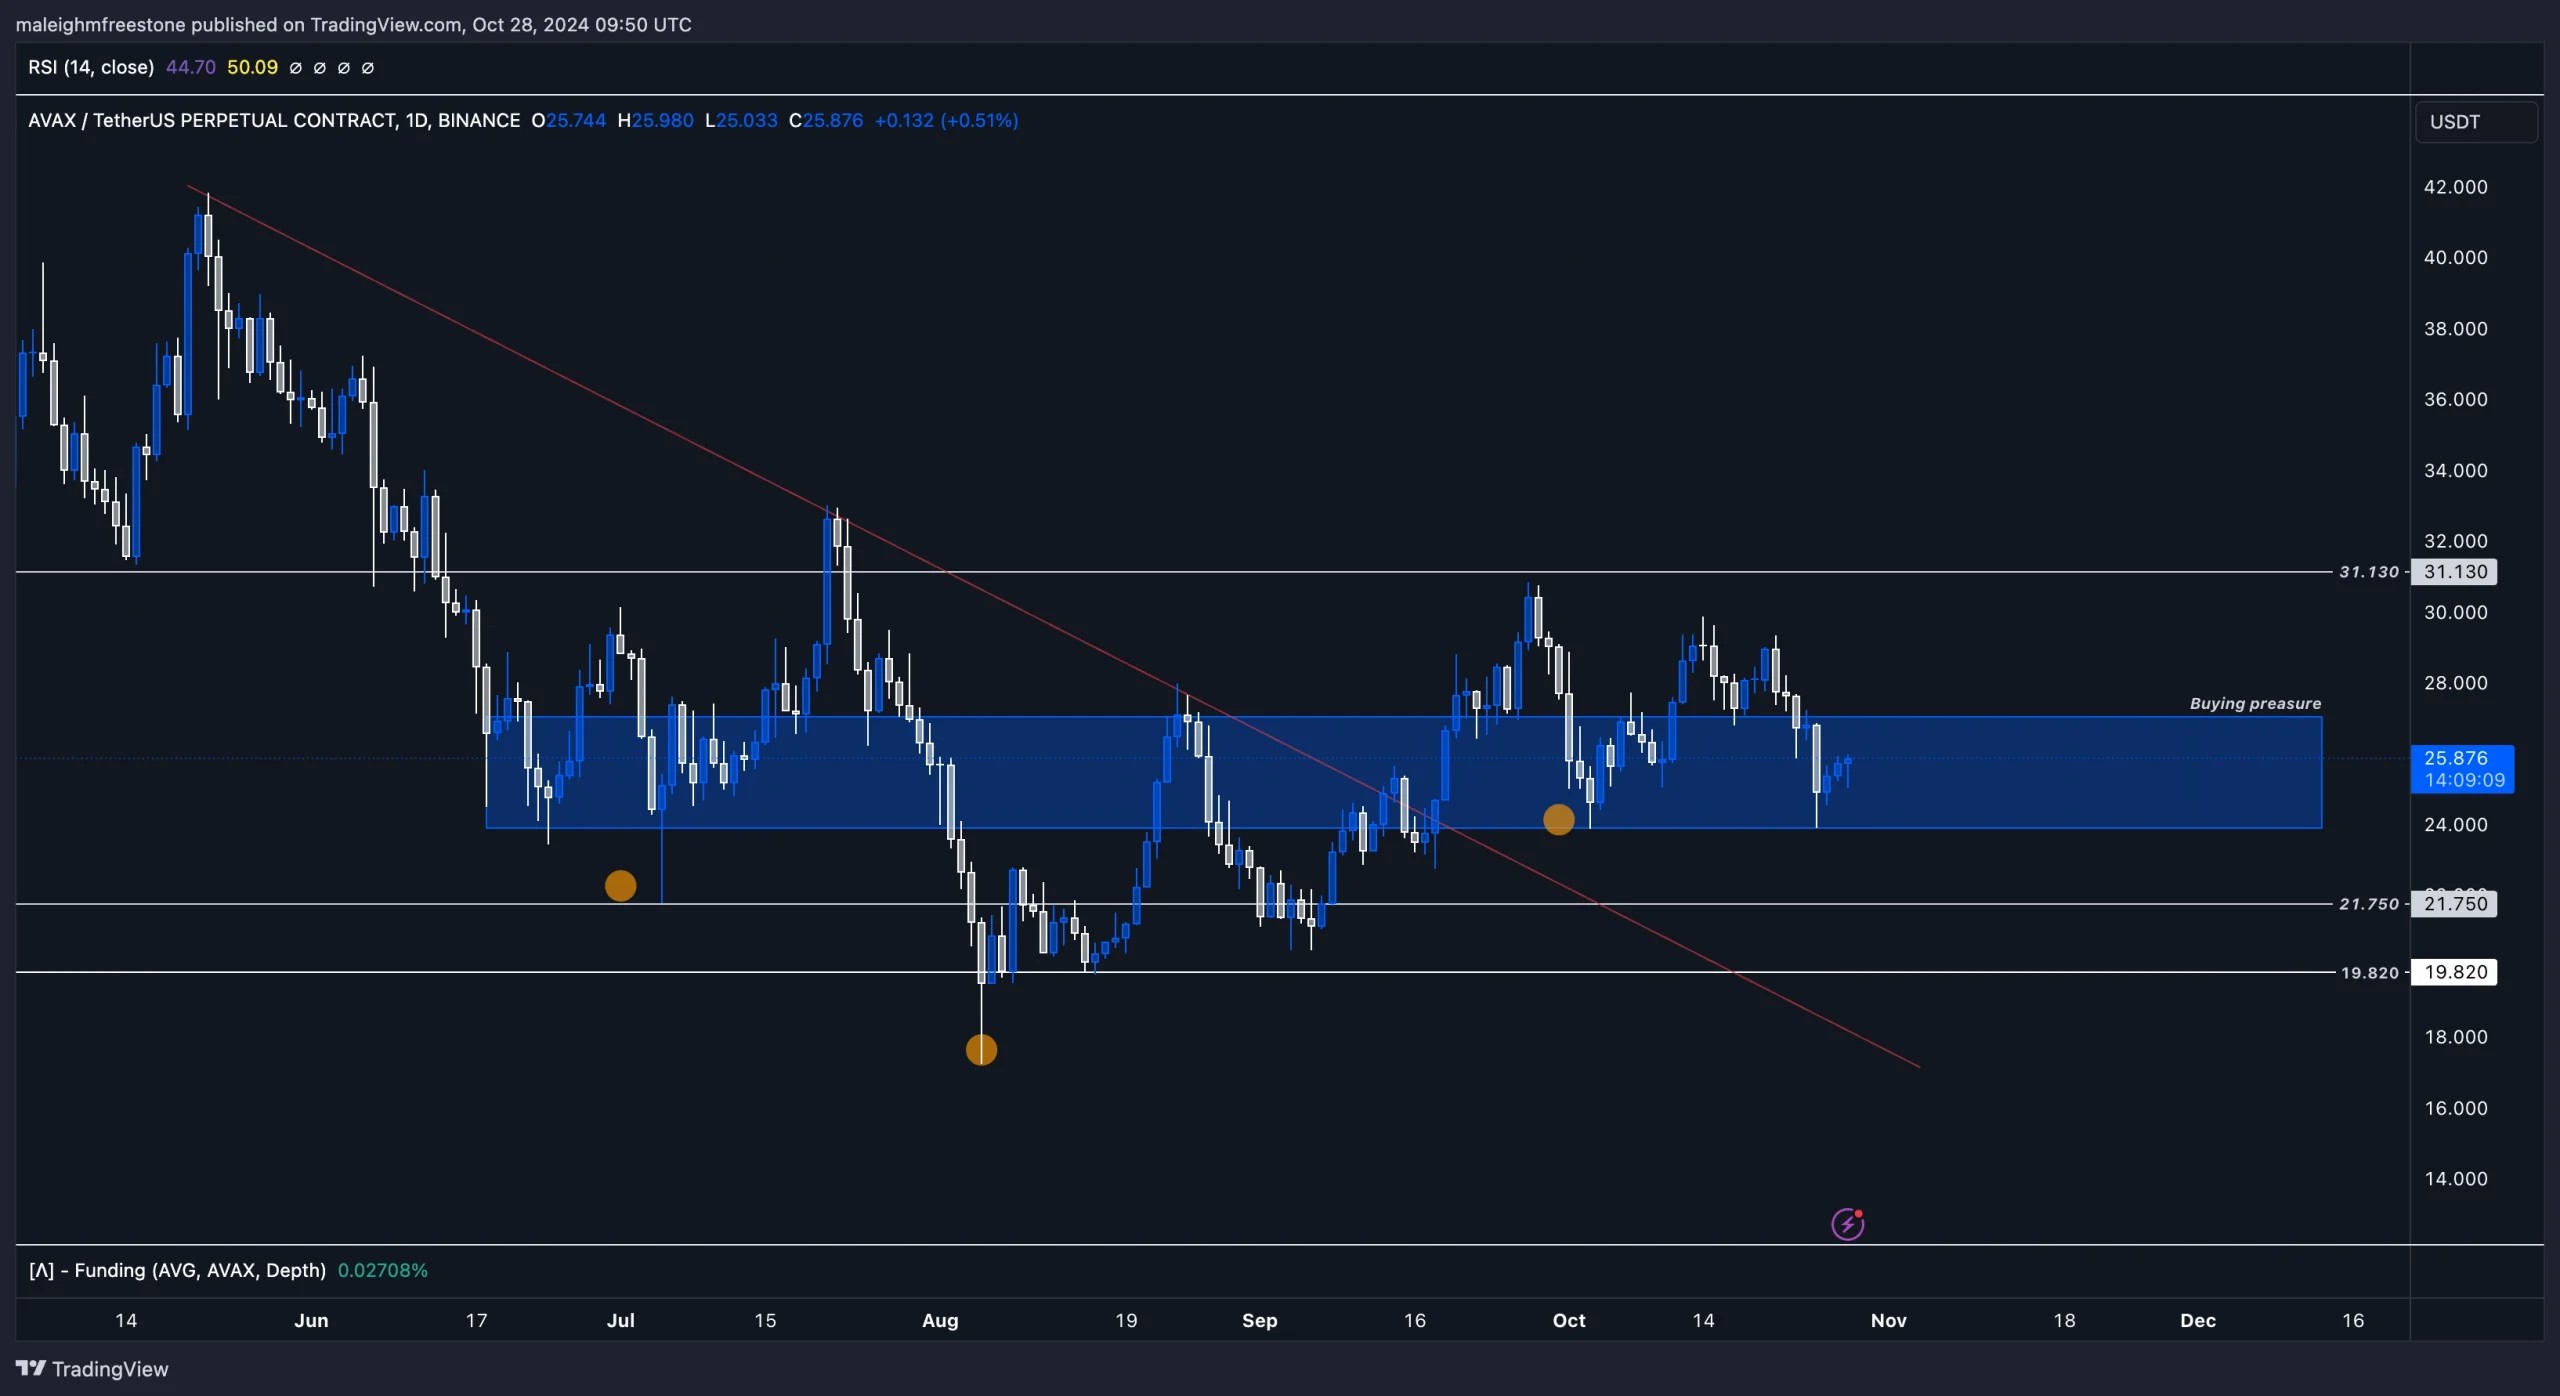
- Build Zone: Continue building within the weekly buying pressure box, using levels from the inverted head and shoulders pattern to accumulate.
- Upside Potential: Watching for confirmation of a rounded bottom, with a break above the key neckline to target a sustained uptrend.
- Strategy: Maintain focus on spot accumulation and gradually increase position as the structure forms. Avoid leverage for now, as volatility may pick up if the inverted head and shoulders pattern confirms a move higher.
Cryptonary's take
AVAX's pattern aligns well with broader market indicators, and funding trends show that this could be the foundation of a larger move. Holding within this structure allows for building a position with a strong risk-reward ratio, and the signs are aligning for a potential bullish reversal.AVAX isn't an asset we currently hold or are included in our CPRO picks, but it remains a strong performer, has community interest, and is a promising technical formation.
PEPE:
Overview
Pepe ($PEPE) has been trading within a critical range over the past week. In our last analysis, we noted that the price was at $0.0000096 and highlighted the potential for a breakdown to the lower demand zone and the 200 EMA on the daily timeframe. This forecast played out as expected, with $PEPE breaking down to touch the $0.00000845 level, perfectly aligning with the daily demand zone (grey box) and the 200 EMA, where it found support.Daily timeframe analysis
Since our last review:- Price Reaction: $PEPE took support exactly at the 200 EMA, trading around $0.00000845 within the daily demand zone marked by the grey box. This confluence of support levels has held up well, preventing further downside.
- Trendline Reversal: The next focus is on whether $PEPE can reclaim the yellow trendline above, which it previously lost. Reclaiming this trendline is essential for shifting momentum back to the upside. If successful, it could signal a push higher, potentially breaking the $0.000011 resistance level.
- Resistance Levels: If $PEPE manages to break above the trendline and sustain the upward momentum, the next target on the daily timeframe would be the $0.000013 level.
- Support Levels: If the 200 EMA support breaks down, the next significant support zone for $PEPE is the lower macro support, marked by another daily demand zone. This area will be crucial for maintaining the overall bullish structure.

Cryptonary's take
The analysis from last week played out perfectly, with $PEPE reacting strongly to the expected levels. The 200 EMA and daily demand zone have proven to be reliable supports, but for a sustained move higher, $PEPE needs to reclaim the yellow trendline.It's currently trading at a discounted level, providing a fresh opportunity for those considering a position. However, monitoring the price action around these key levels is essential before expecting any further upside.
JUP:
Overview
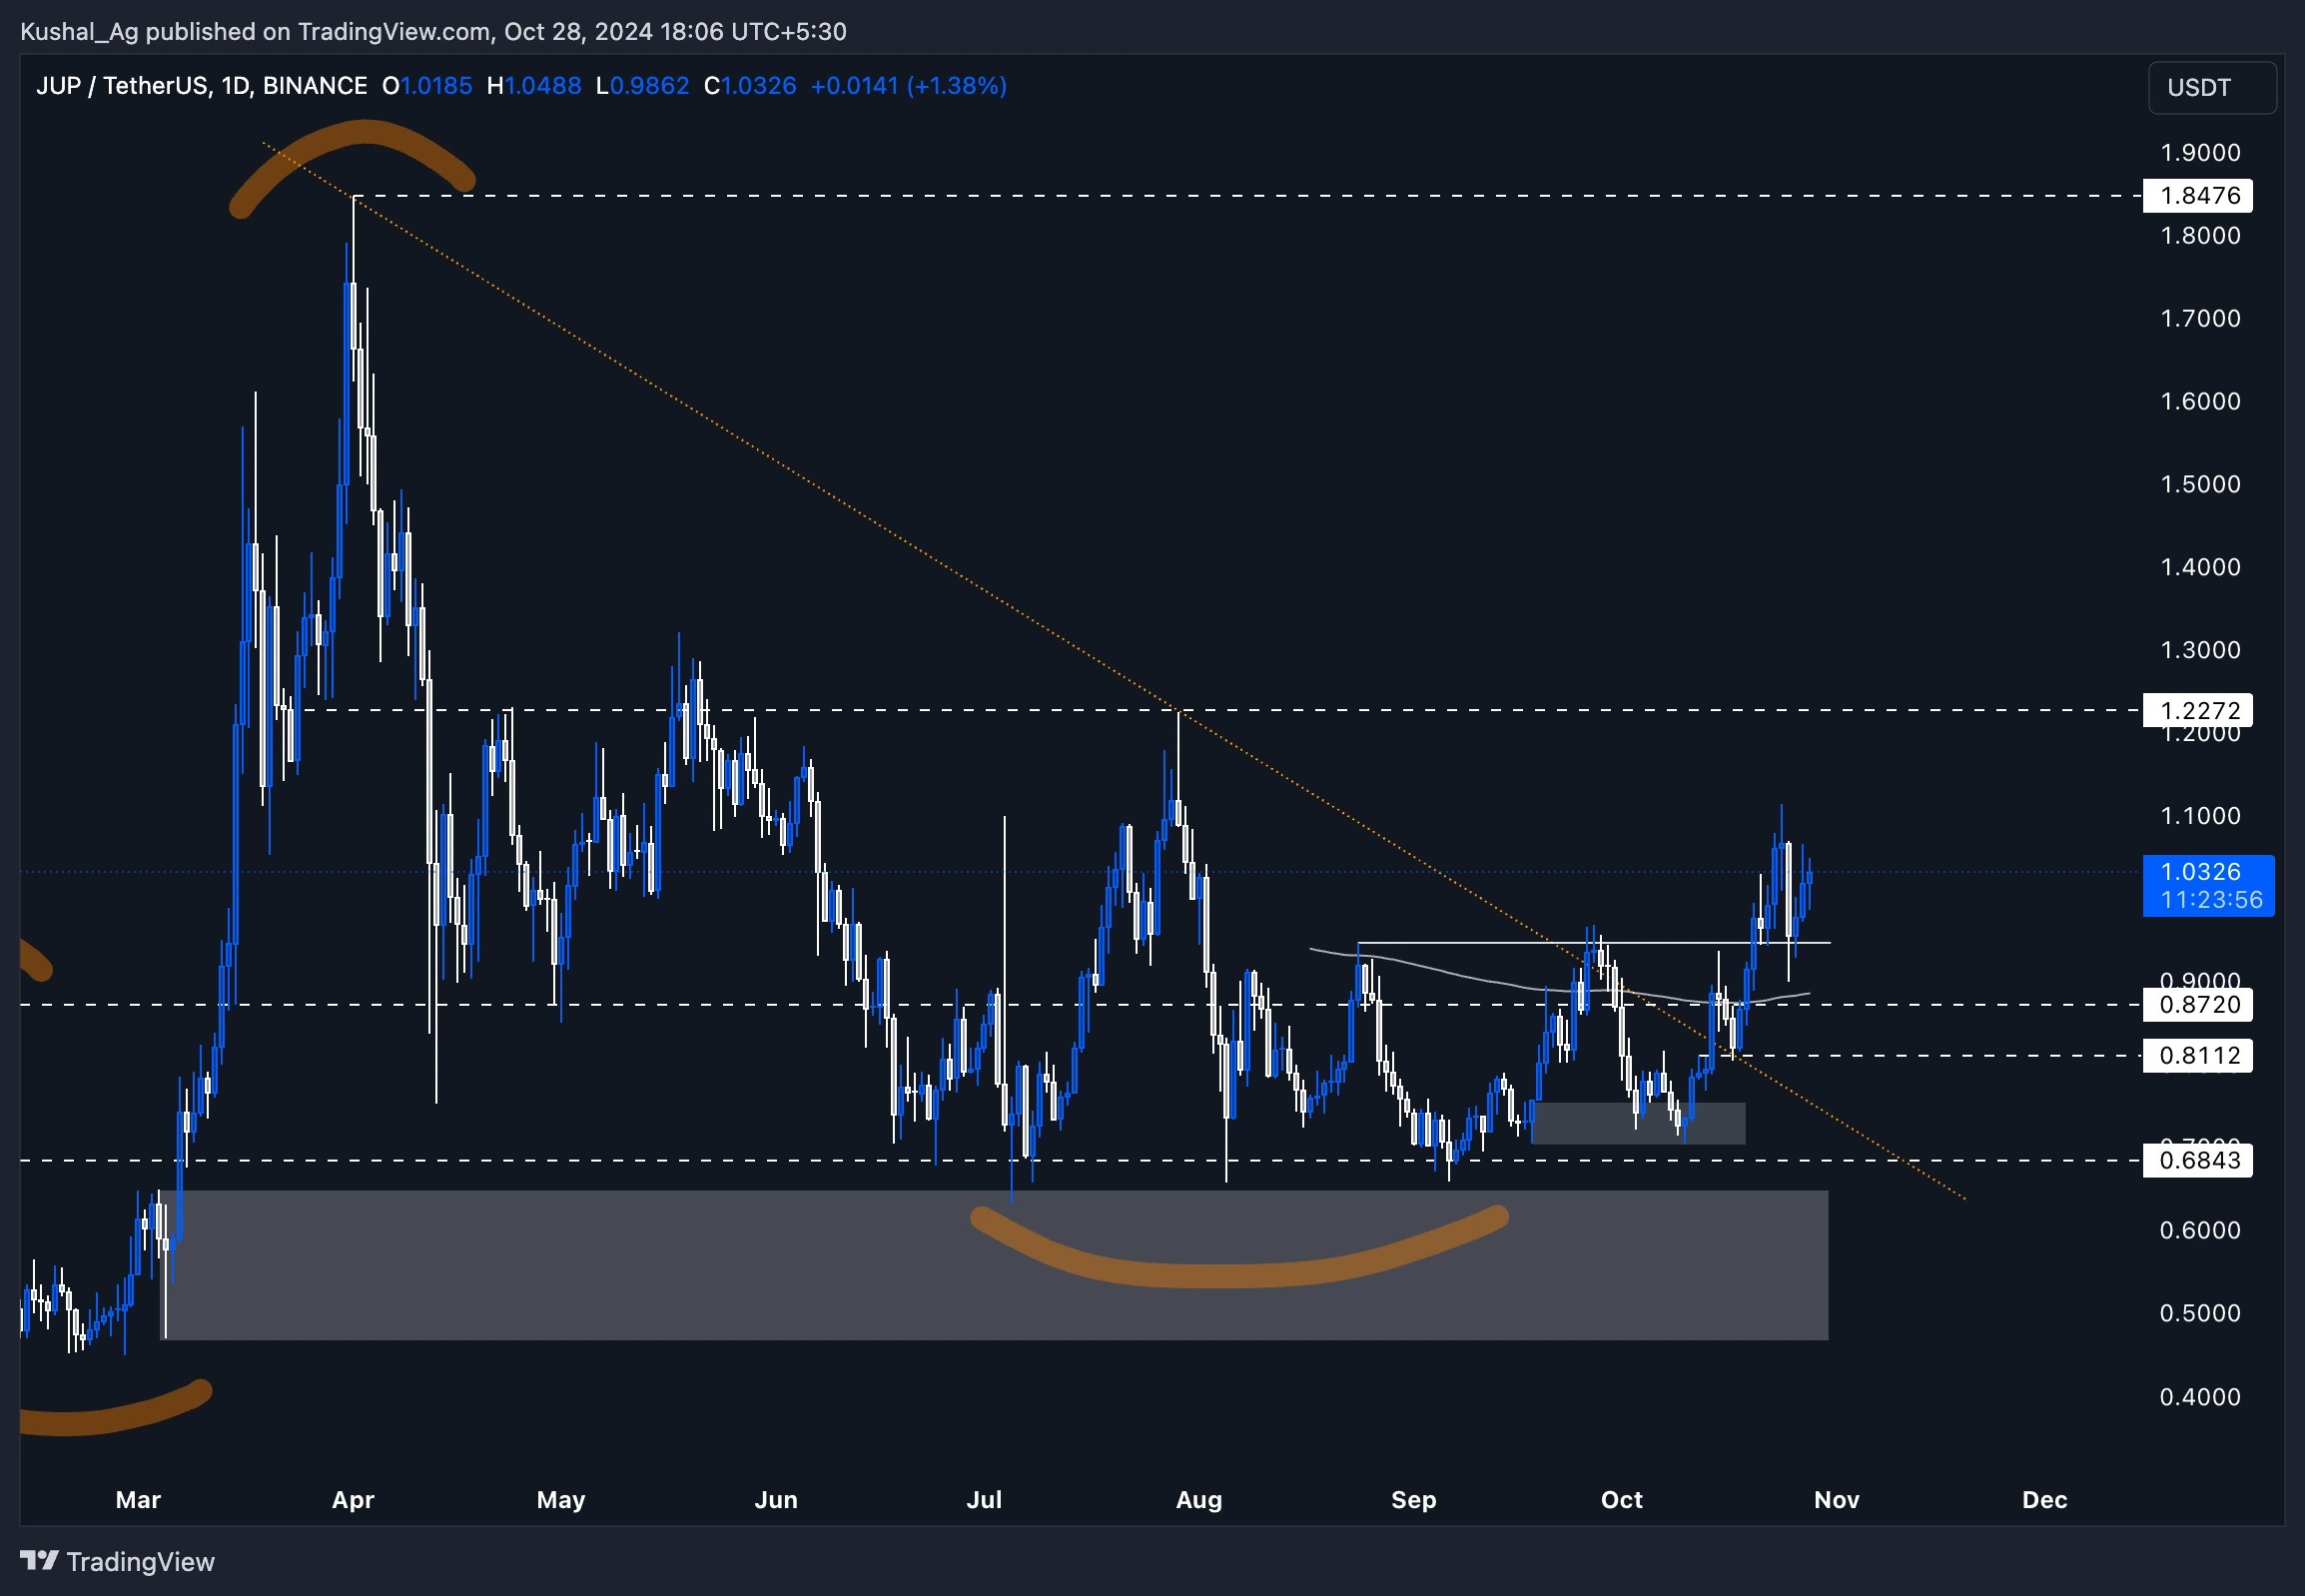
In our previous analysis, Jupiter was struggling to break above the critical $1 psychological mark. However, since then, $JUP successfully broke through, reaching a high of $1.11 on 24th October. The previous resistance zone of $0.94 has now flipped into a strong support level, as seen with price consistently taking support from this area.Daily timeframe analysis
- Recent Price Movement: After breaking above the $1 level, $JUP pushed to a high of $1.11 before pulling back slightly. It has retested the $0.94 support zone and held up well, showing strength in this area.
- Higher Highs and Higher Lows: The structure on the daily timeframe shows a clear pattern of higher highs and higher lows, indicating a continued uptrend. The asset is currently trading at $1.03, attempting to hold above the crucial $1 mark.
- Next Targets: If $JUP manages to sustain above the $1 region, the next target lies at $1.22 in the short to medium term. Beyond that, there is clear space for $JUP to move higher, potentially testing its all-time highs (ATH).
Cryptonary's take
Despite the wider market showing signs of consolidation, $JUP is demonstrating strength by breaking through key resistance levels and maintaining its uptrend. The price action has been consistent, with the support at $0.94 acting as a solid base. However, monitoring the price action around the $1 level will be crucial.A sustained hold above this level could set up $JUP for another rally. On the downside, keeping an eye on the $0.94 support zone is important, as any break below could indicate a shift in momentum.
Recommended from Cryptonary


