Save 23% ($351) & Get a Free 1-1 Call with our Team ⏰ : 0d 2h 59m 43s
Disclaimer: Not financial or investment advice. You are responsible for any capital-related decisions you make, and only you are accountable for the results.
TLDR
- The Total Market Cap will likely be rejected from its $1.03T resistance level. Downside is possible.
- ASTR is back inside its accumulation area. Upside has been invalidated.
- For the trend to remain as strong as possible, pullbacks are necessary. They leave room for more growth, as market participants can enter at lower prices and push the market even higher than before.
Total Market Cap
The Total Market Cap index represents the entire valuation of the cryptocurrency market. We track this index to understand where the market is now and to predict where it will likely go next.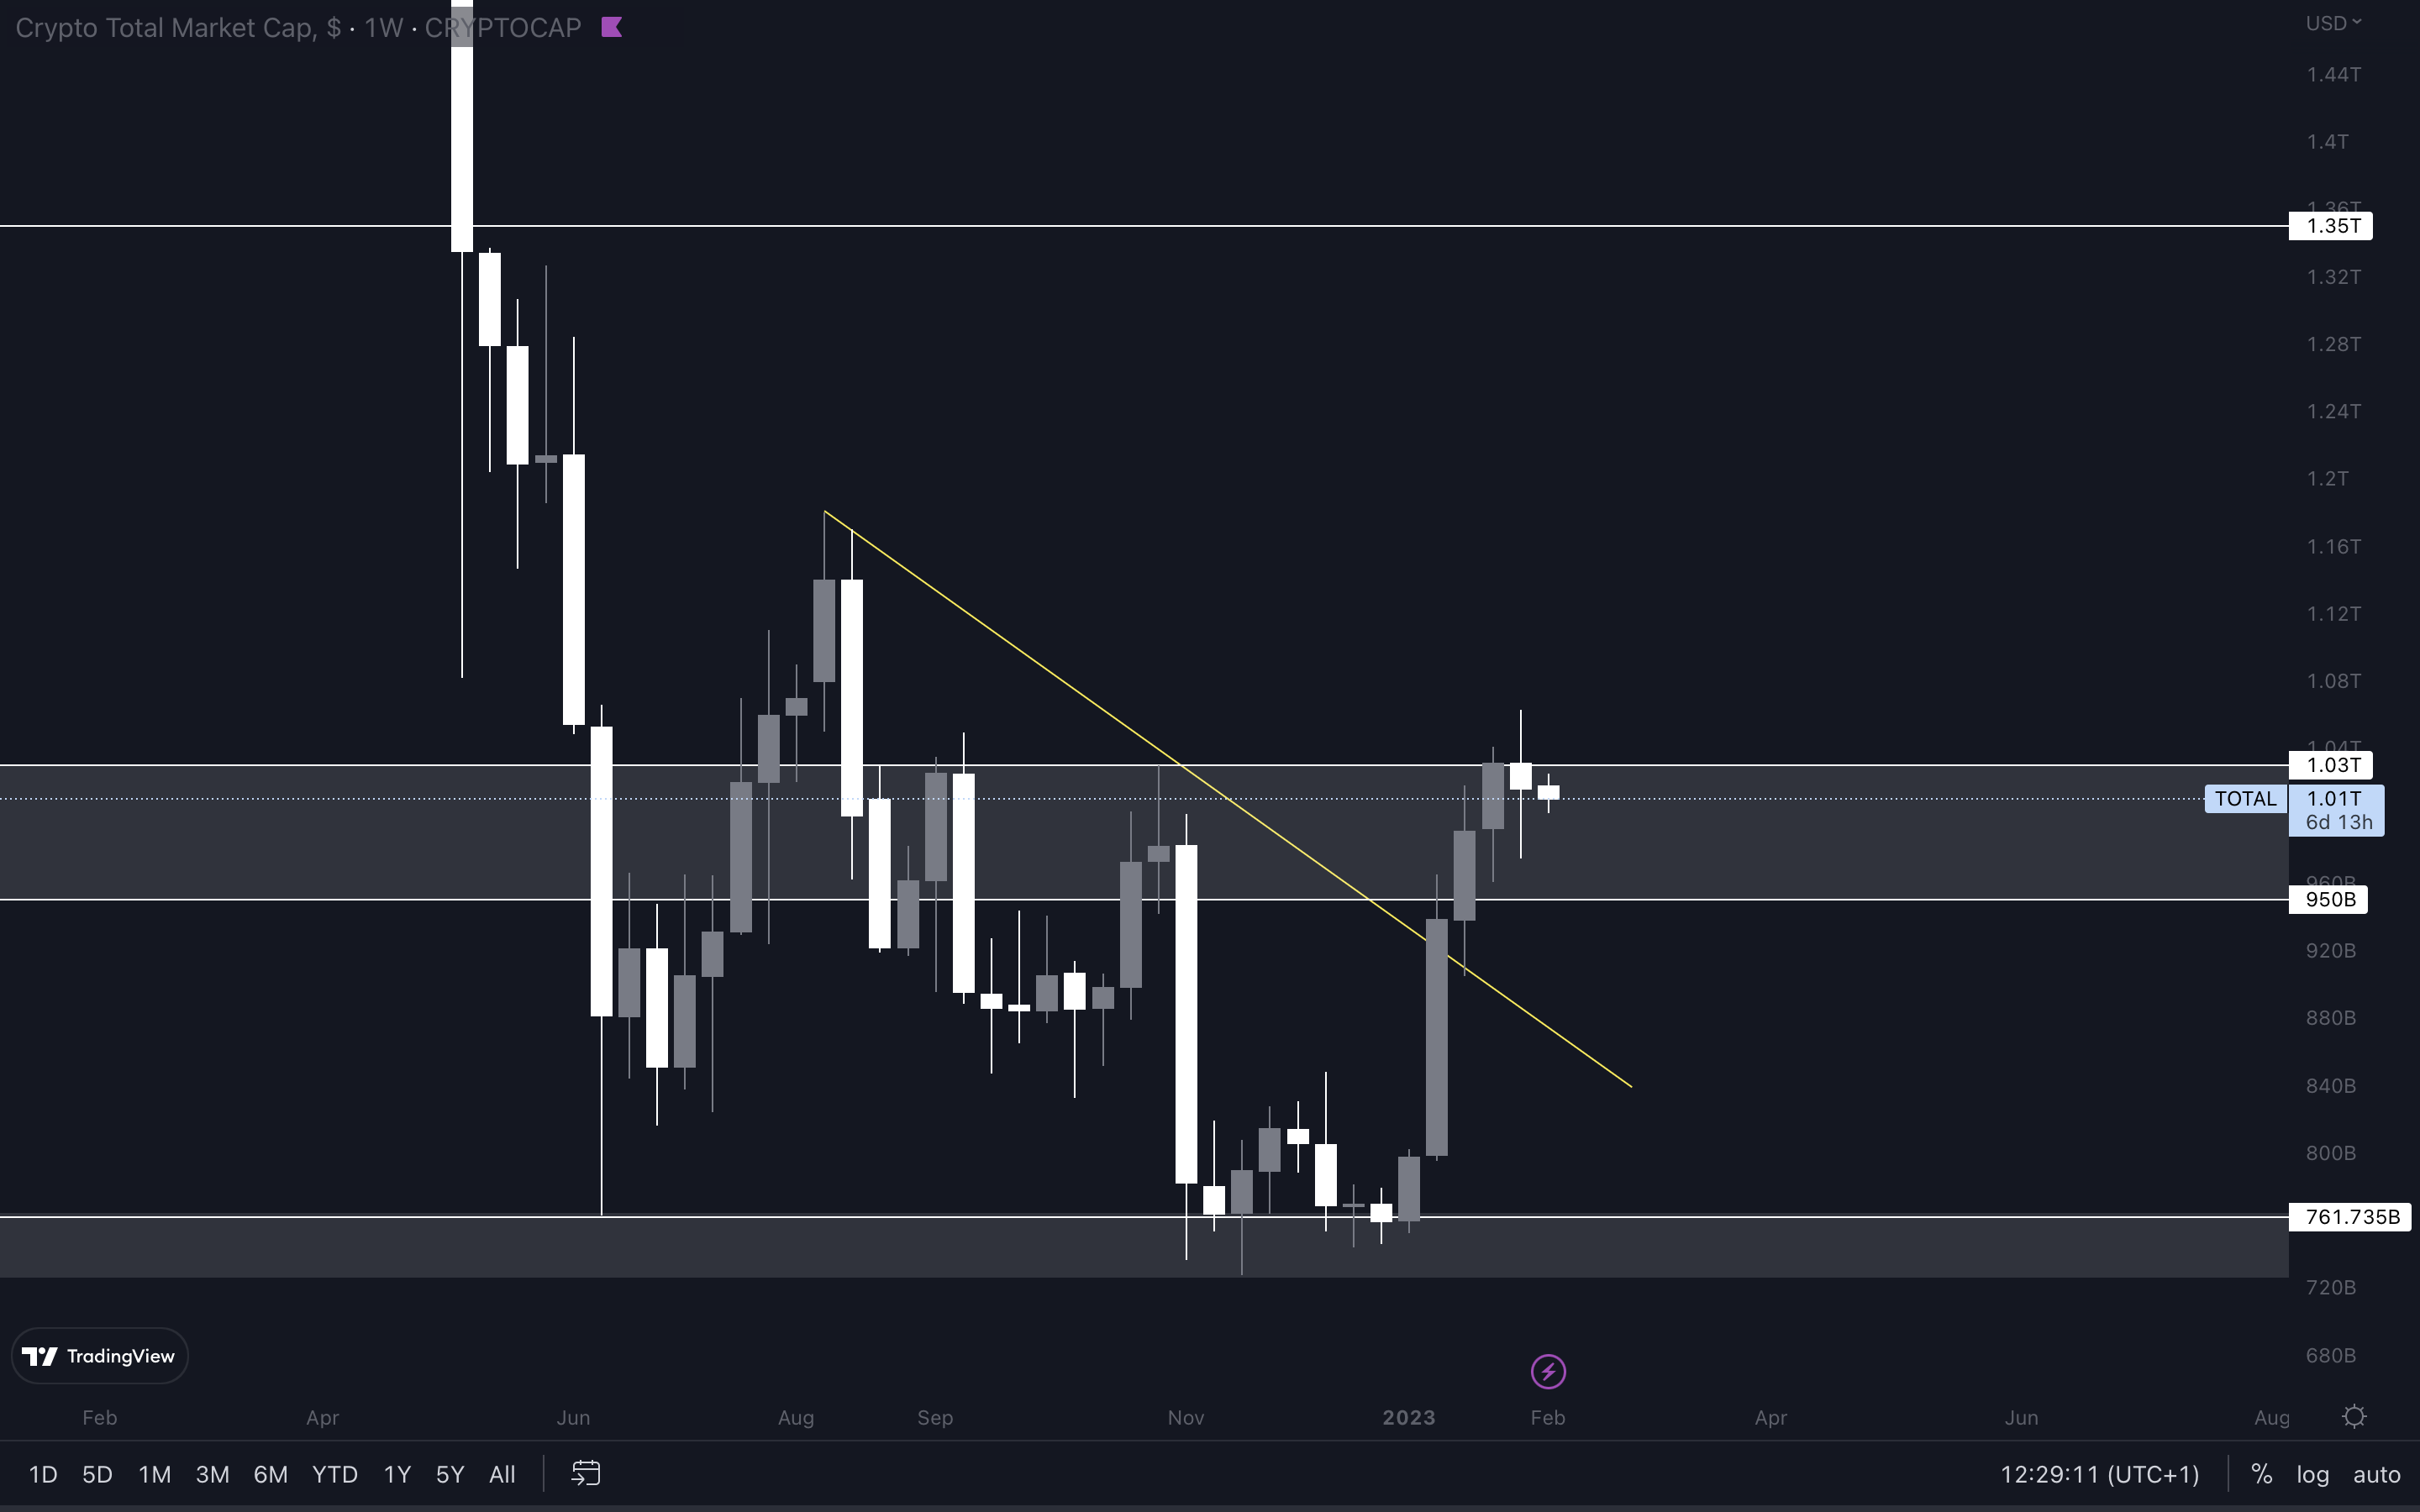
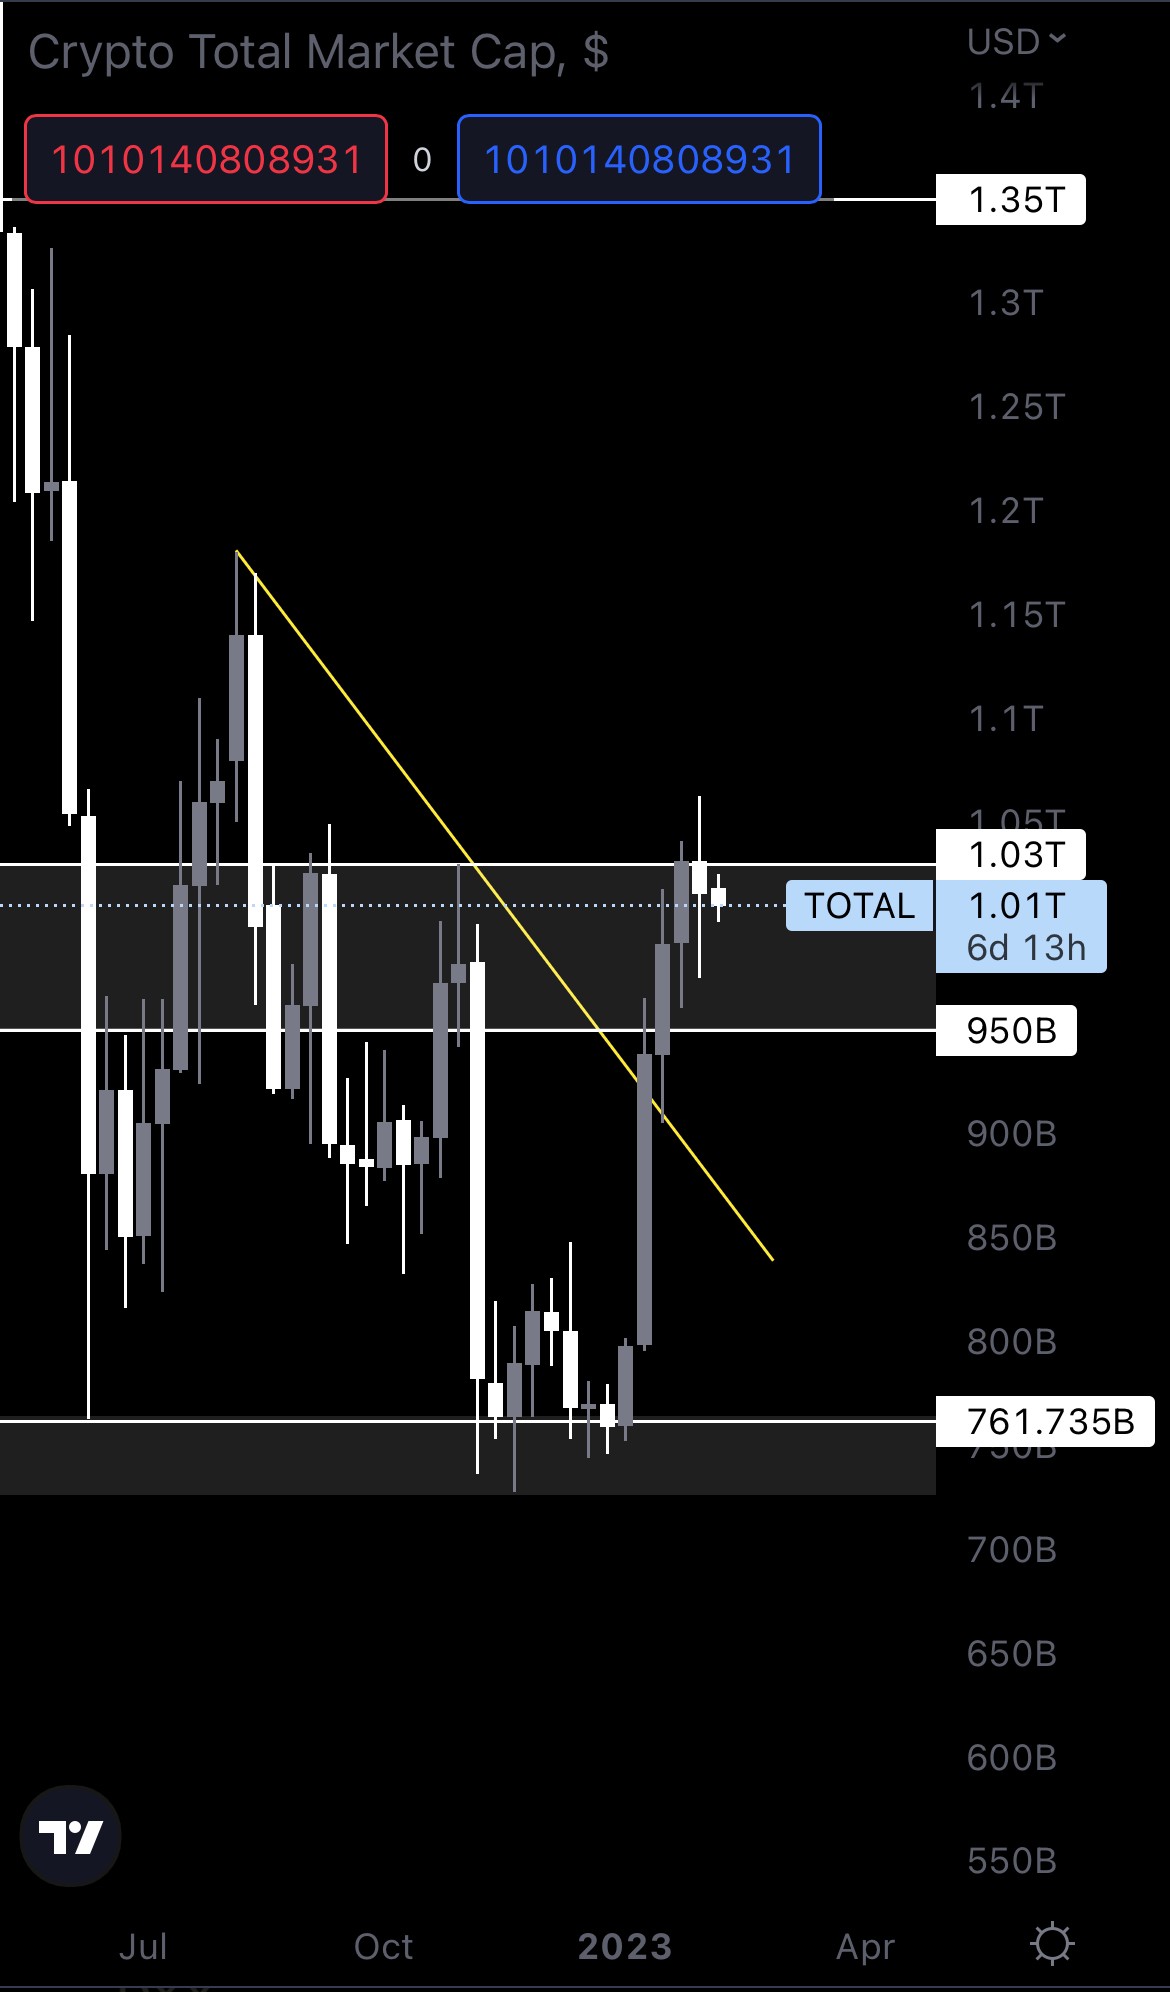
For the trend to remain as strong as possible, pullbacks are necessary. They leave room for more growth, as market participants can enter at lower prices and push the market even higher than before. We are likely not going to see anything extreme, but just know that the odds of going lower from here are high.
The Total Market Cap failed to reclaim $1.03T last week. As a result, we could now be looking at some downside back to $950B (the bottom of the grey box on the chart). An invalidation of this scenario will occur if a weekly candle closes above $1.03T. Whether the Total Market Cap retraces even lower than $950B remains to be seen. For now, that’s the level you should pay the most attention to.
Altcoins Market Cap
The Altcoins Market Cap index represents the entire evaluation of the altcoins market (all coins other than BTC).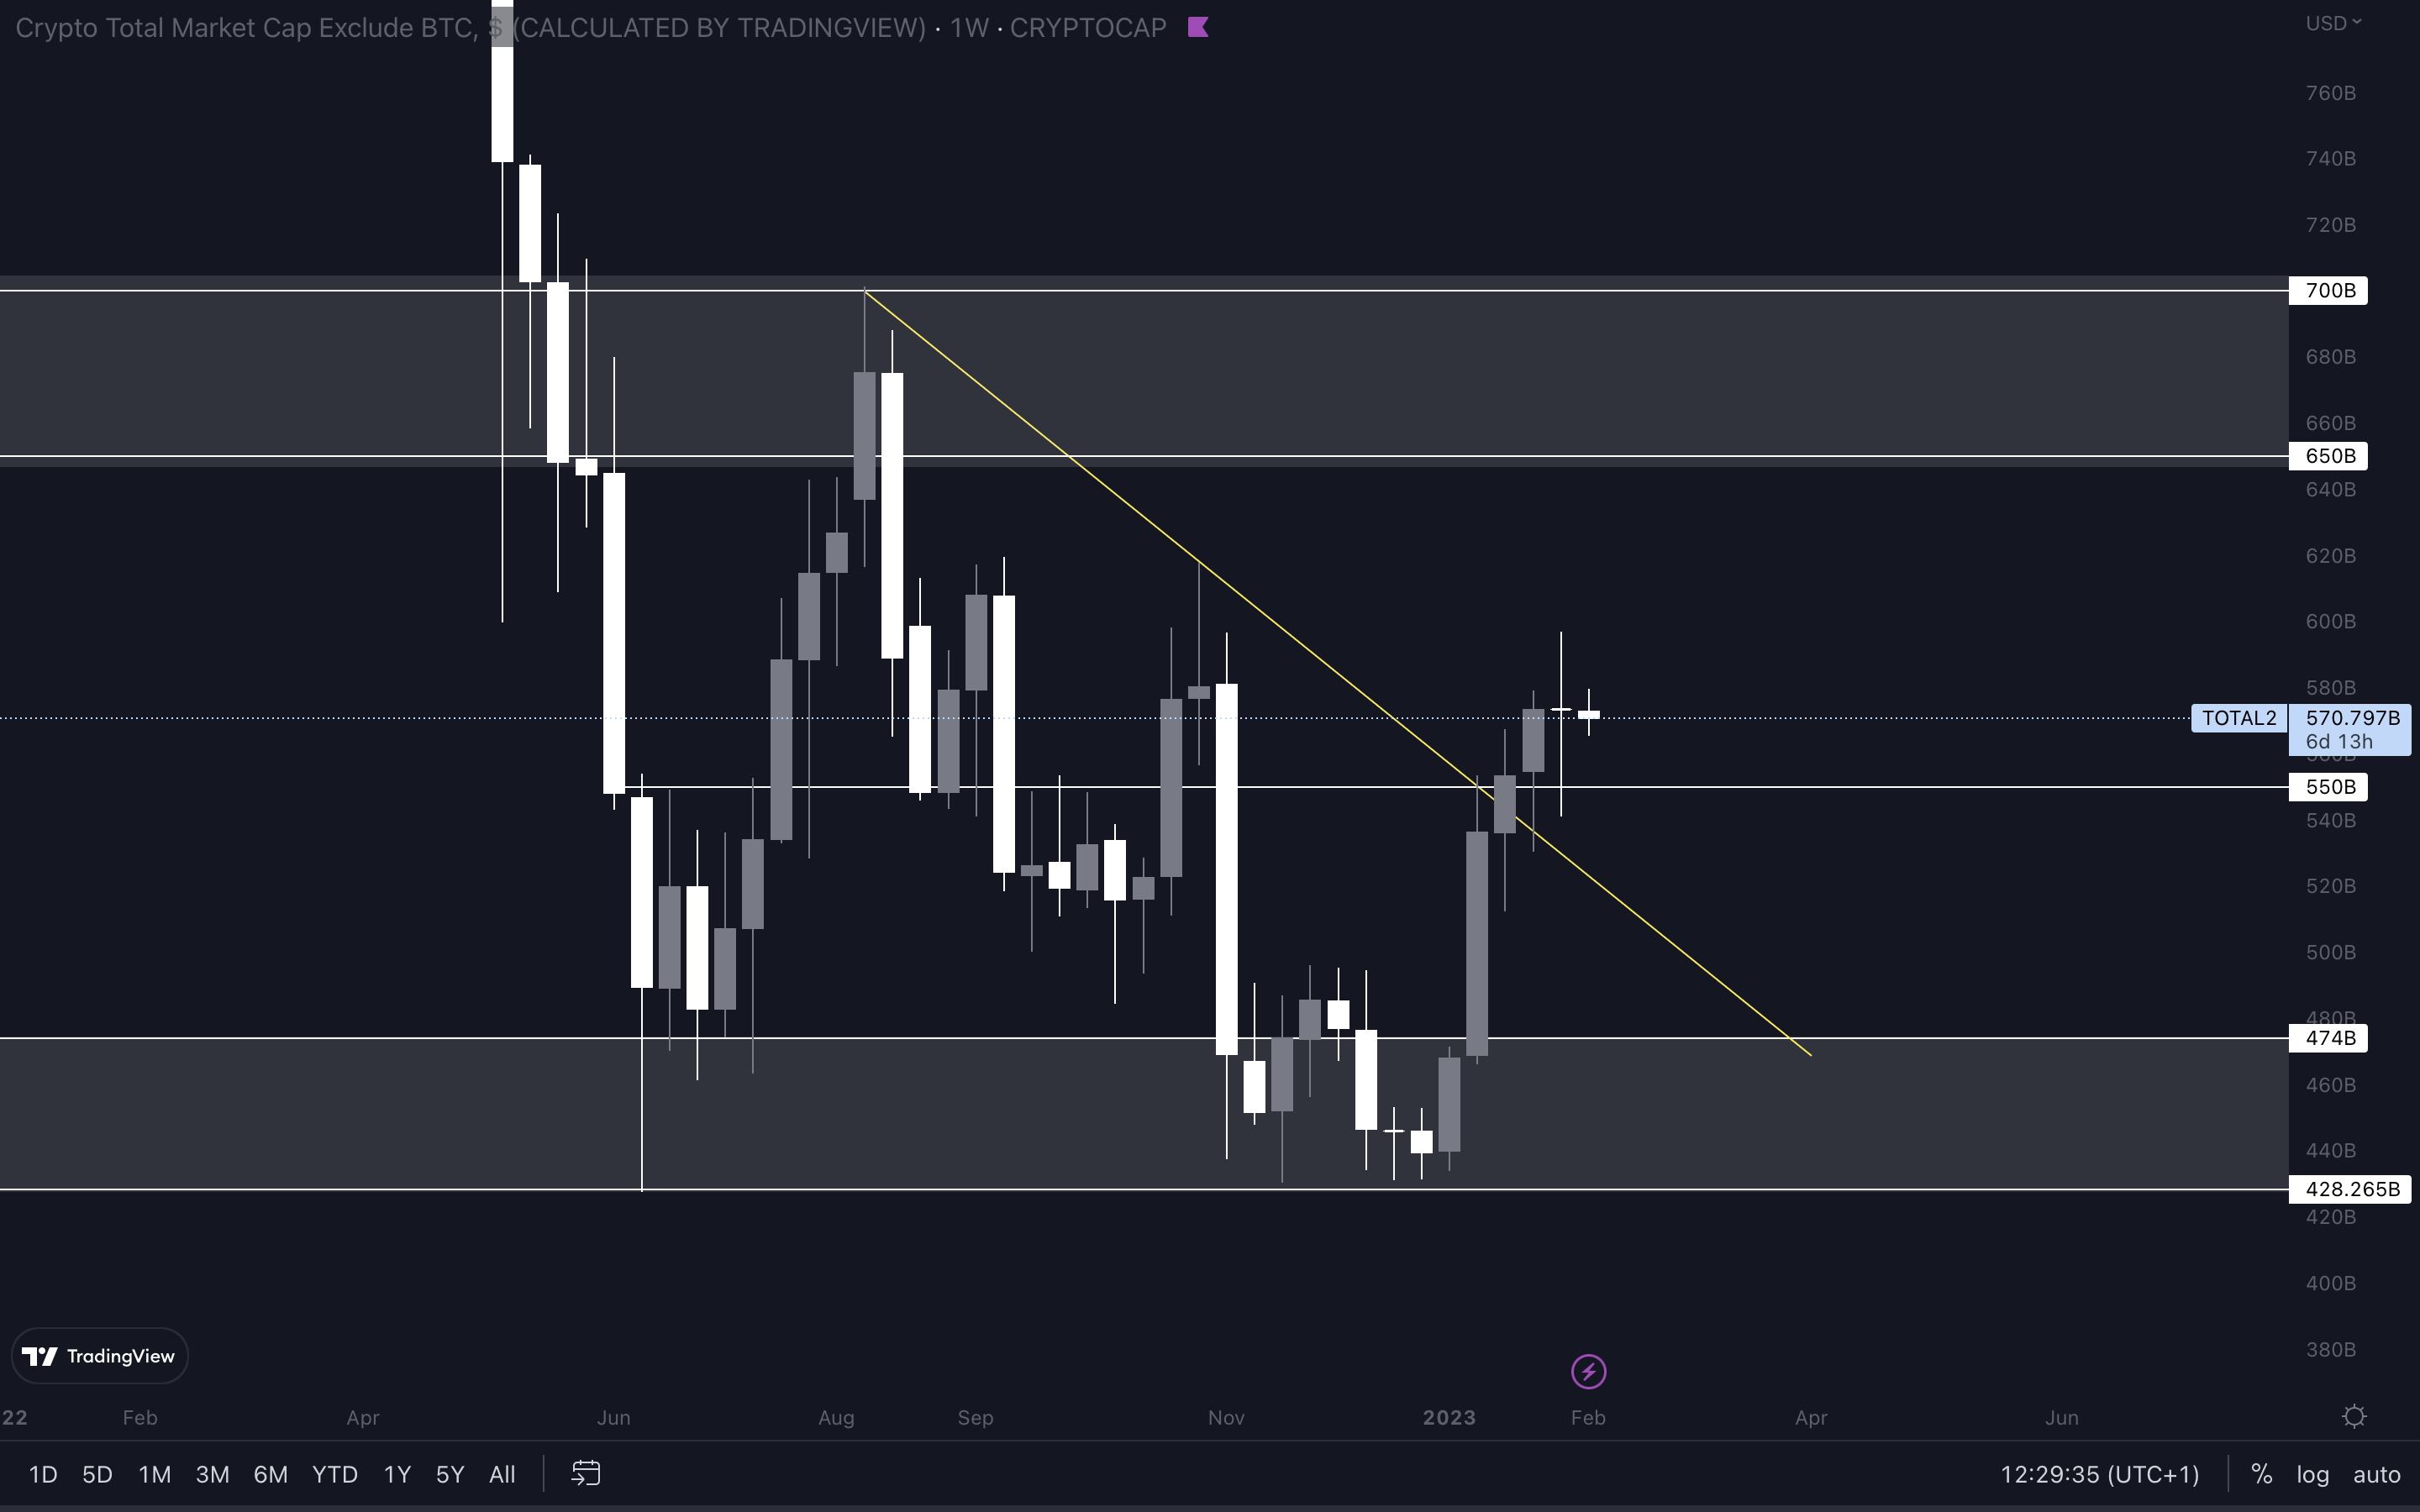
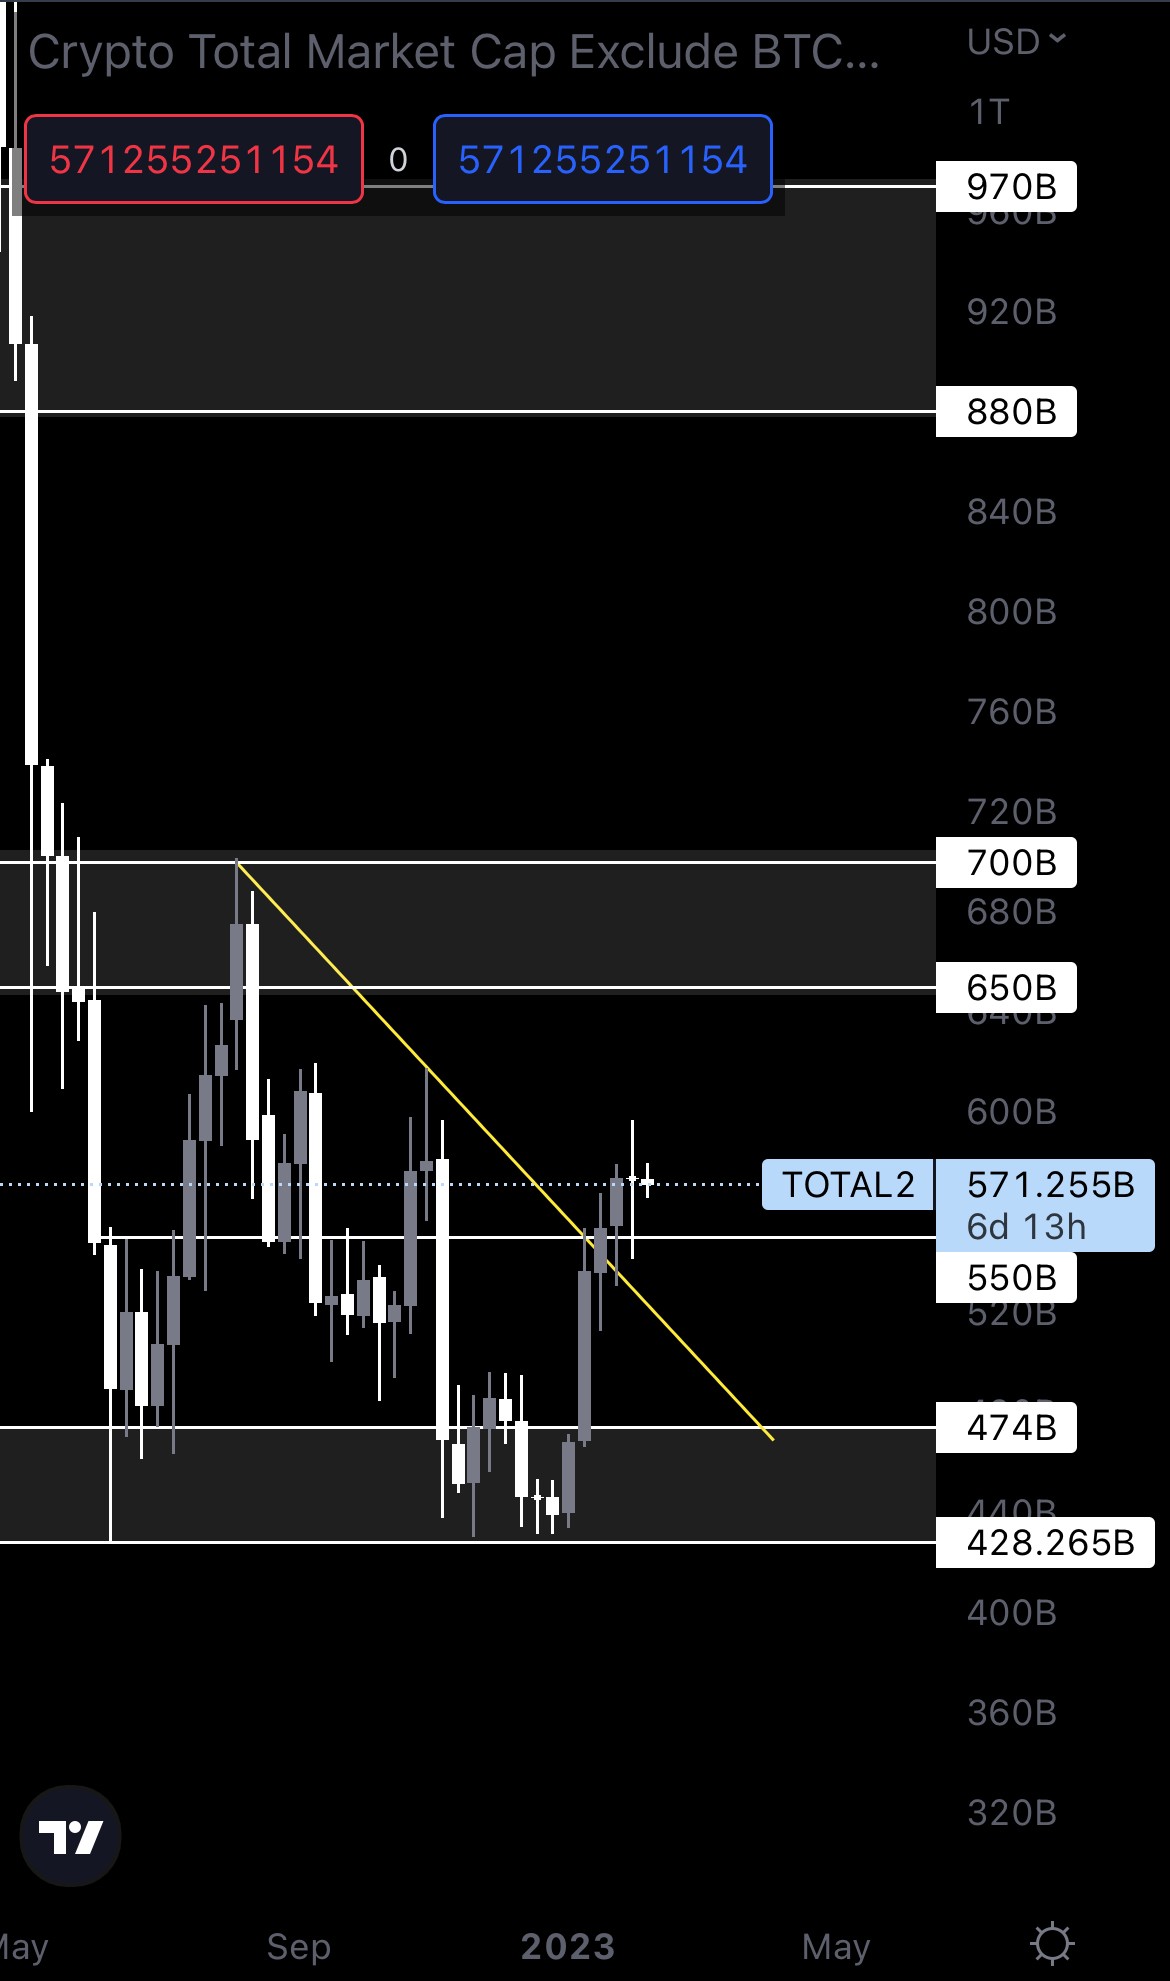
Last week, the altcoins market saw the formation of a Doji candle. This type of candlestick suggests indecision from both buyers and sellers – a battle between gladiators with the outcome yet to be determined. Because the Total Market Cap index influences the market’s direction the most, and we’re seeing a potential rejection from resistance, we can only assume the Altcoins Market Cap index will head toward $550B next, its nearest support level.
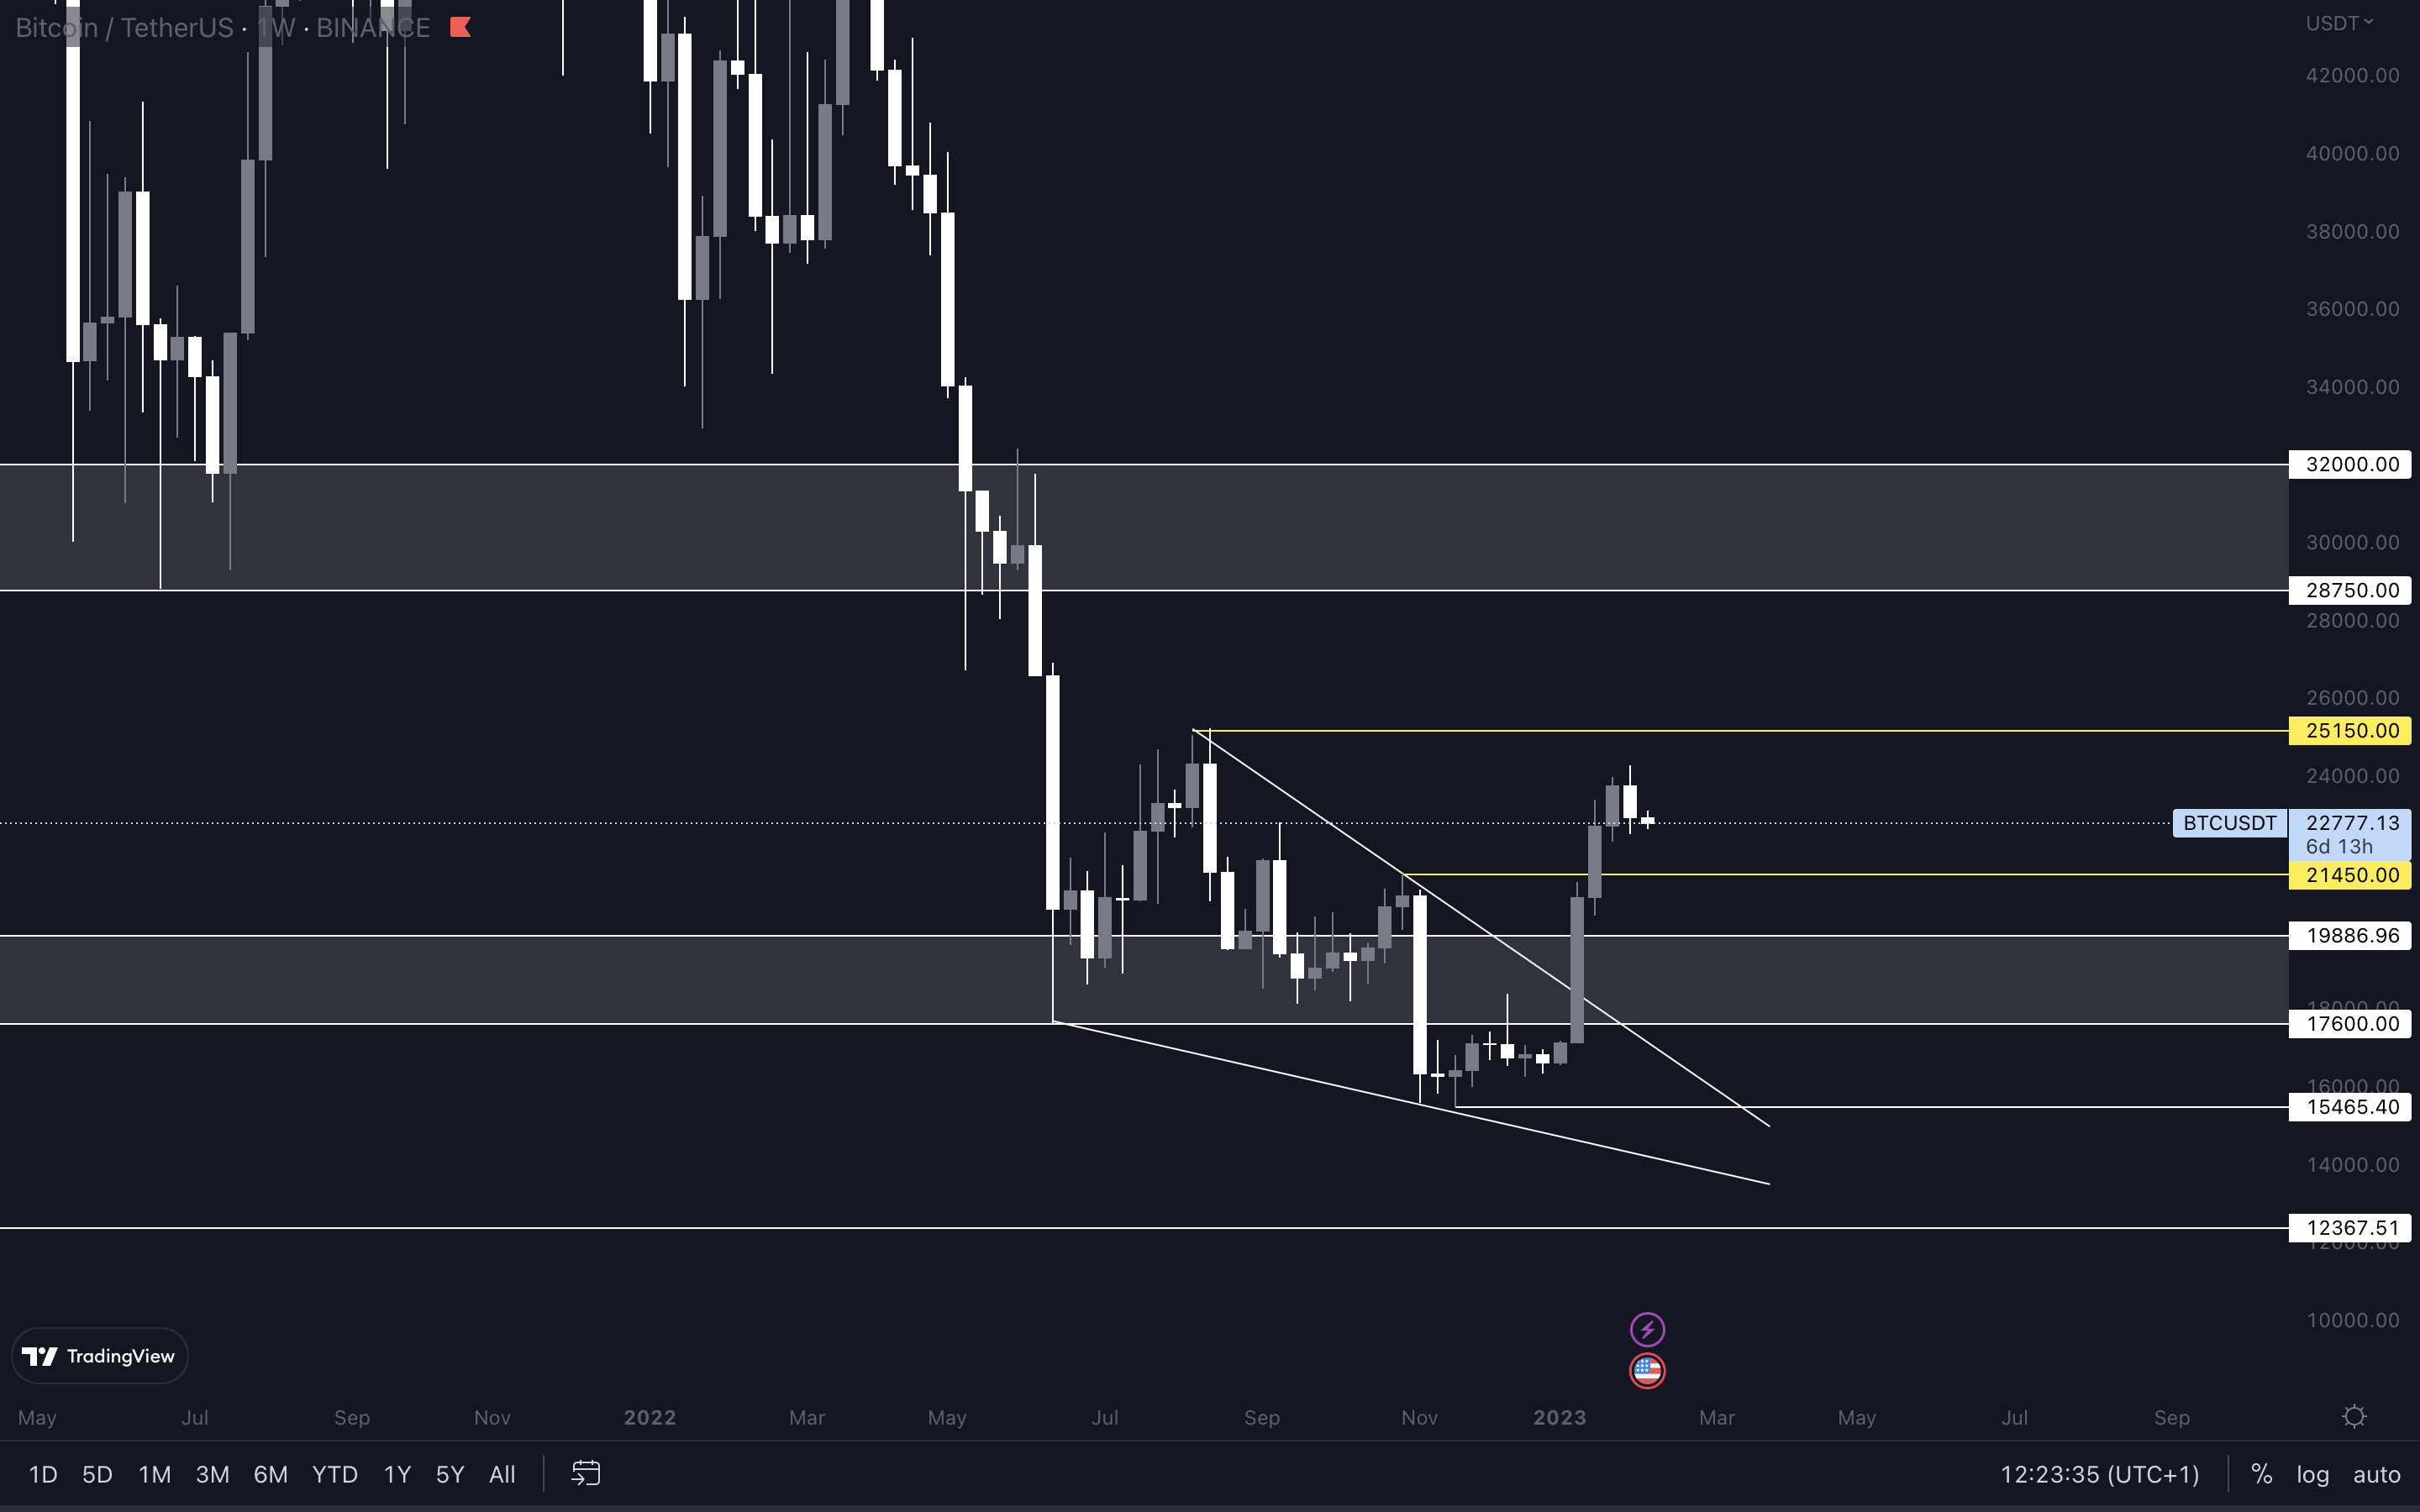
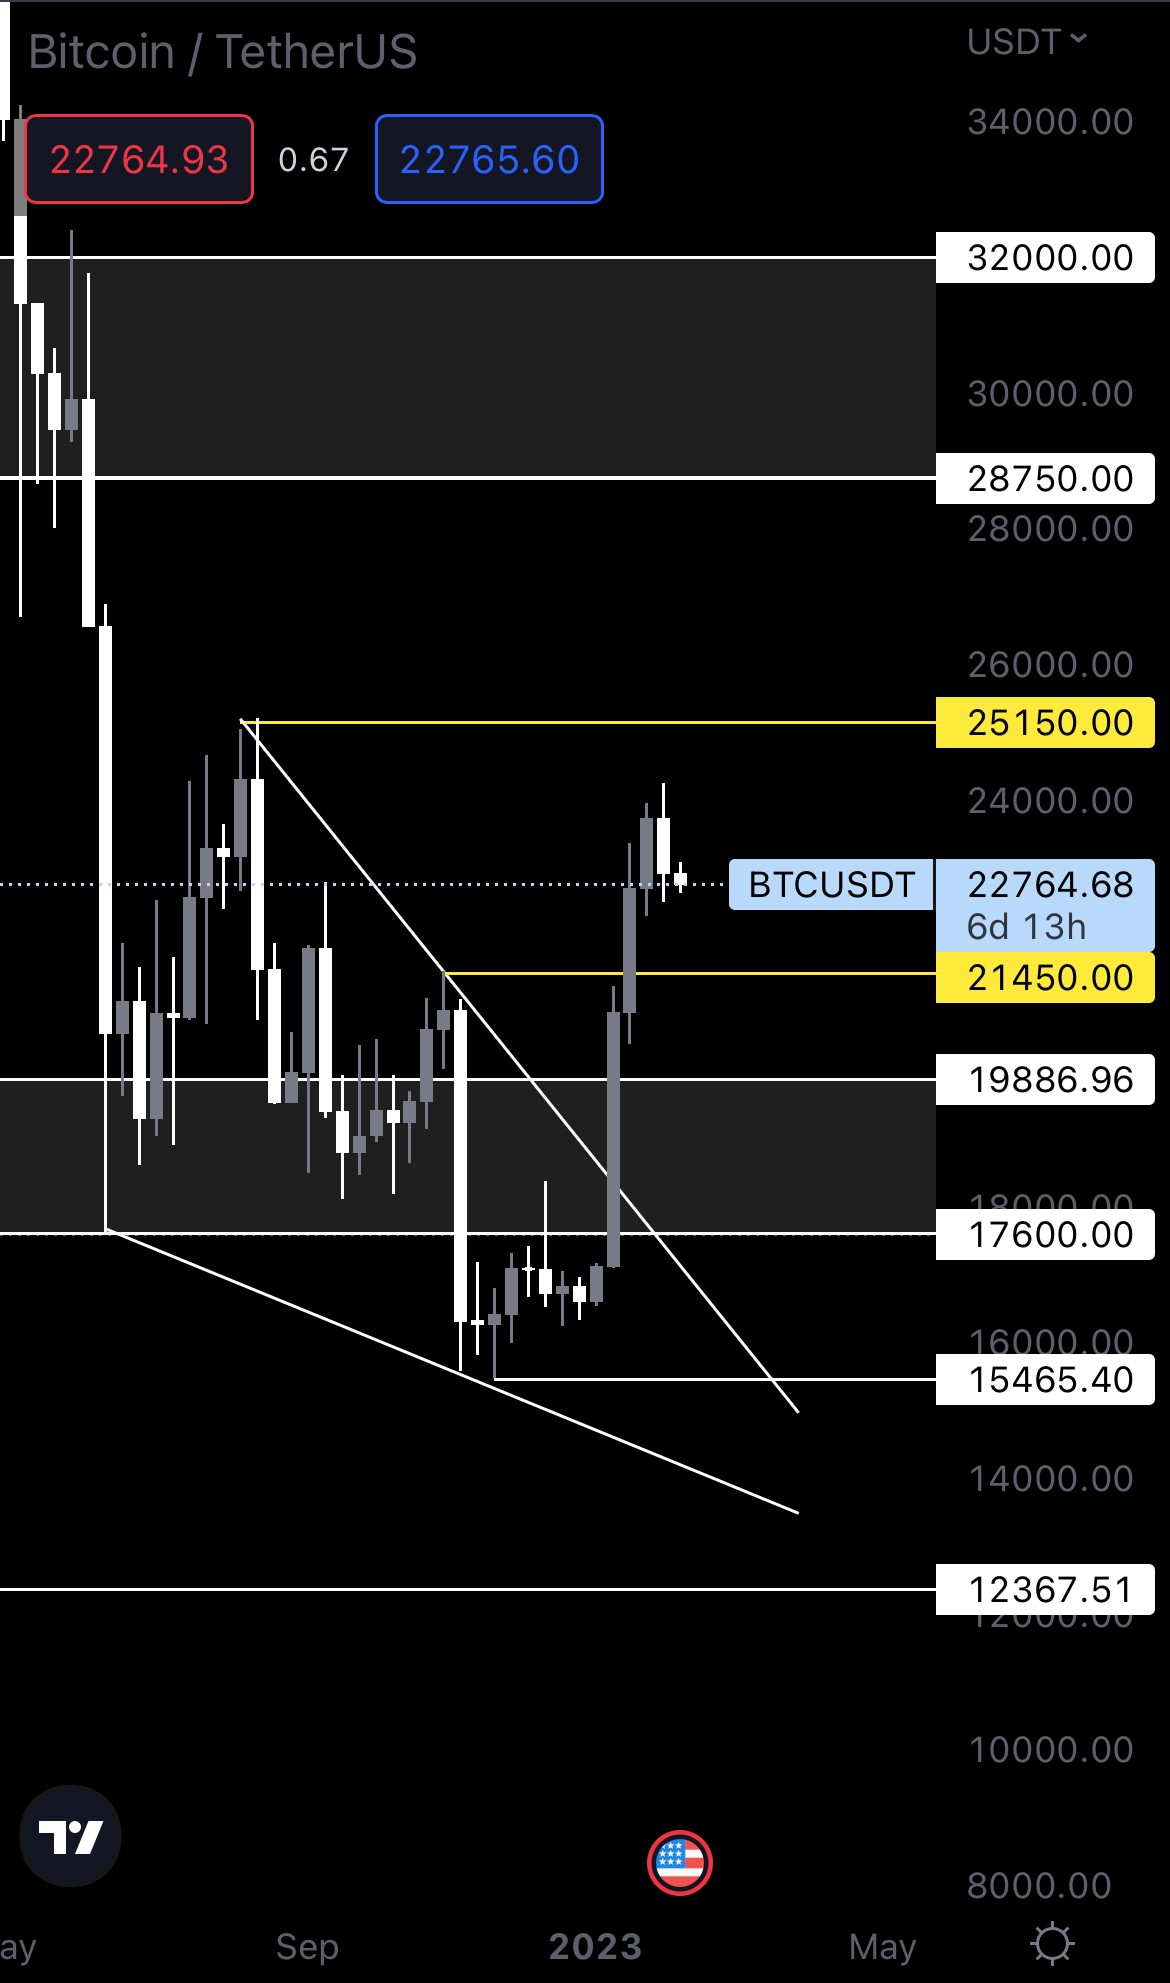
BTC | Bitcoin
ETH | Ethereum
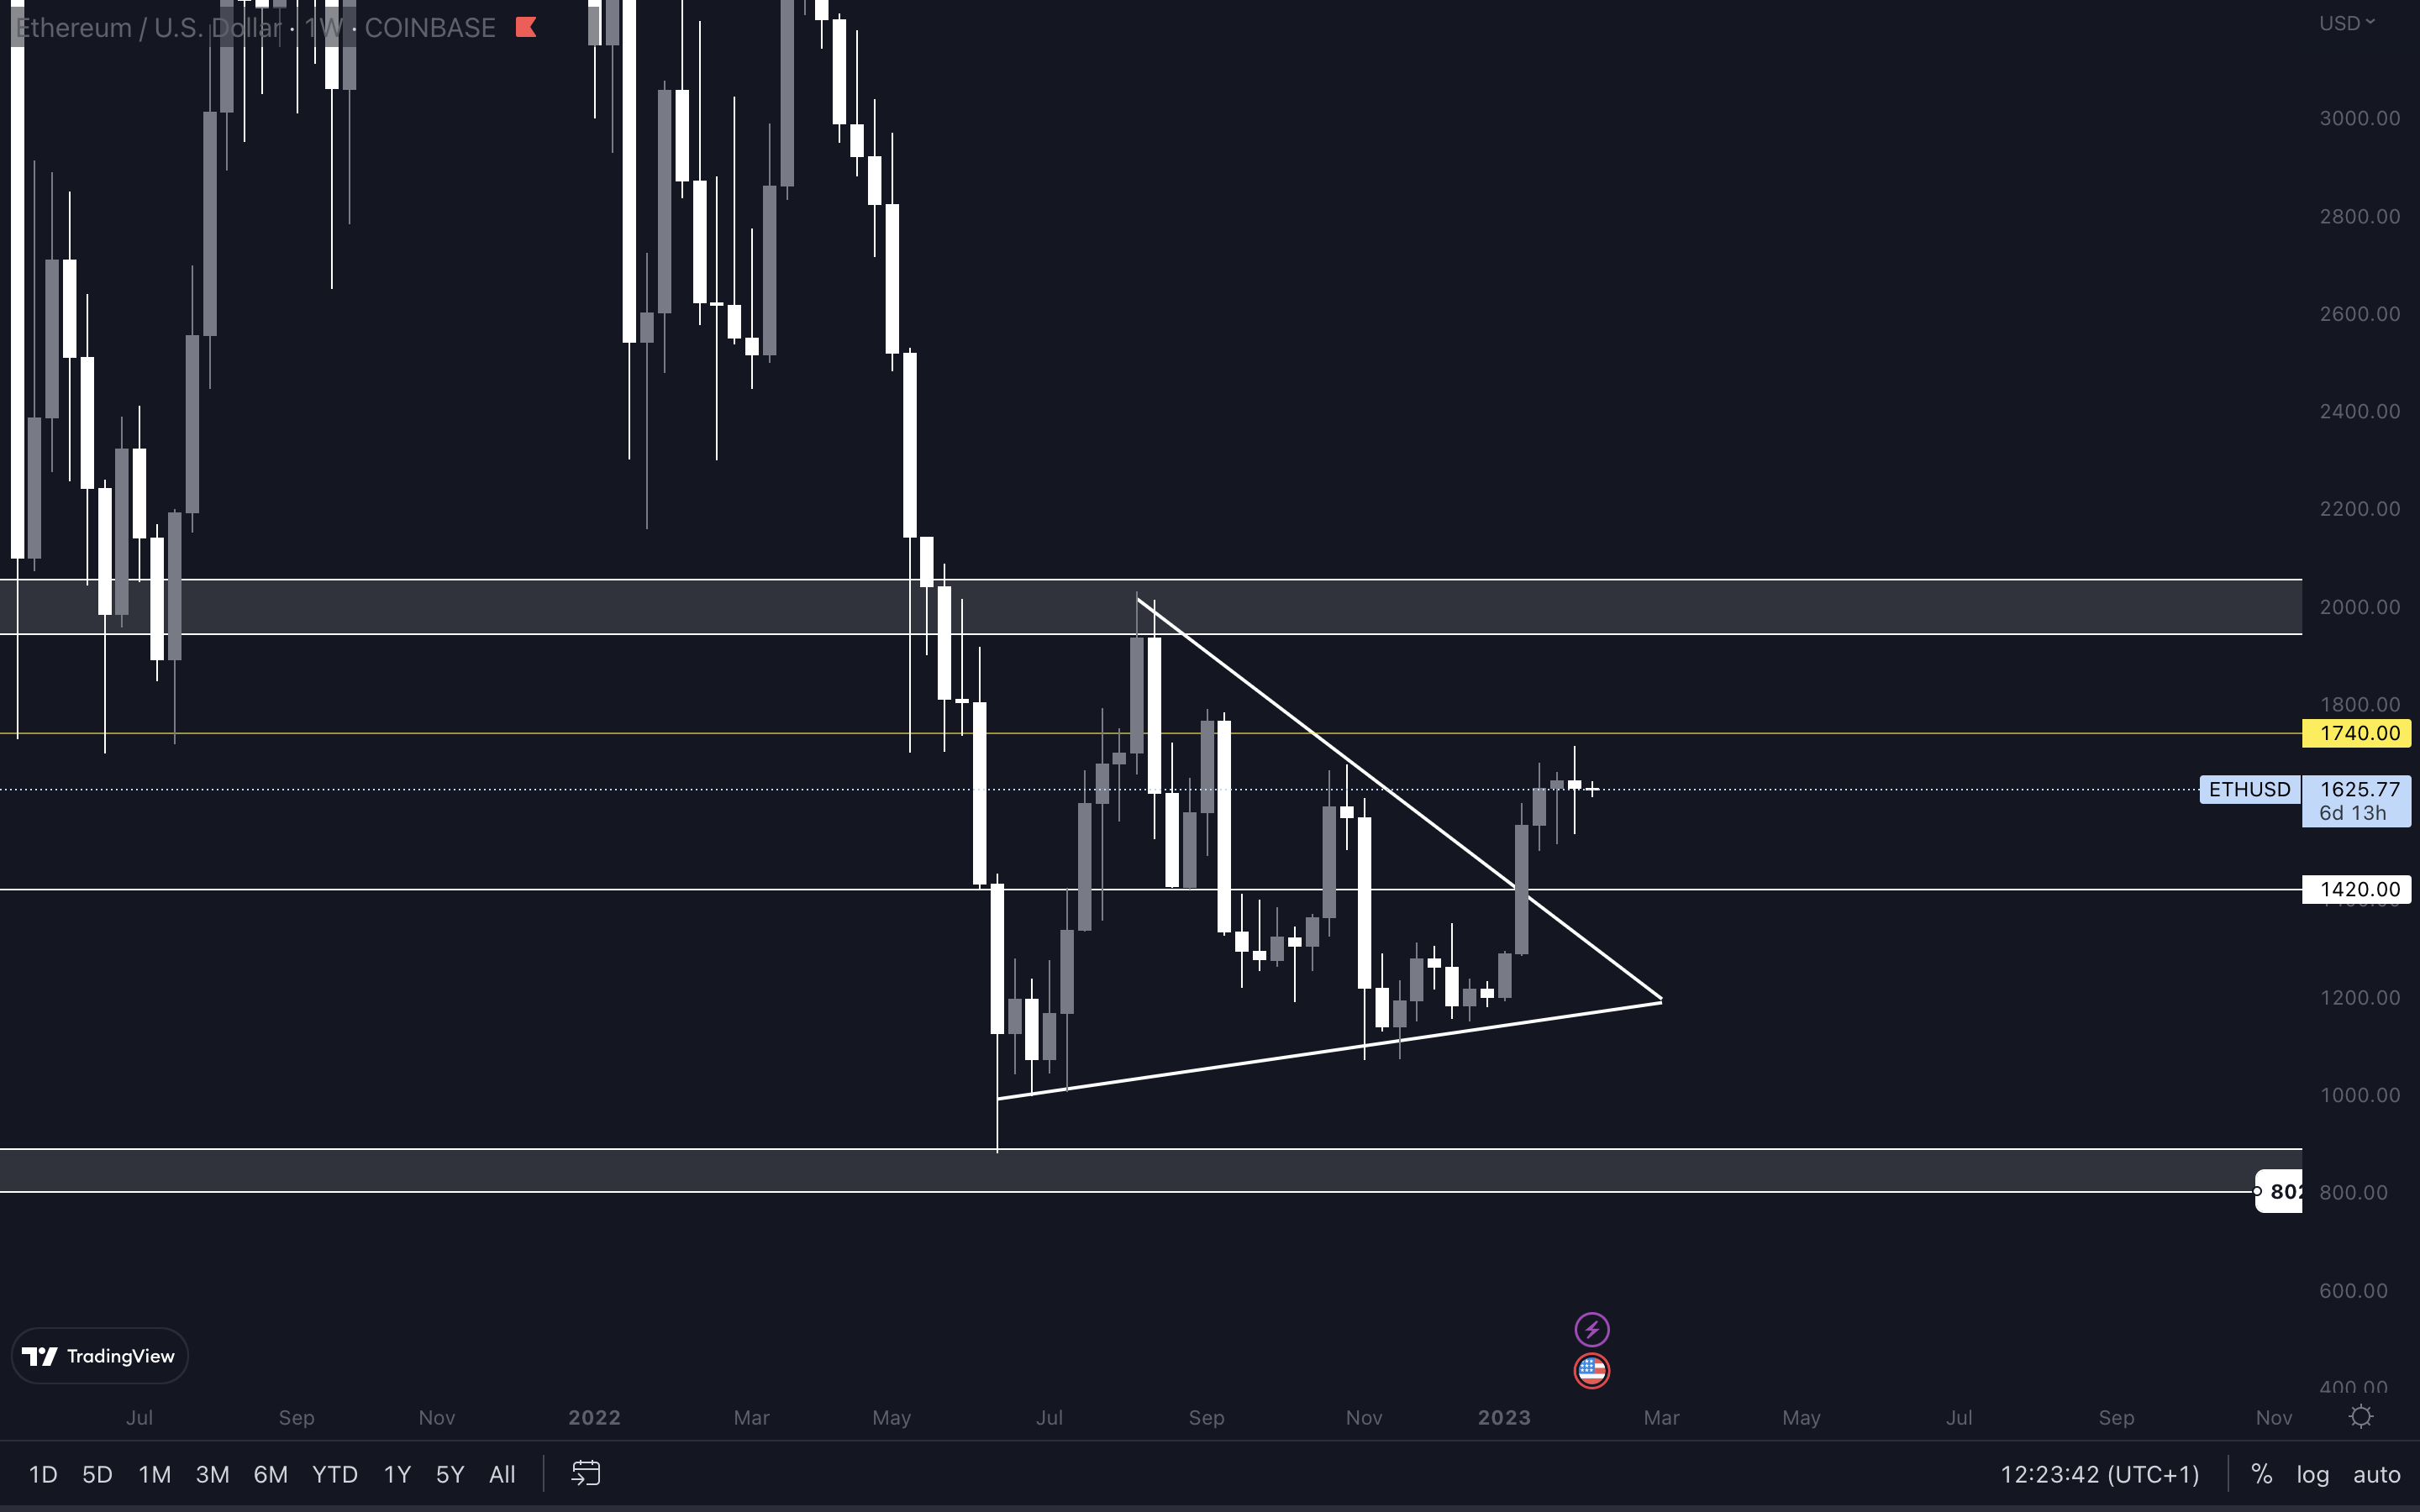
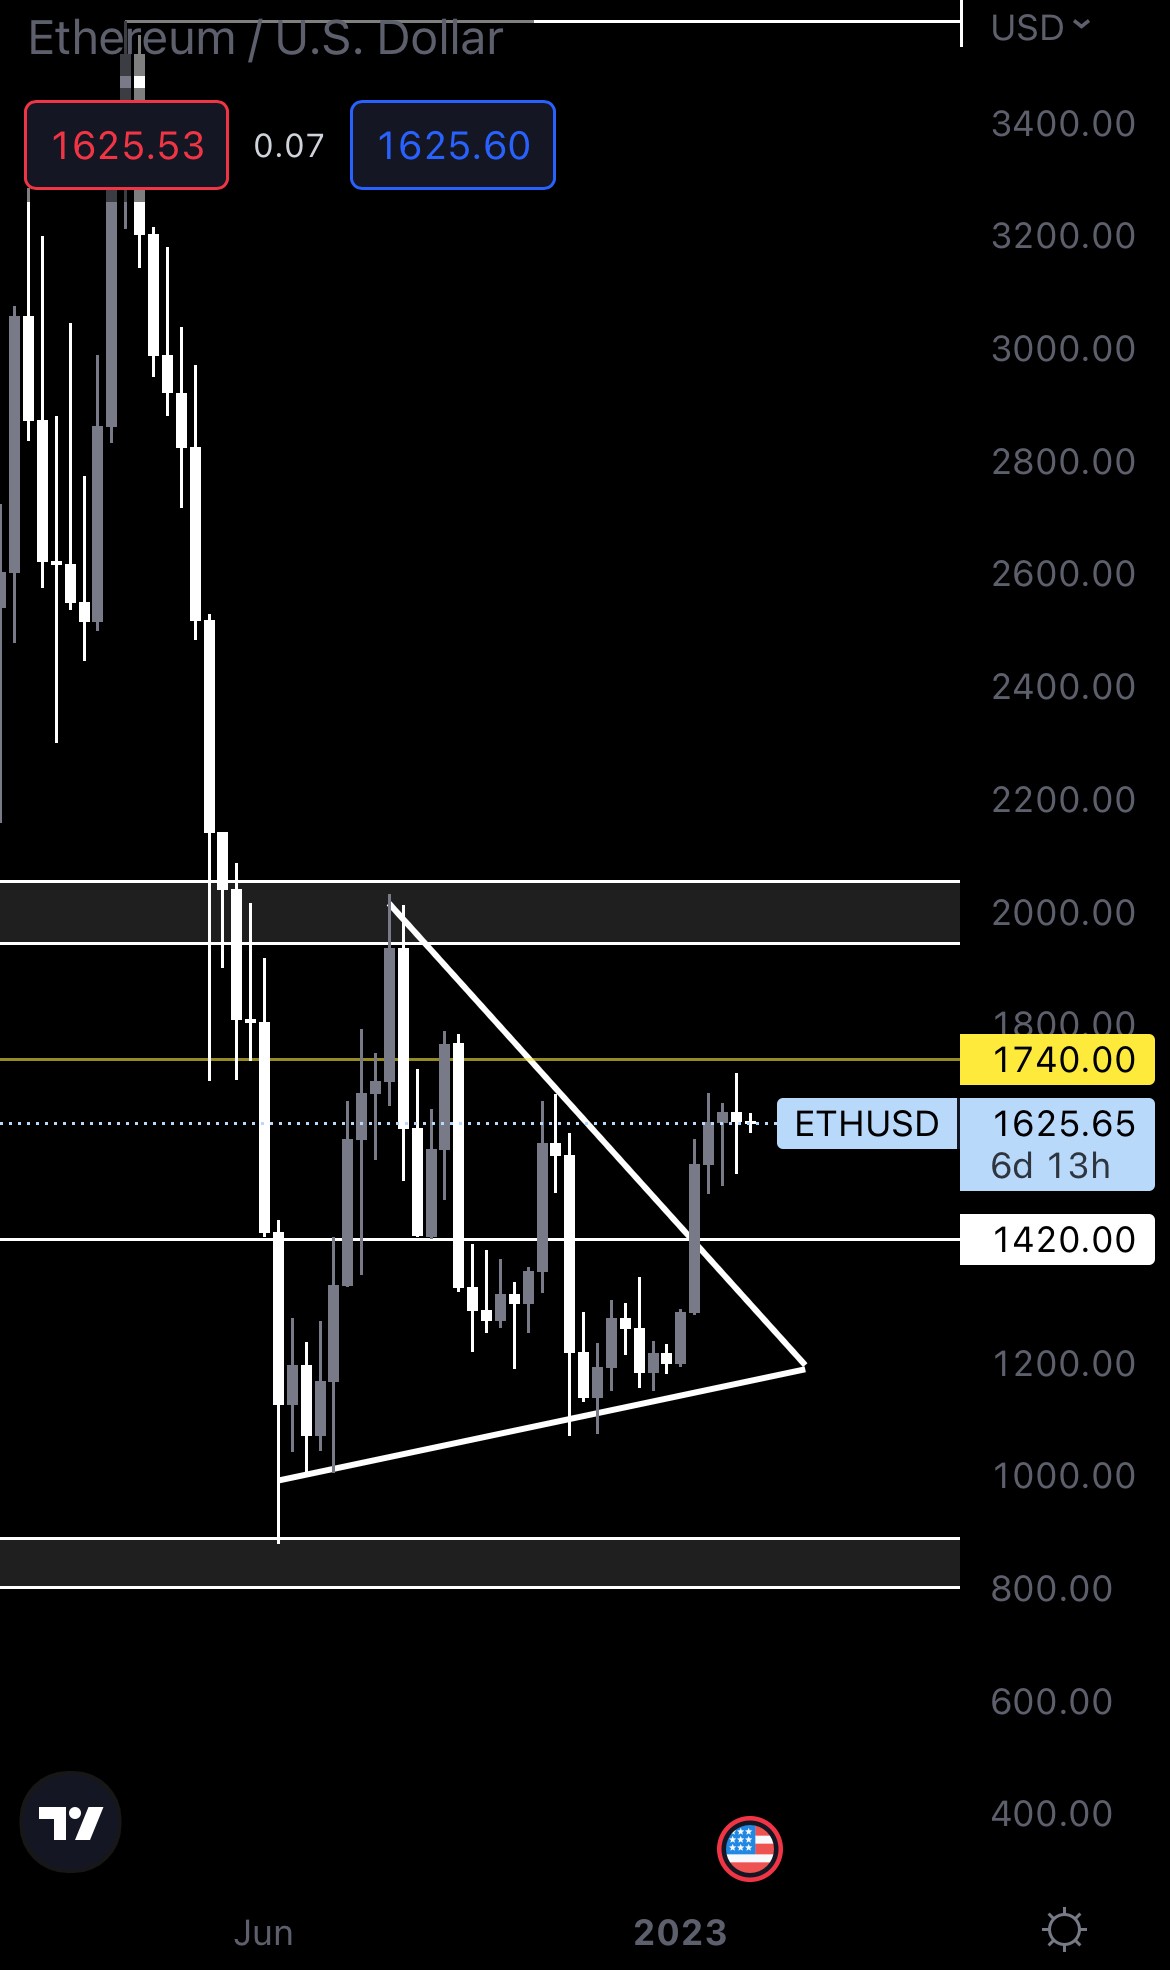
Another Doji candle here - Ether’s price action is indecisive. However, as Ether is just under resistance and the Total Market Cap is having trouble breaking above $1.03T, we can assume Ether will also head to the downside. When multiple confluences point to the same scenario, it gives us a strong indication of where we’re going. If the market does head down to retest support levels, we should expect Ether to return to $1420. This is its 2017 all-time high, so chances are we’ll see increased buying pressure once/if we test this level.
SOL | Solana
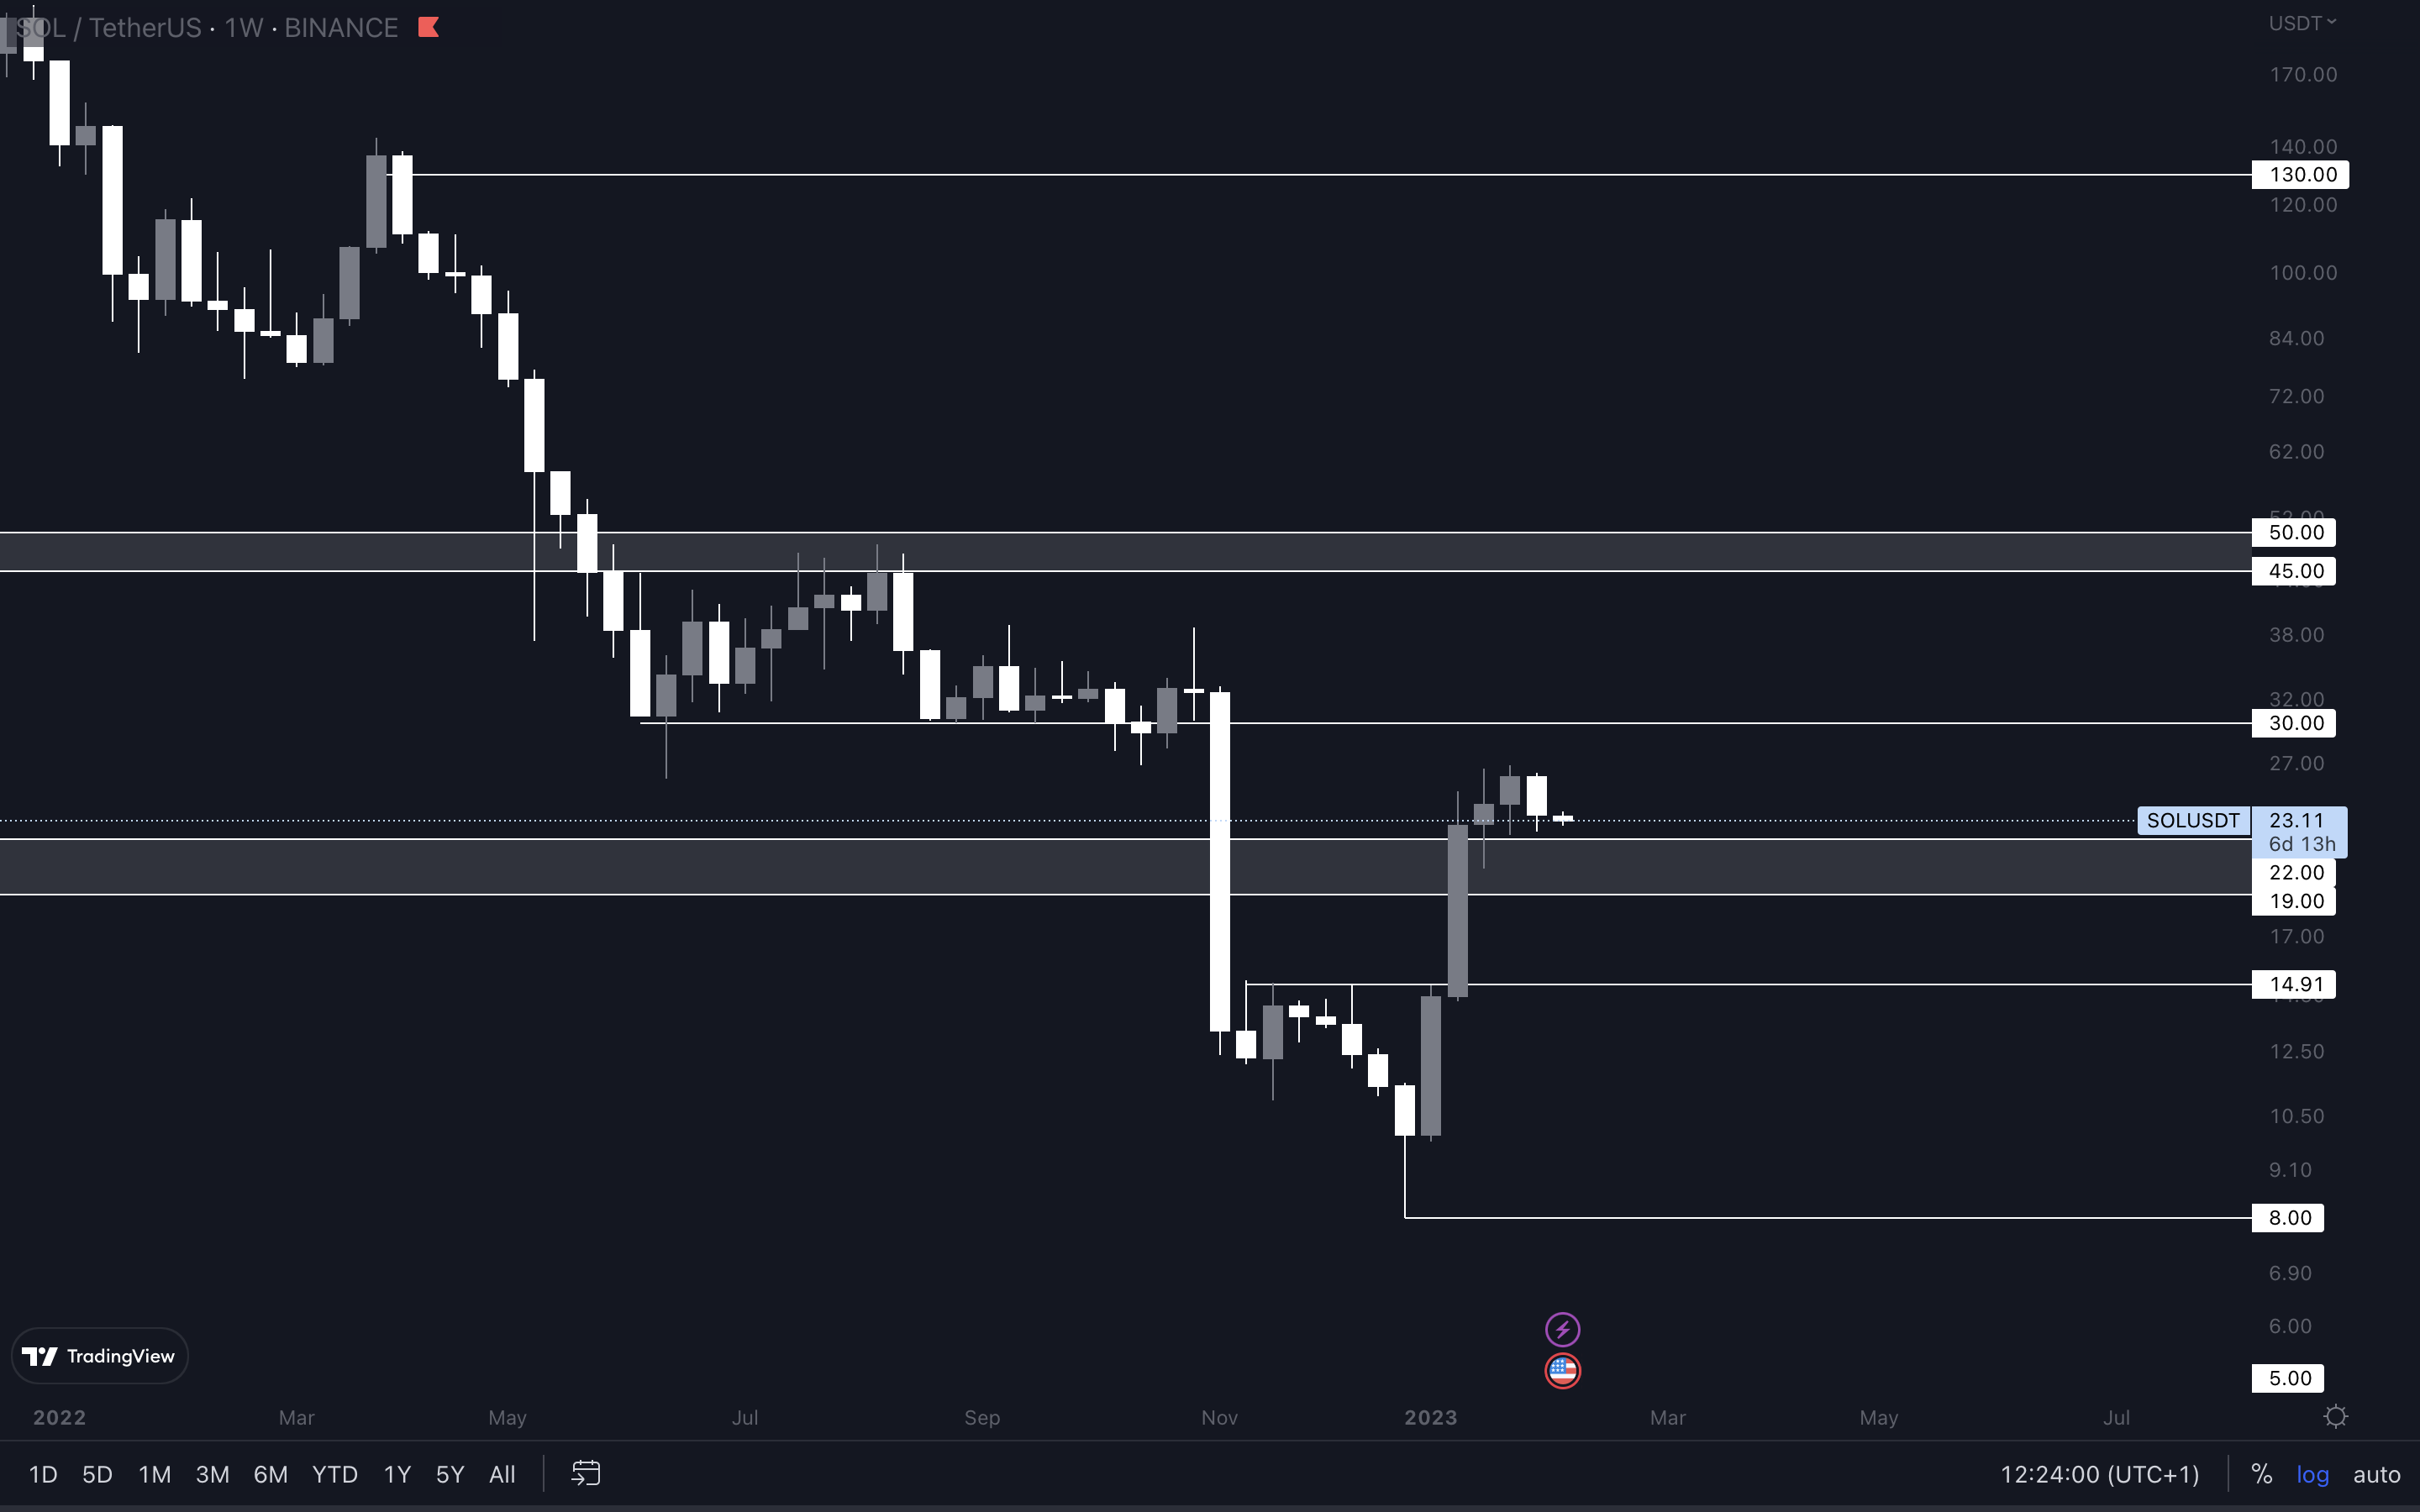
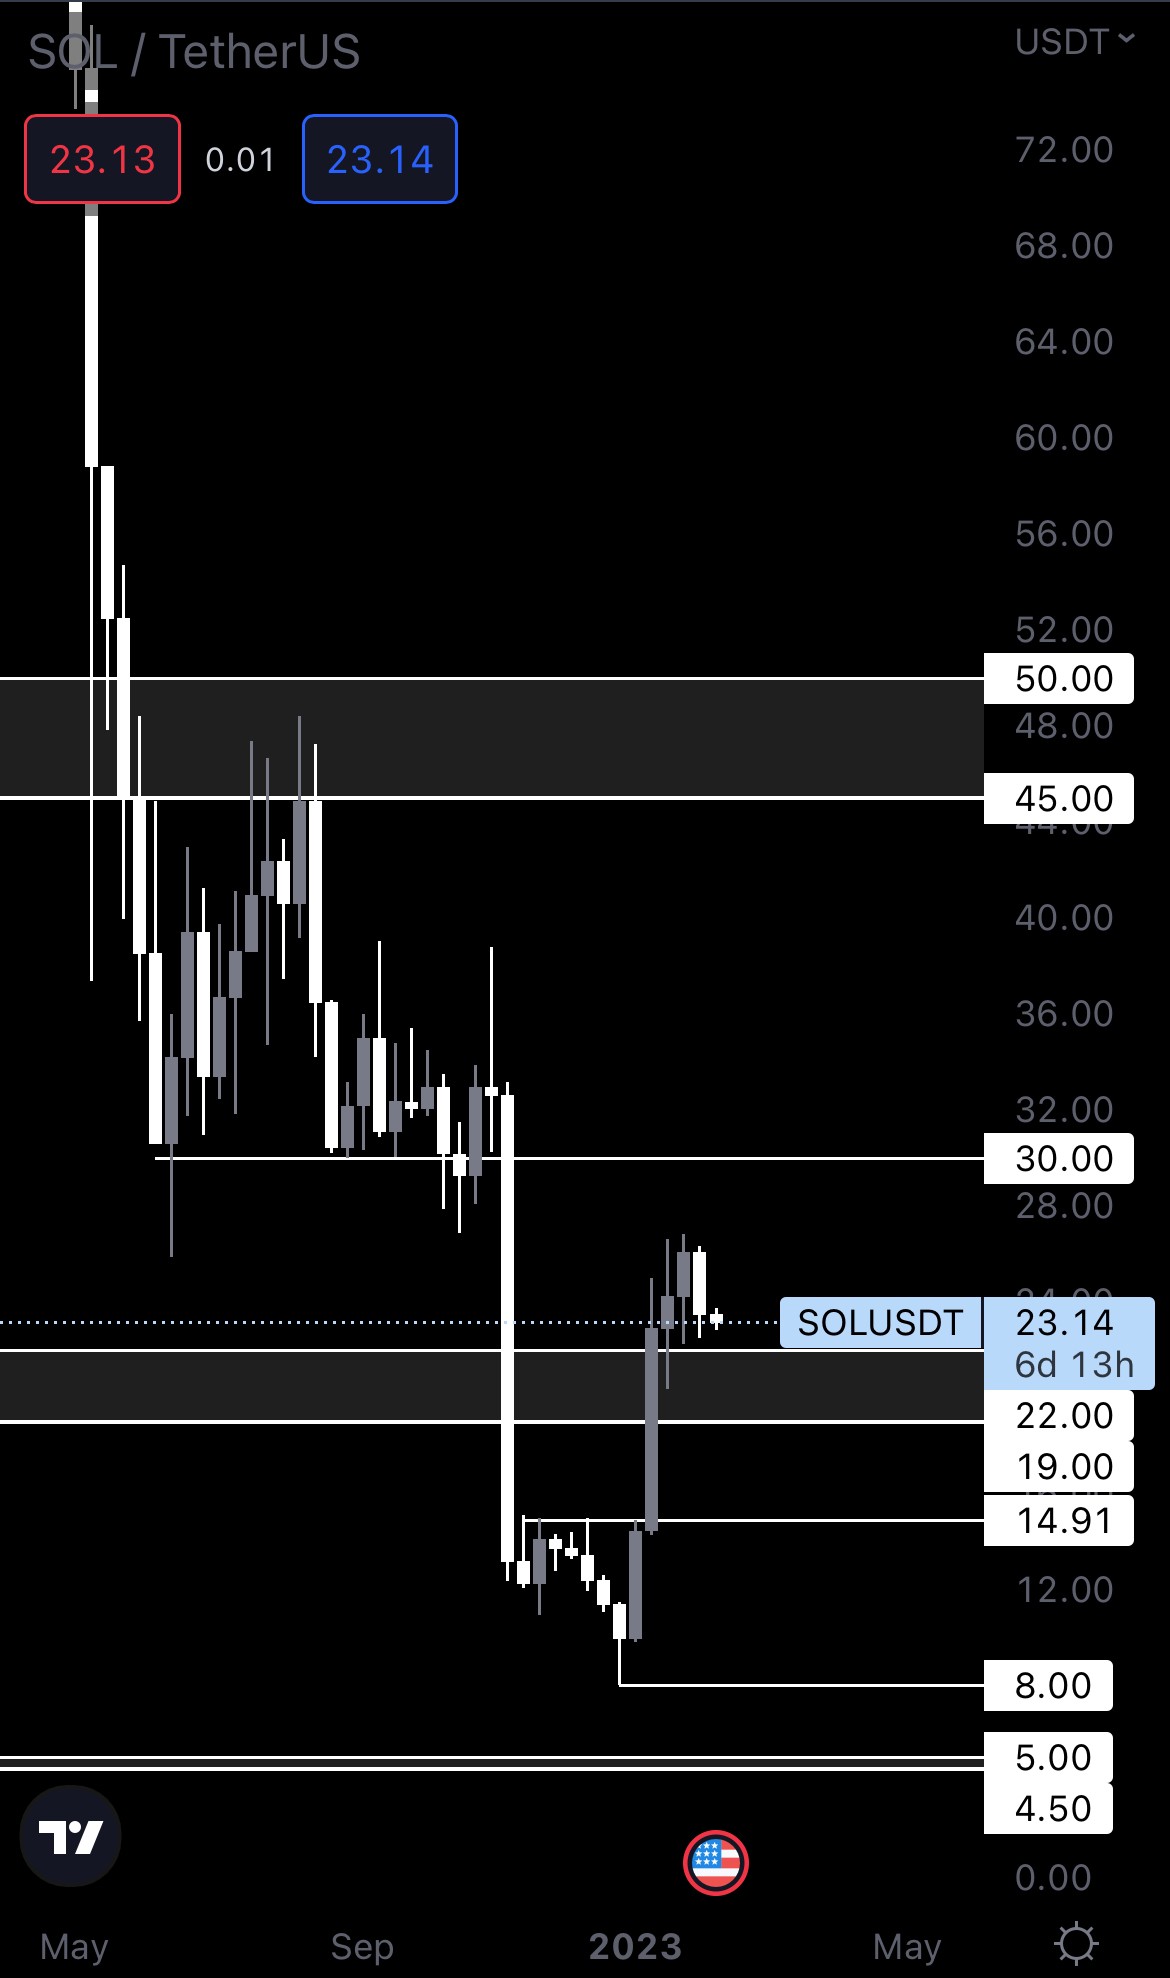
A bearish engulfing was formed on SOL last week. This suggests we’ll see the asset heading down to its $19 - $22 support area. As long as SOL doesn’t lose $19 as support on the weekly timeframe, we’re confident it can reach $30 at some point in the coming weeks.
RUNE | THORChain

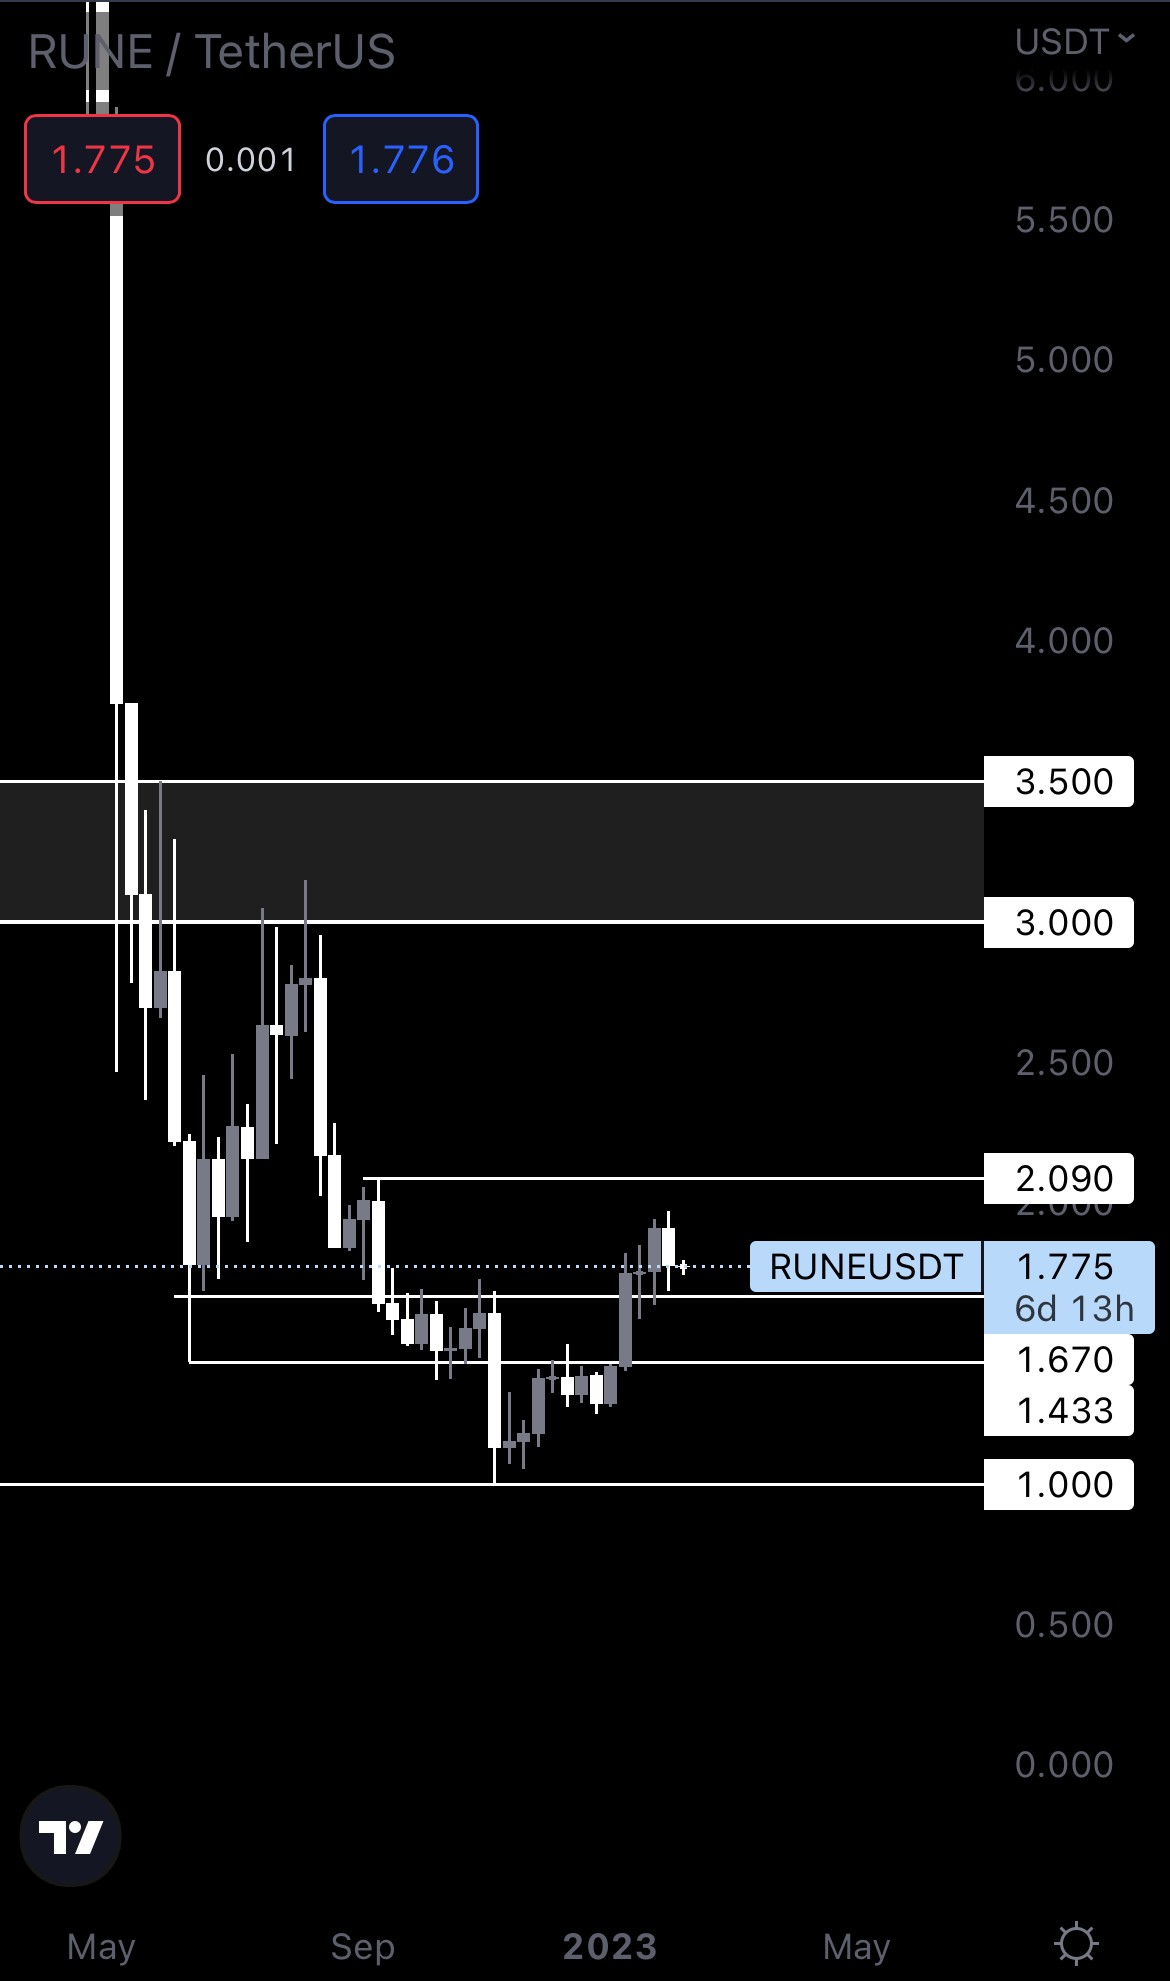
Because RUNE is above support, it’s hard to successfully predict which direction the asset will take. Given that both indexes and the majors (BTC and ETH) are pointing to some downside in the short term, know that RUNE will likely follow the same direction. If it loses $1.67 as support, $1.43 is on the cards. Until then, expect ranging between $1.67 and $2.09 until either of these levels is broken. We don’t view $1.67 as a solid entry point for a trade if that’s what you’re looking for, because it could easily be lost. Instead, $1.43 is a much better level to enter from, if we even get there.
SNX | Synthetix
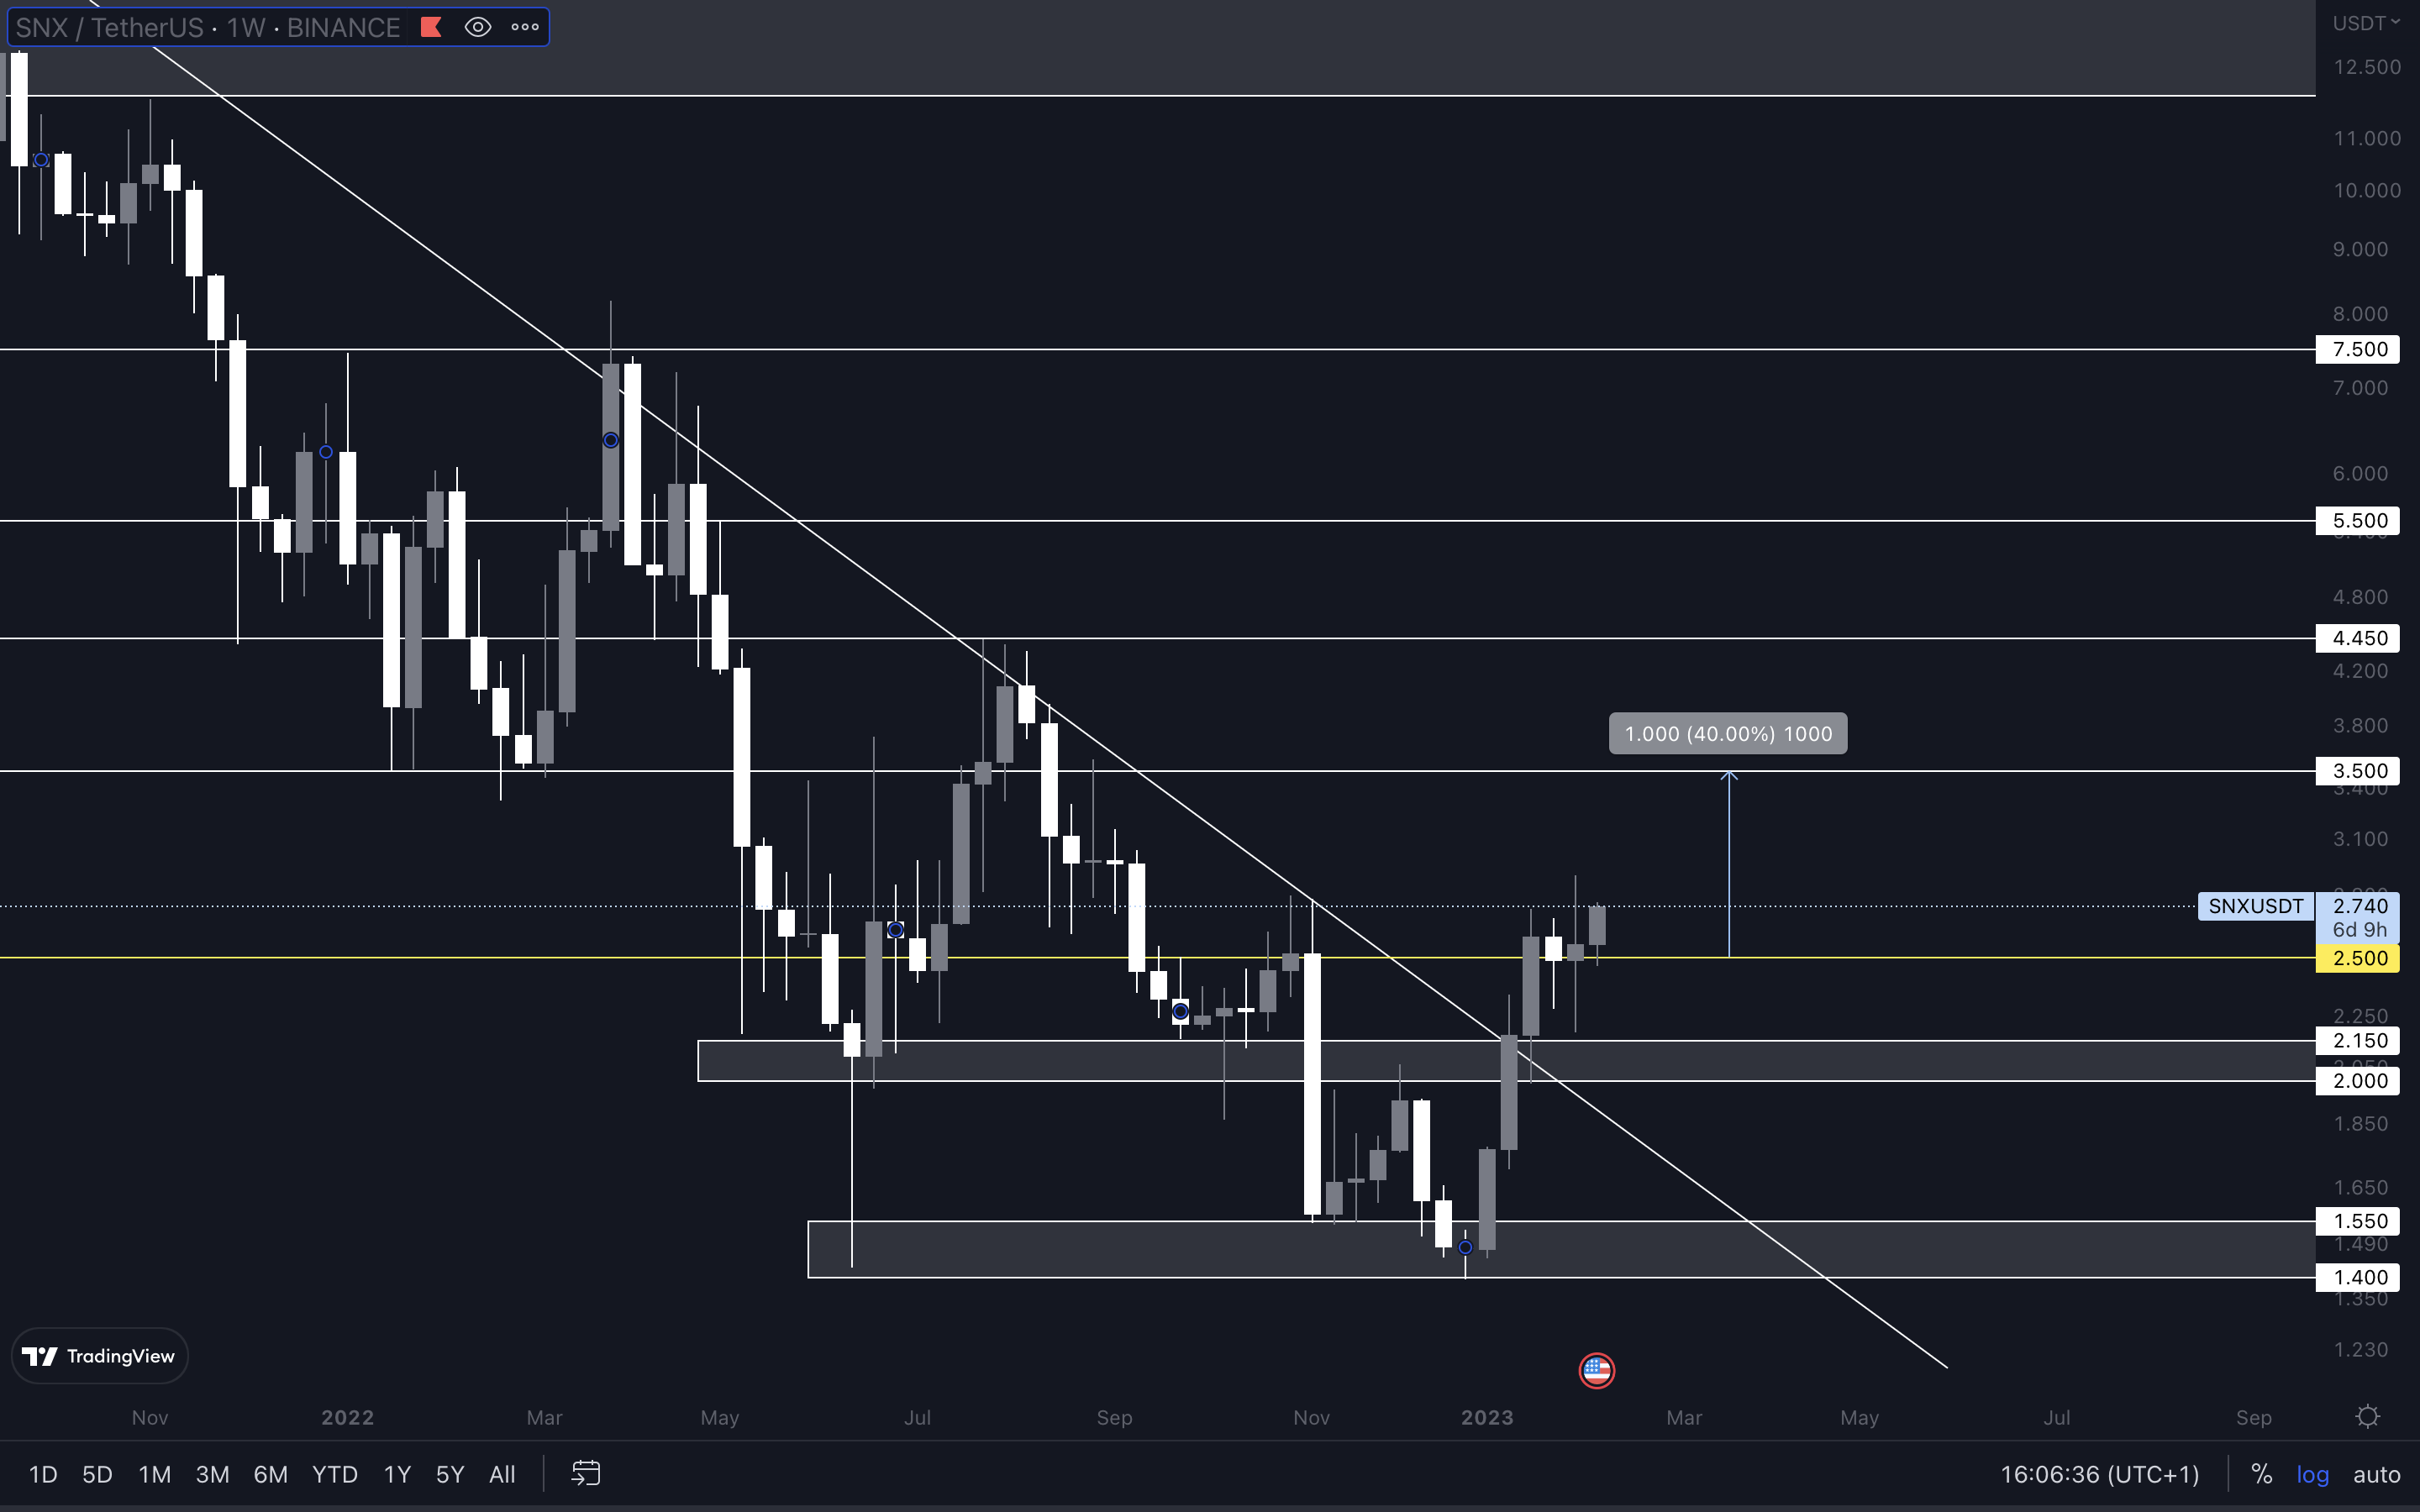
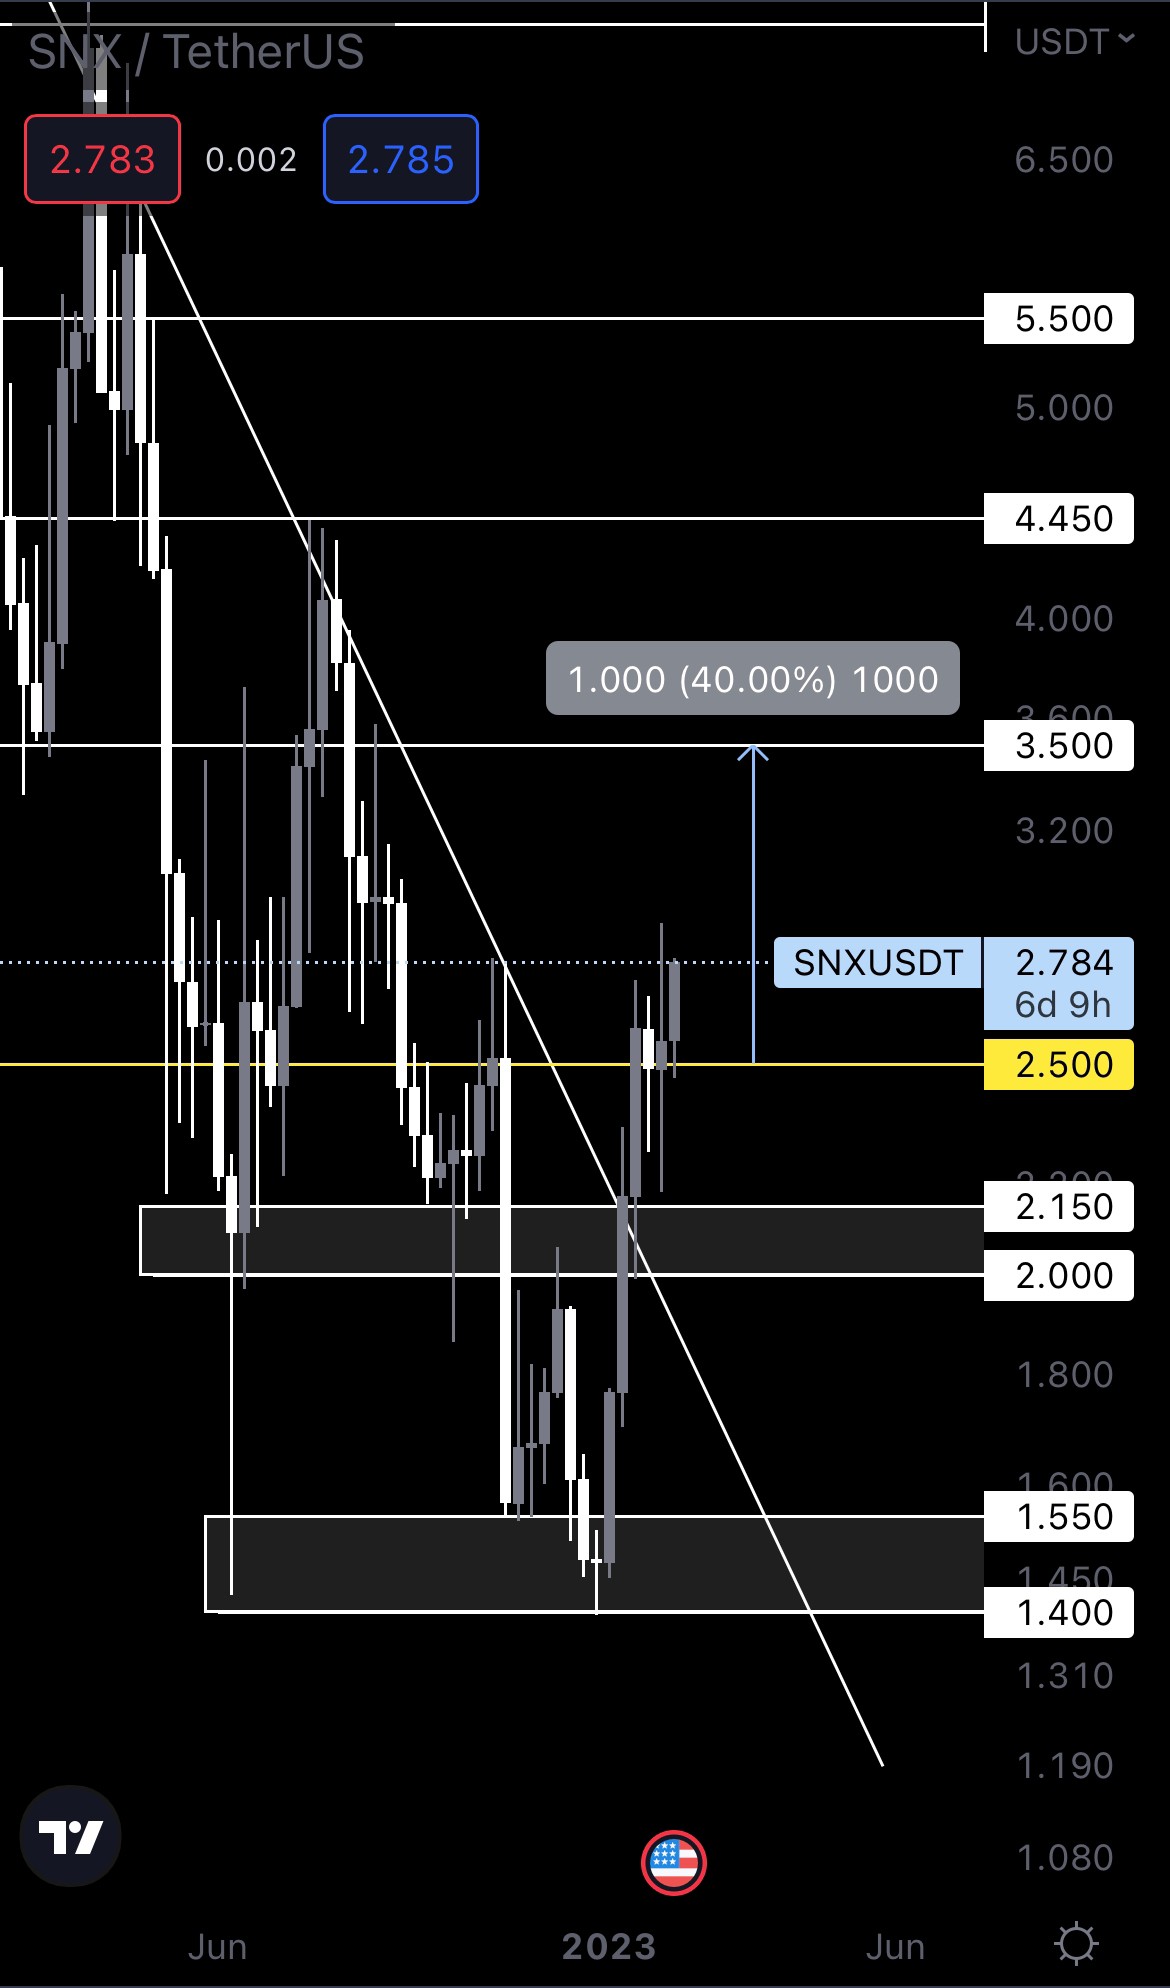
Although SNX managed to close last week’s candle above $2.50, we can’t help but think that the asset isn’t ready to sustain a move to $3.50 on its own. For SNX to reach $3.50, we’ll need BTC to perform well, or at least consolidate. A bad-performing BTC will force SNX to go down and invalidate the weekly reclaim of $2.50. For that reason, we wouldn’t recommend jumping on this just yet. We need to wait for stronger confirmation that upside will continue, and we don’t have that yet. Even if SNX might reach $3.50, it’s not something we can successfully predict. We gotta stick with the facts here.
dYdX | DYDX
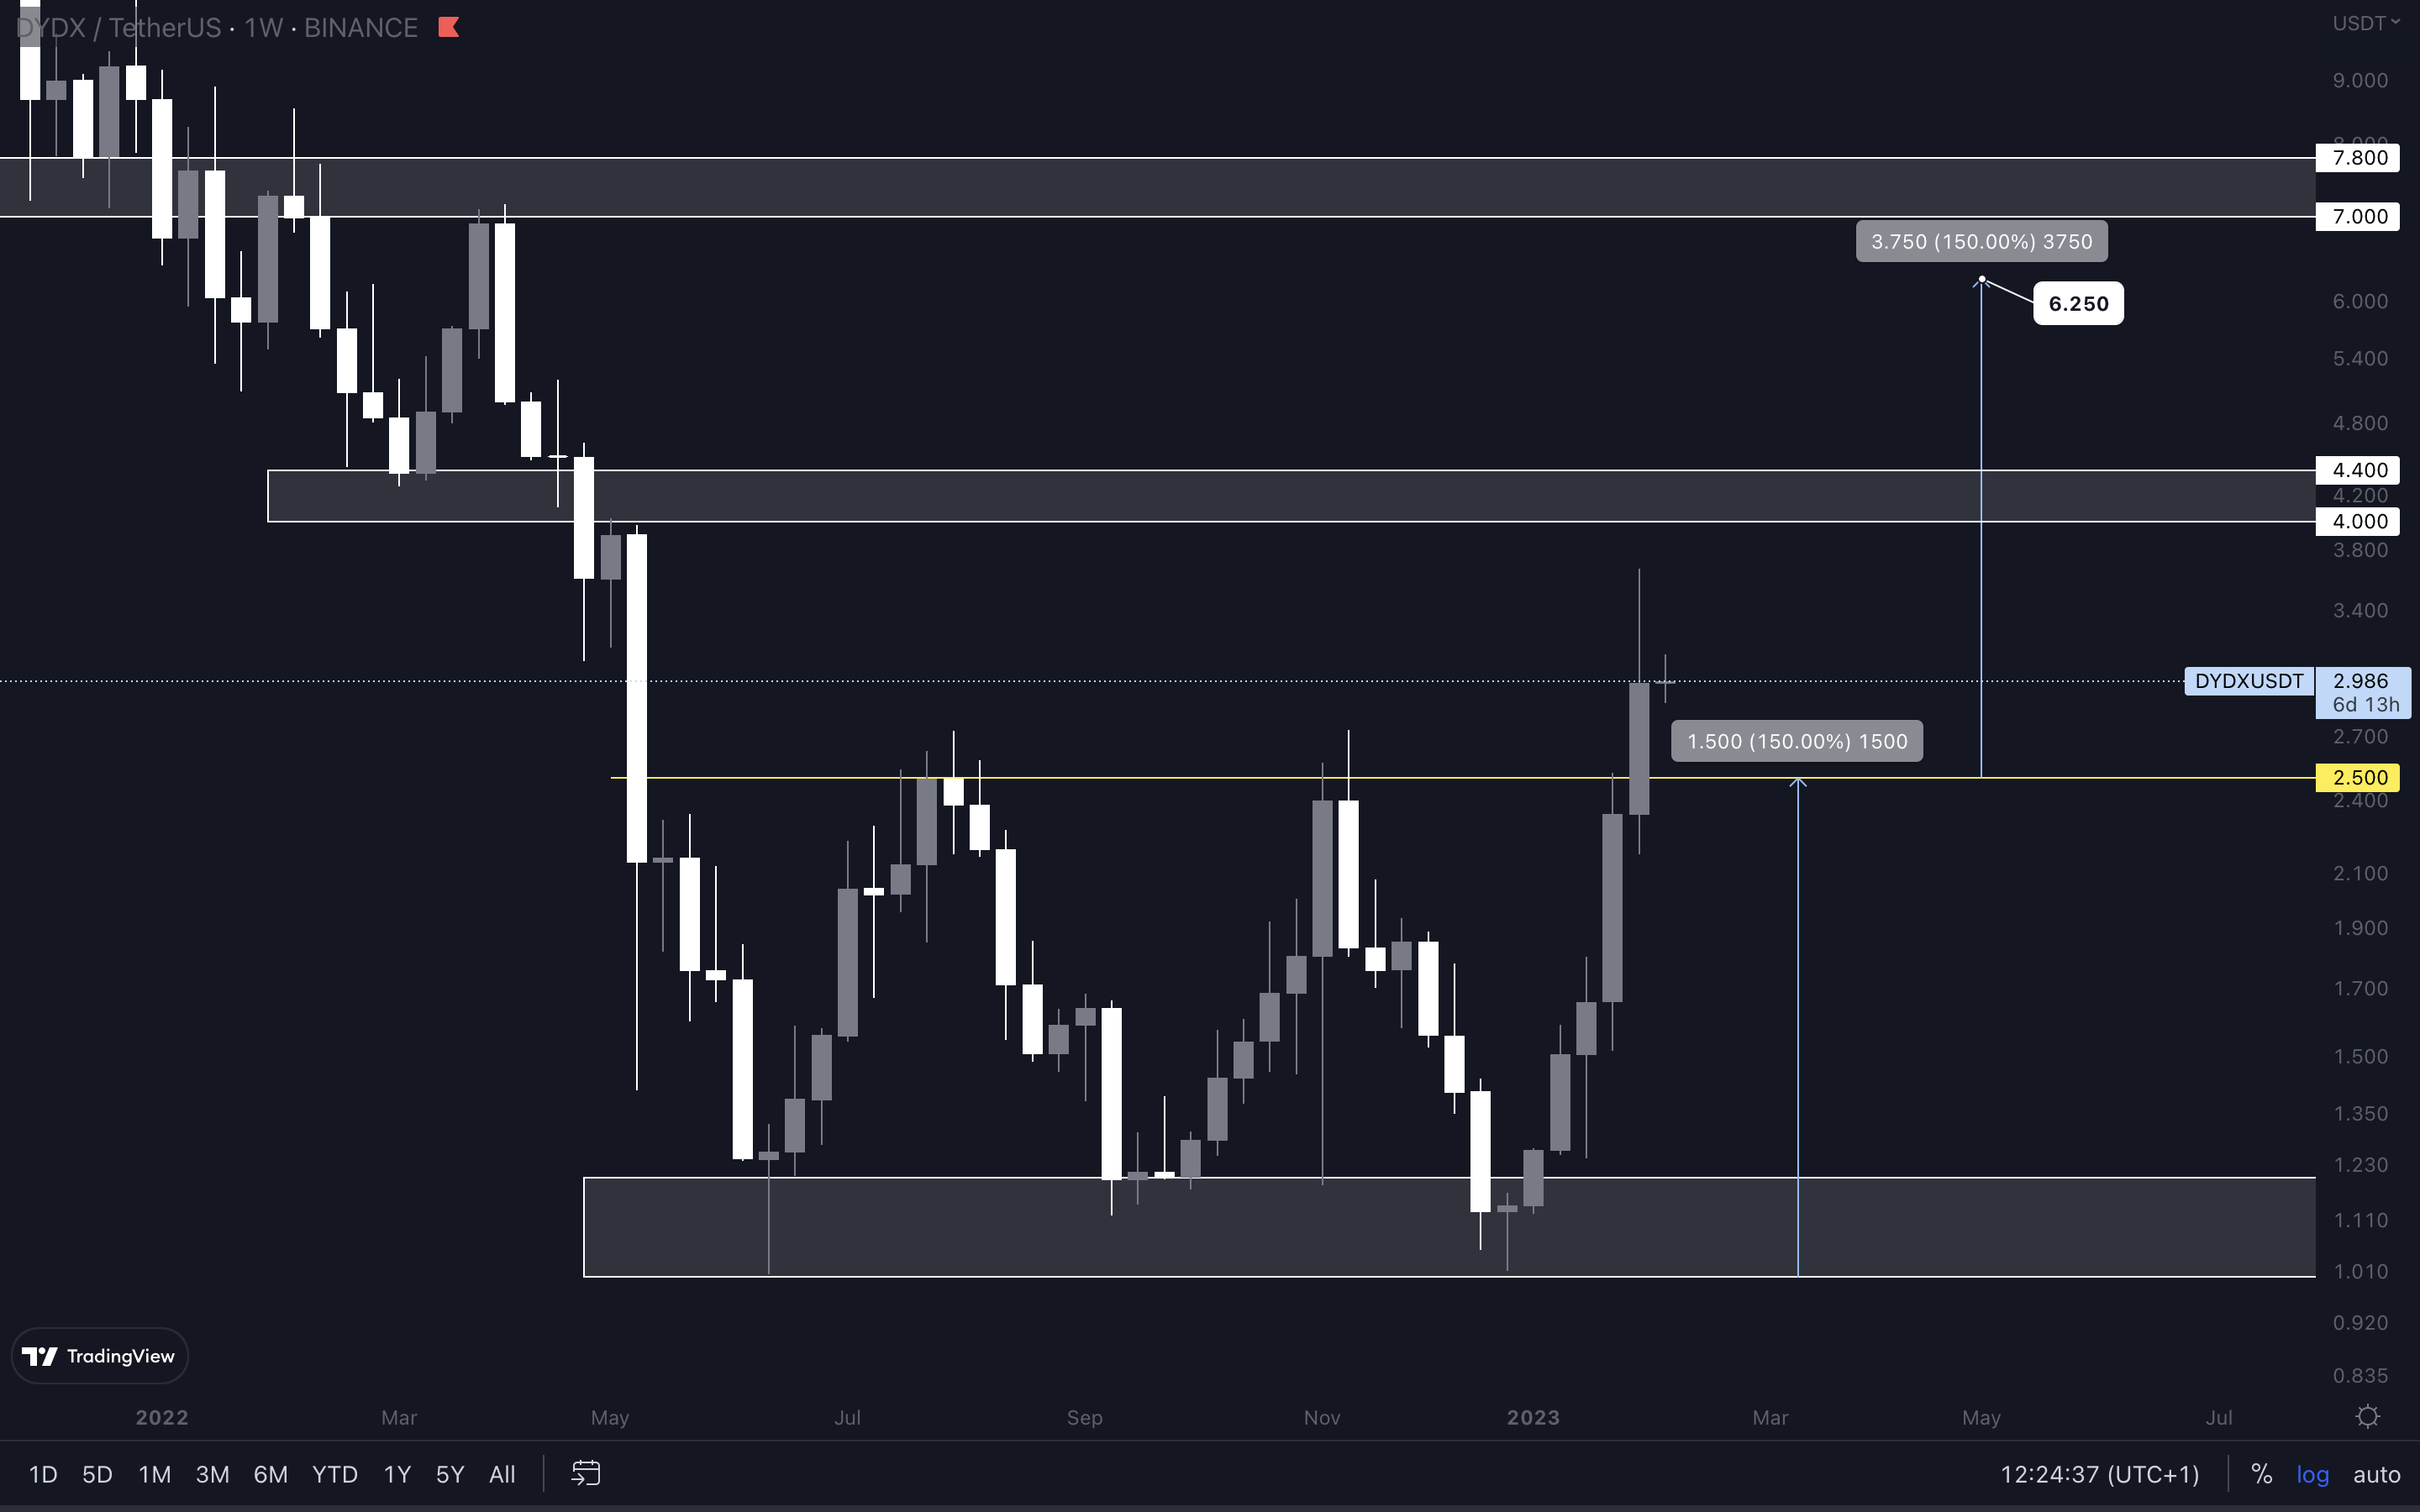
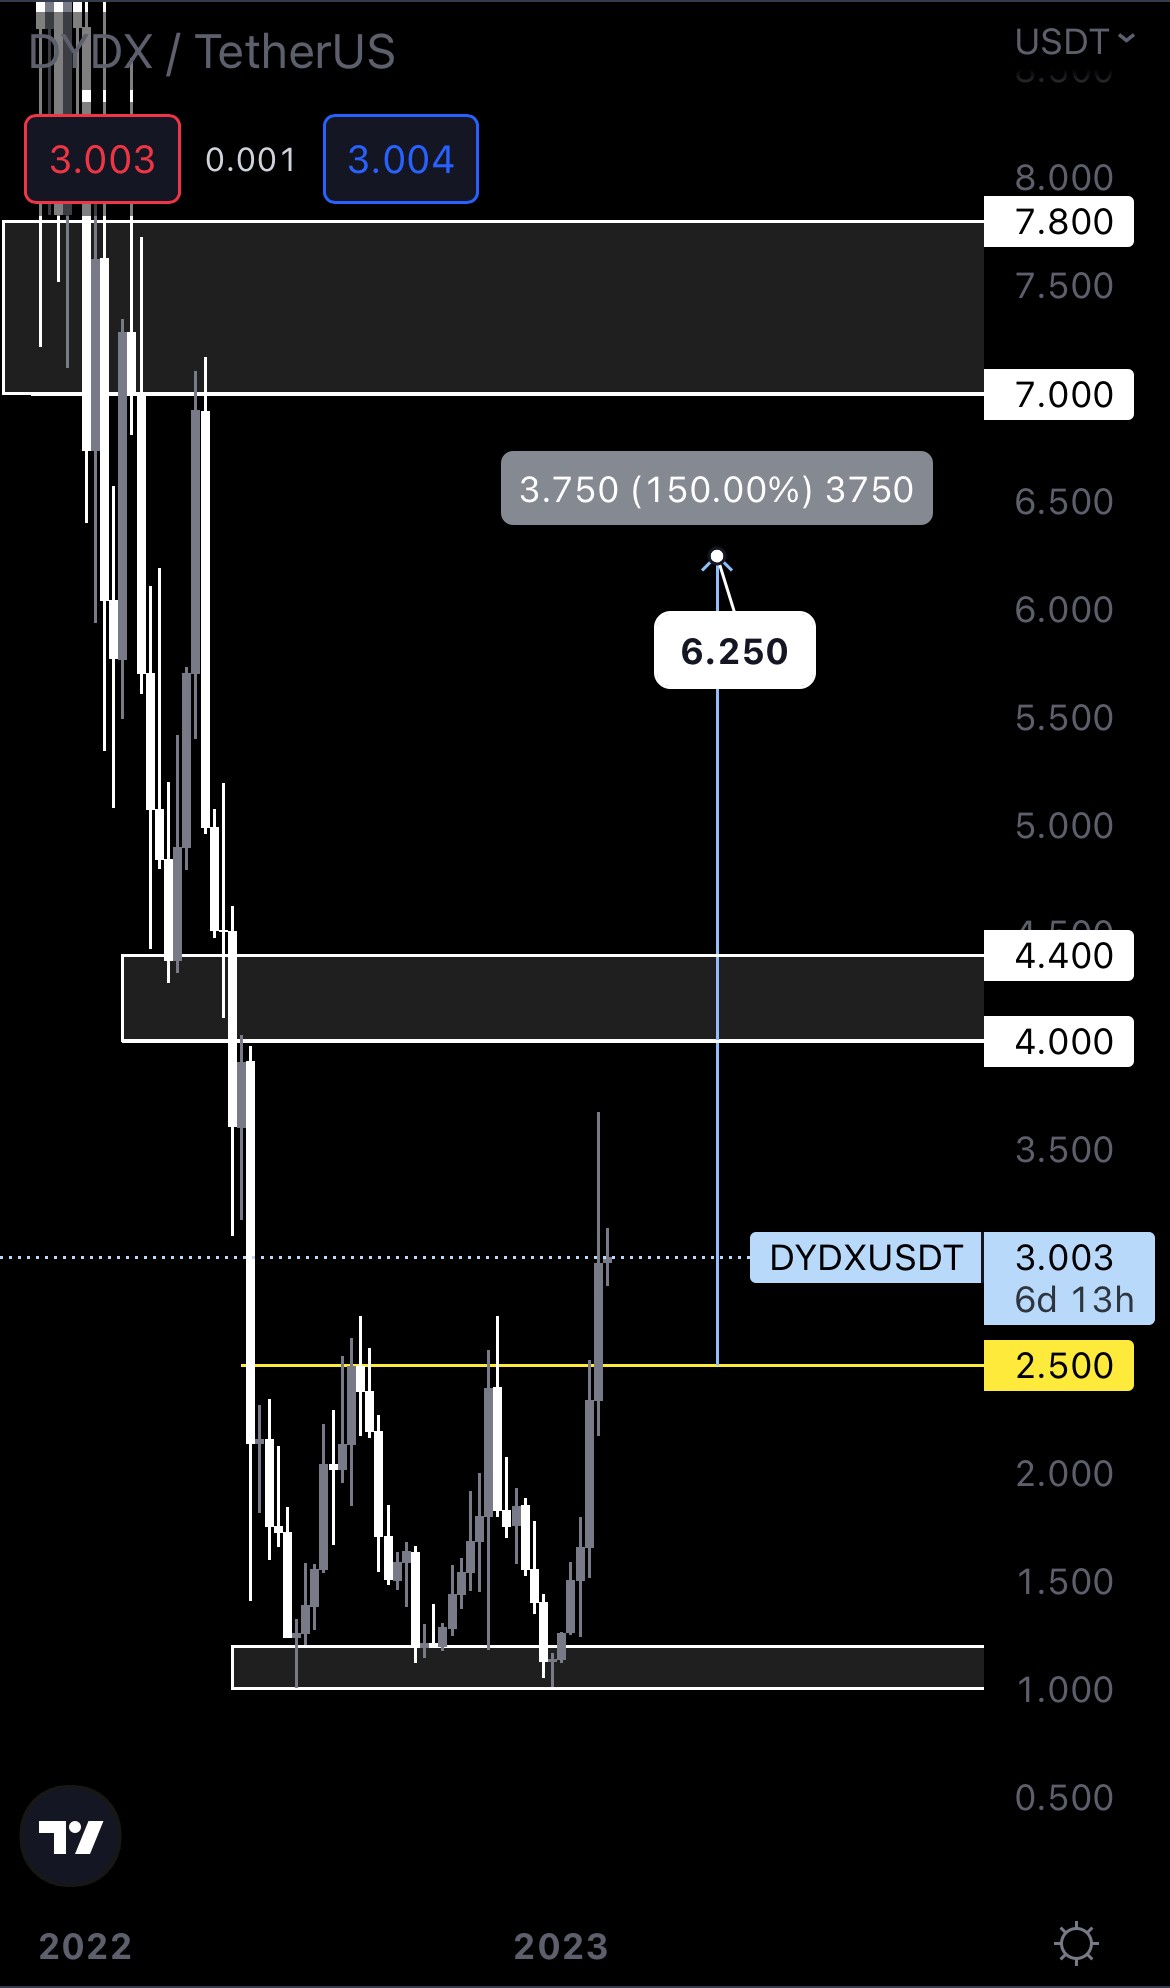
DYDX closed last week’s candle above $2.50, so this level has now been reclaimed on the weekly timeframe. nly a weekly candle closing under $2.50 would invalidate DYDX’s triple bottom. If you’rethinking of entering now, don’t. We recommend waiting for either $2.50 to be tested as support, or a reclaim of the $4 - $4.40 resistance area, which would put $7 on the cards. Given that the rest of the market is showing downside signals in the short term, buying now could be a bad decision, as DYDX could be heading toward $2.50 soon. Overall, we’re confident DYDX will see higher prices throughout Q1 and Q2.
Cryptonary's Watchlist
DOT | Polkadot
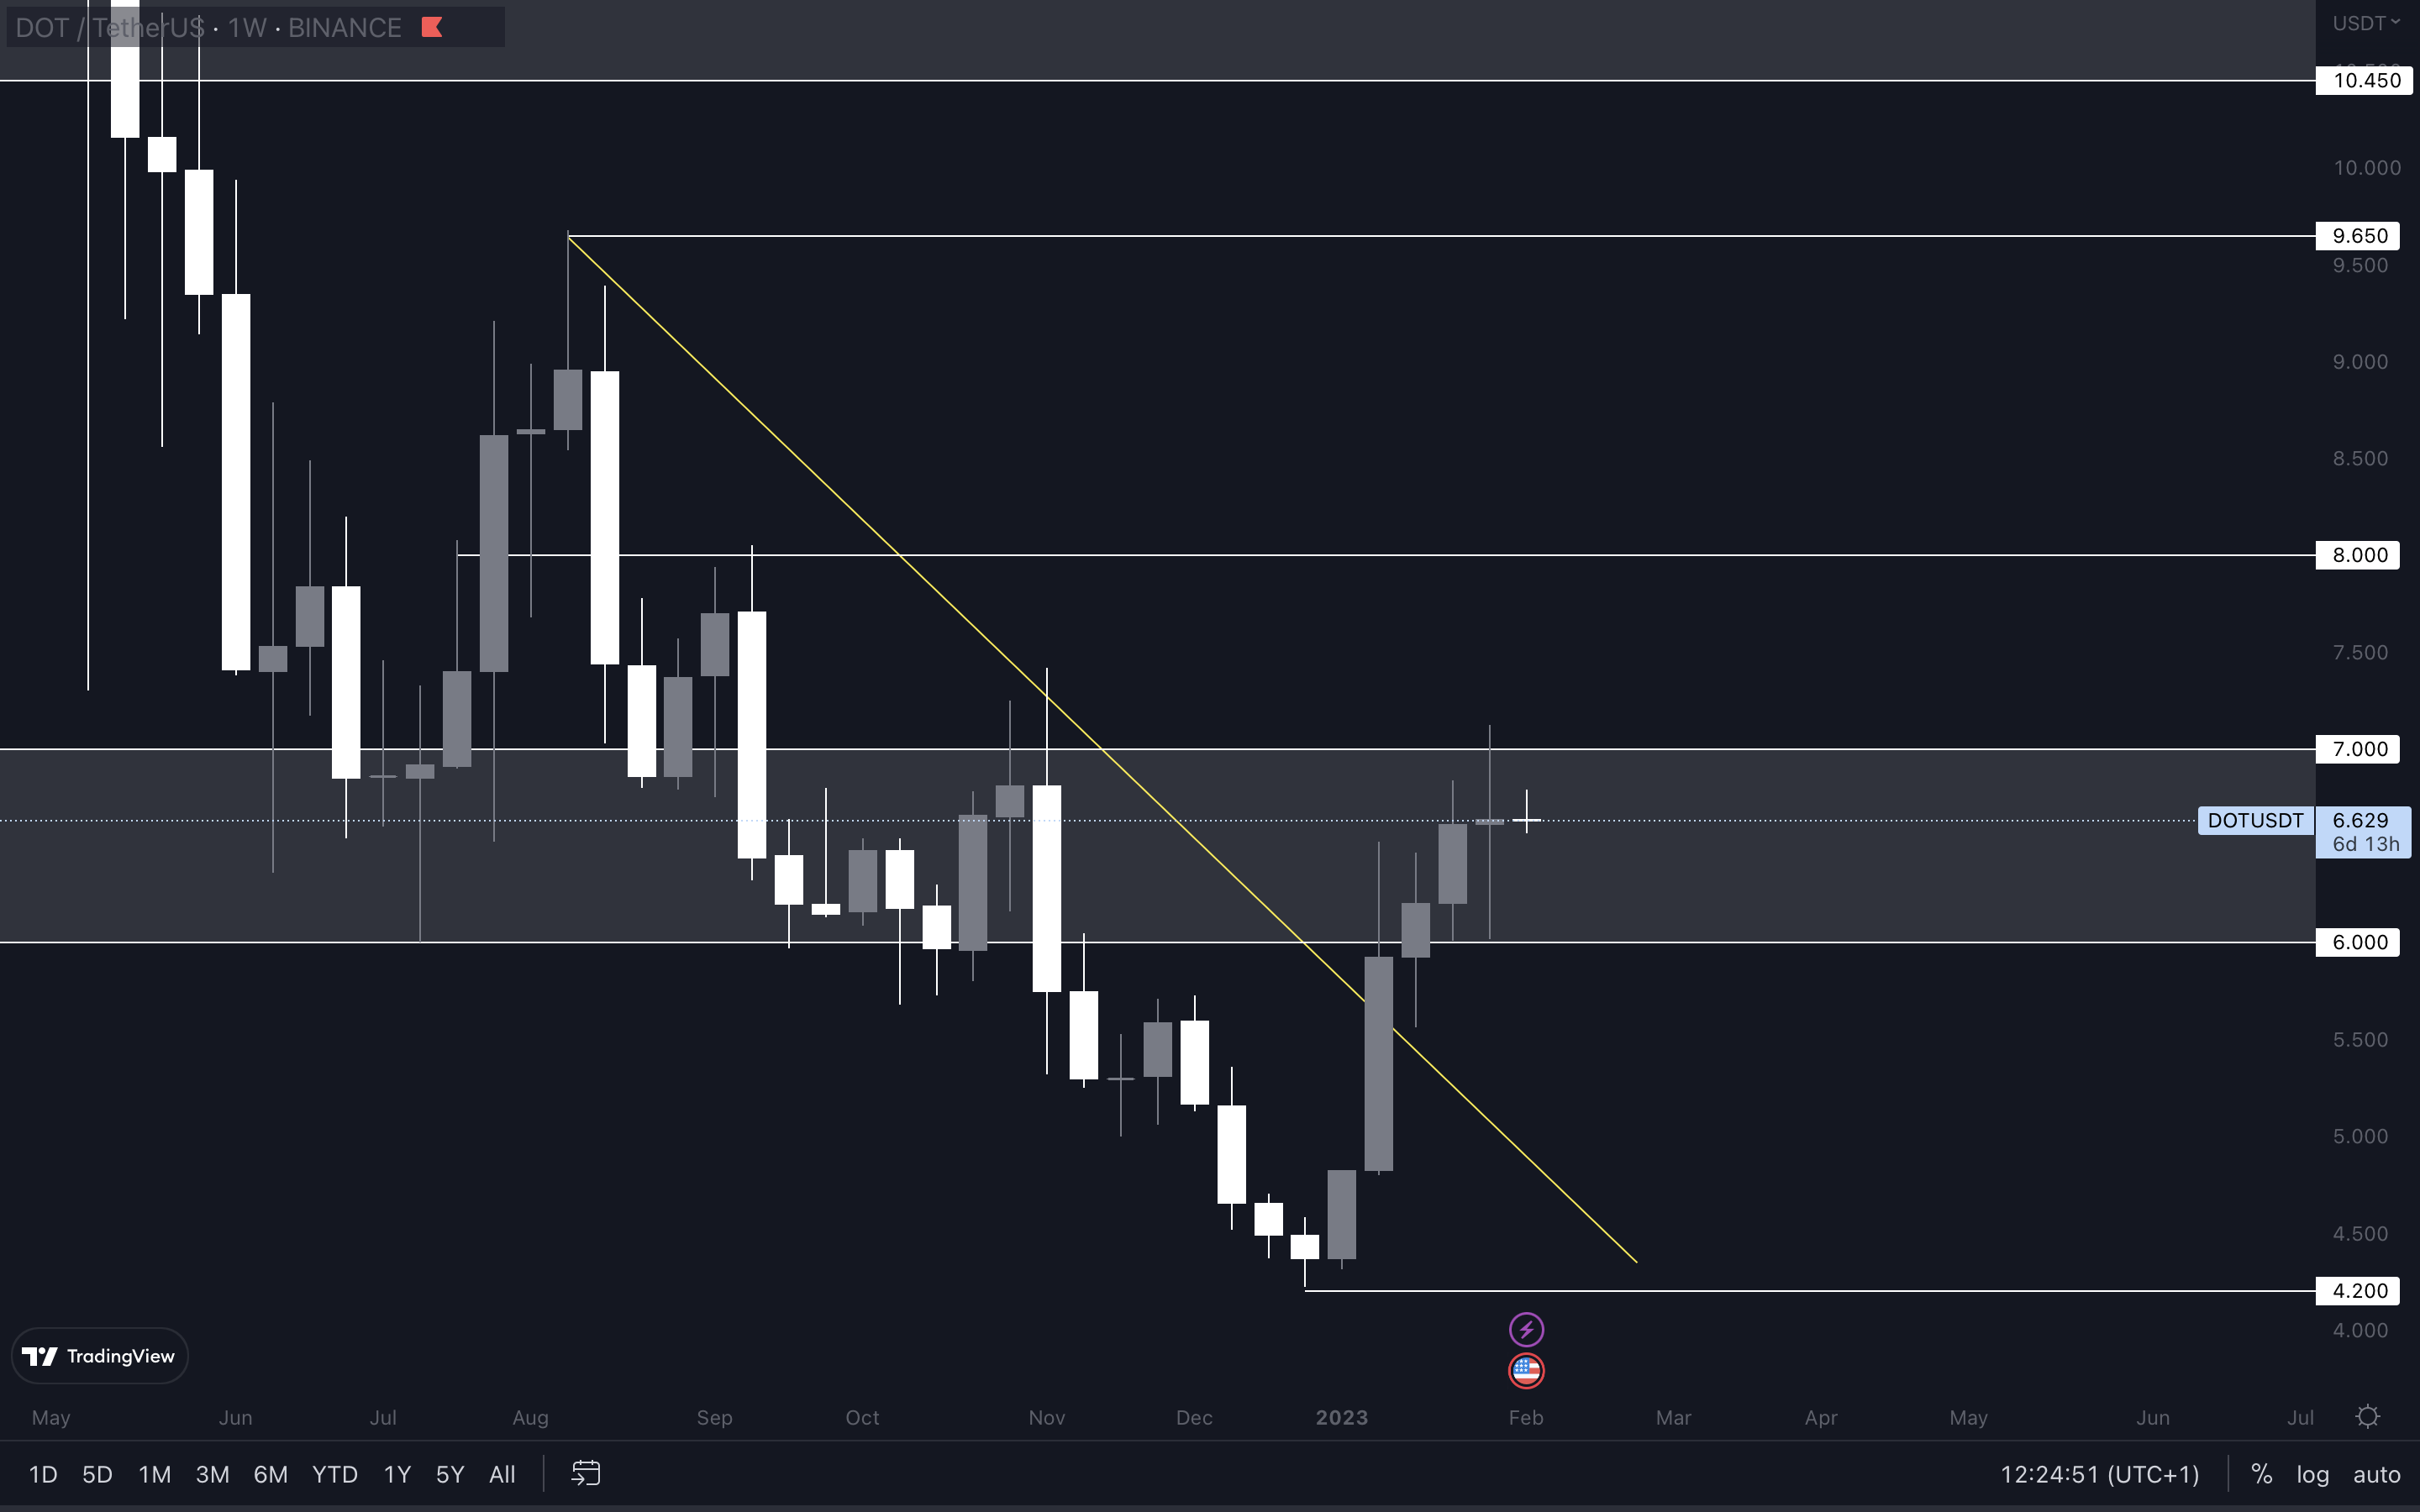
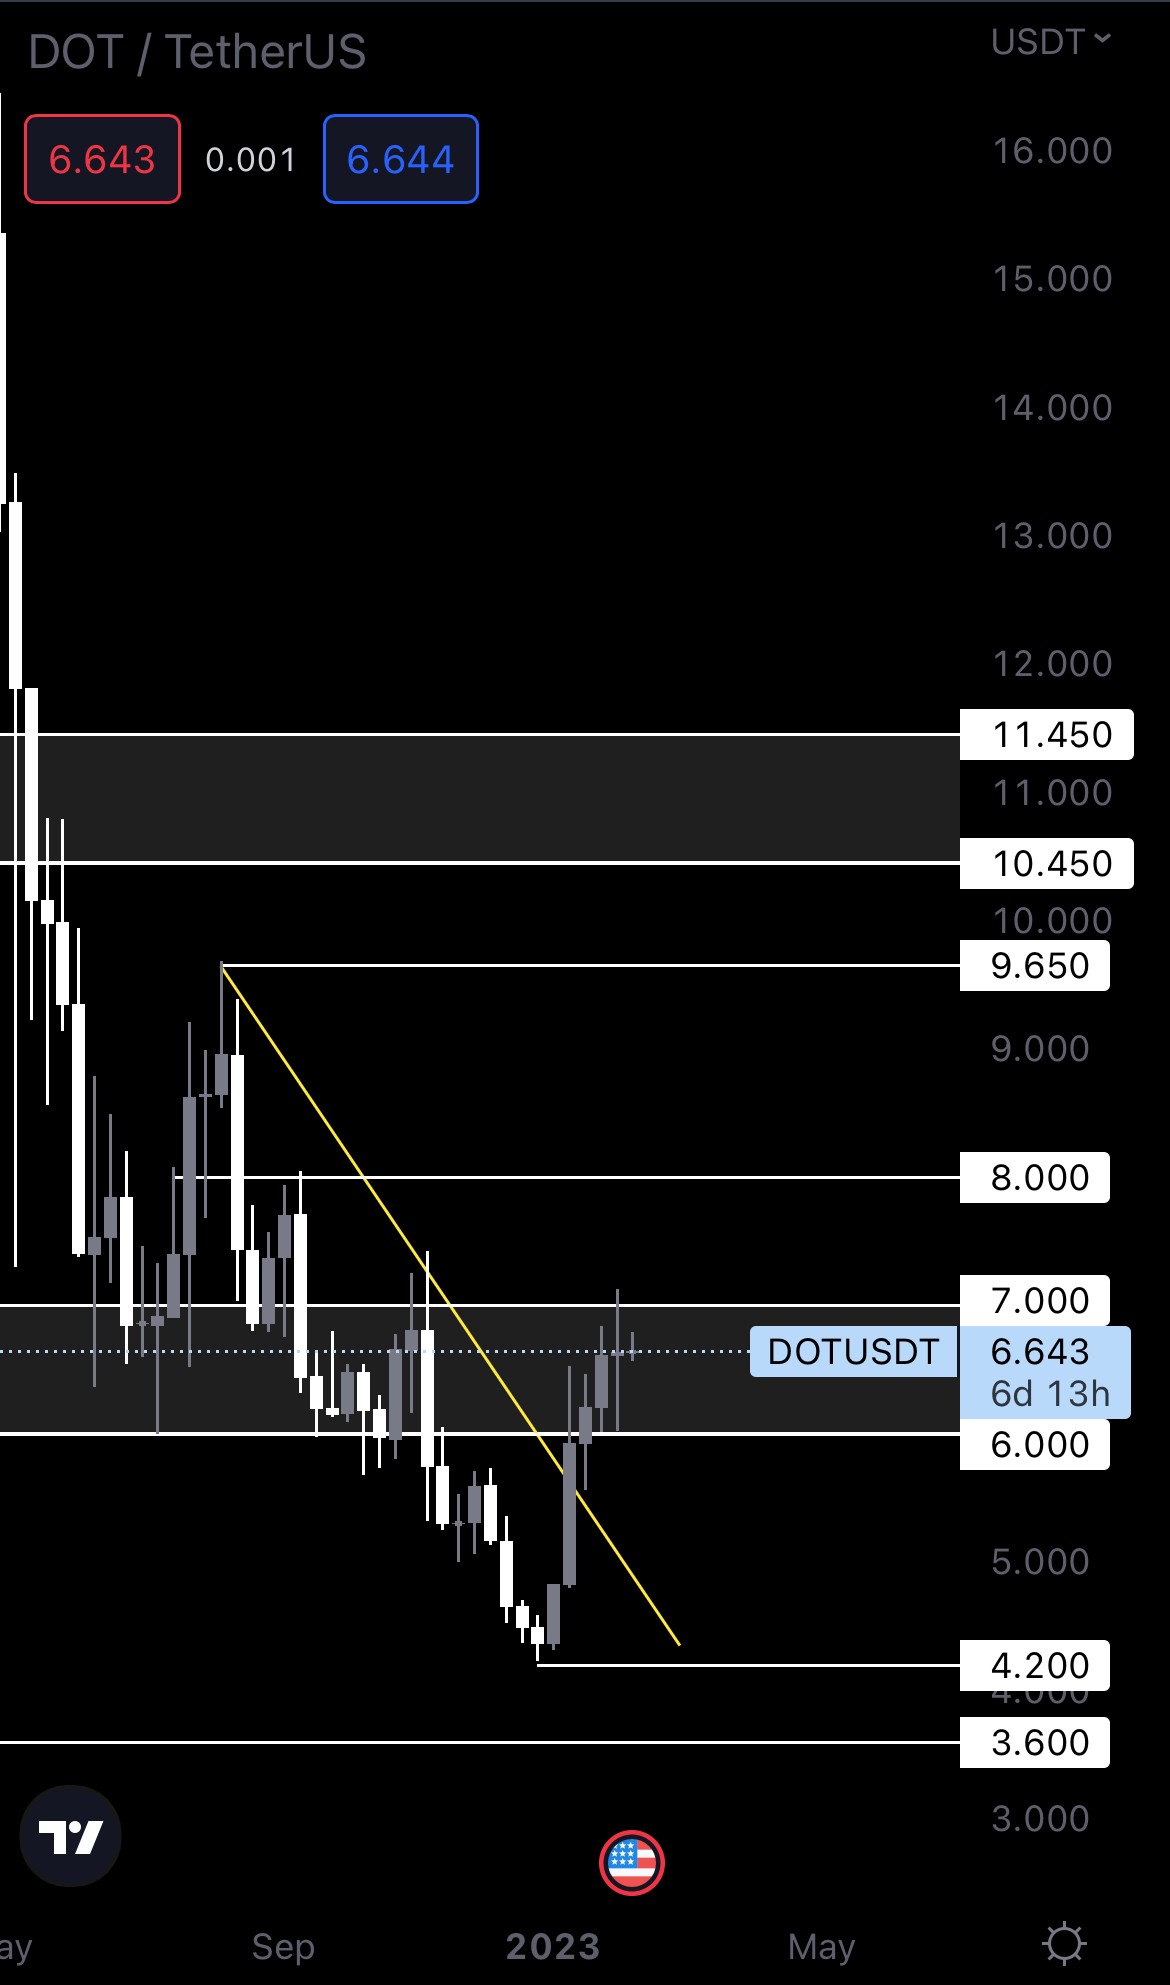
Another Doji candle, suggesting DOT’s price action is indecisive. After all, it is trading between two levels, and only a break of either one will confirm its next direction. For now, we should expect DOT to head toward $6 based on how the market is looking in the short term.
SYN | Synapse
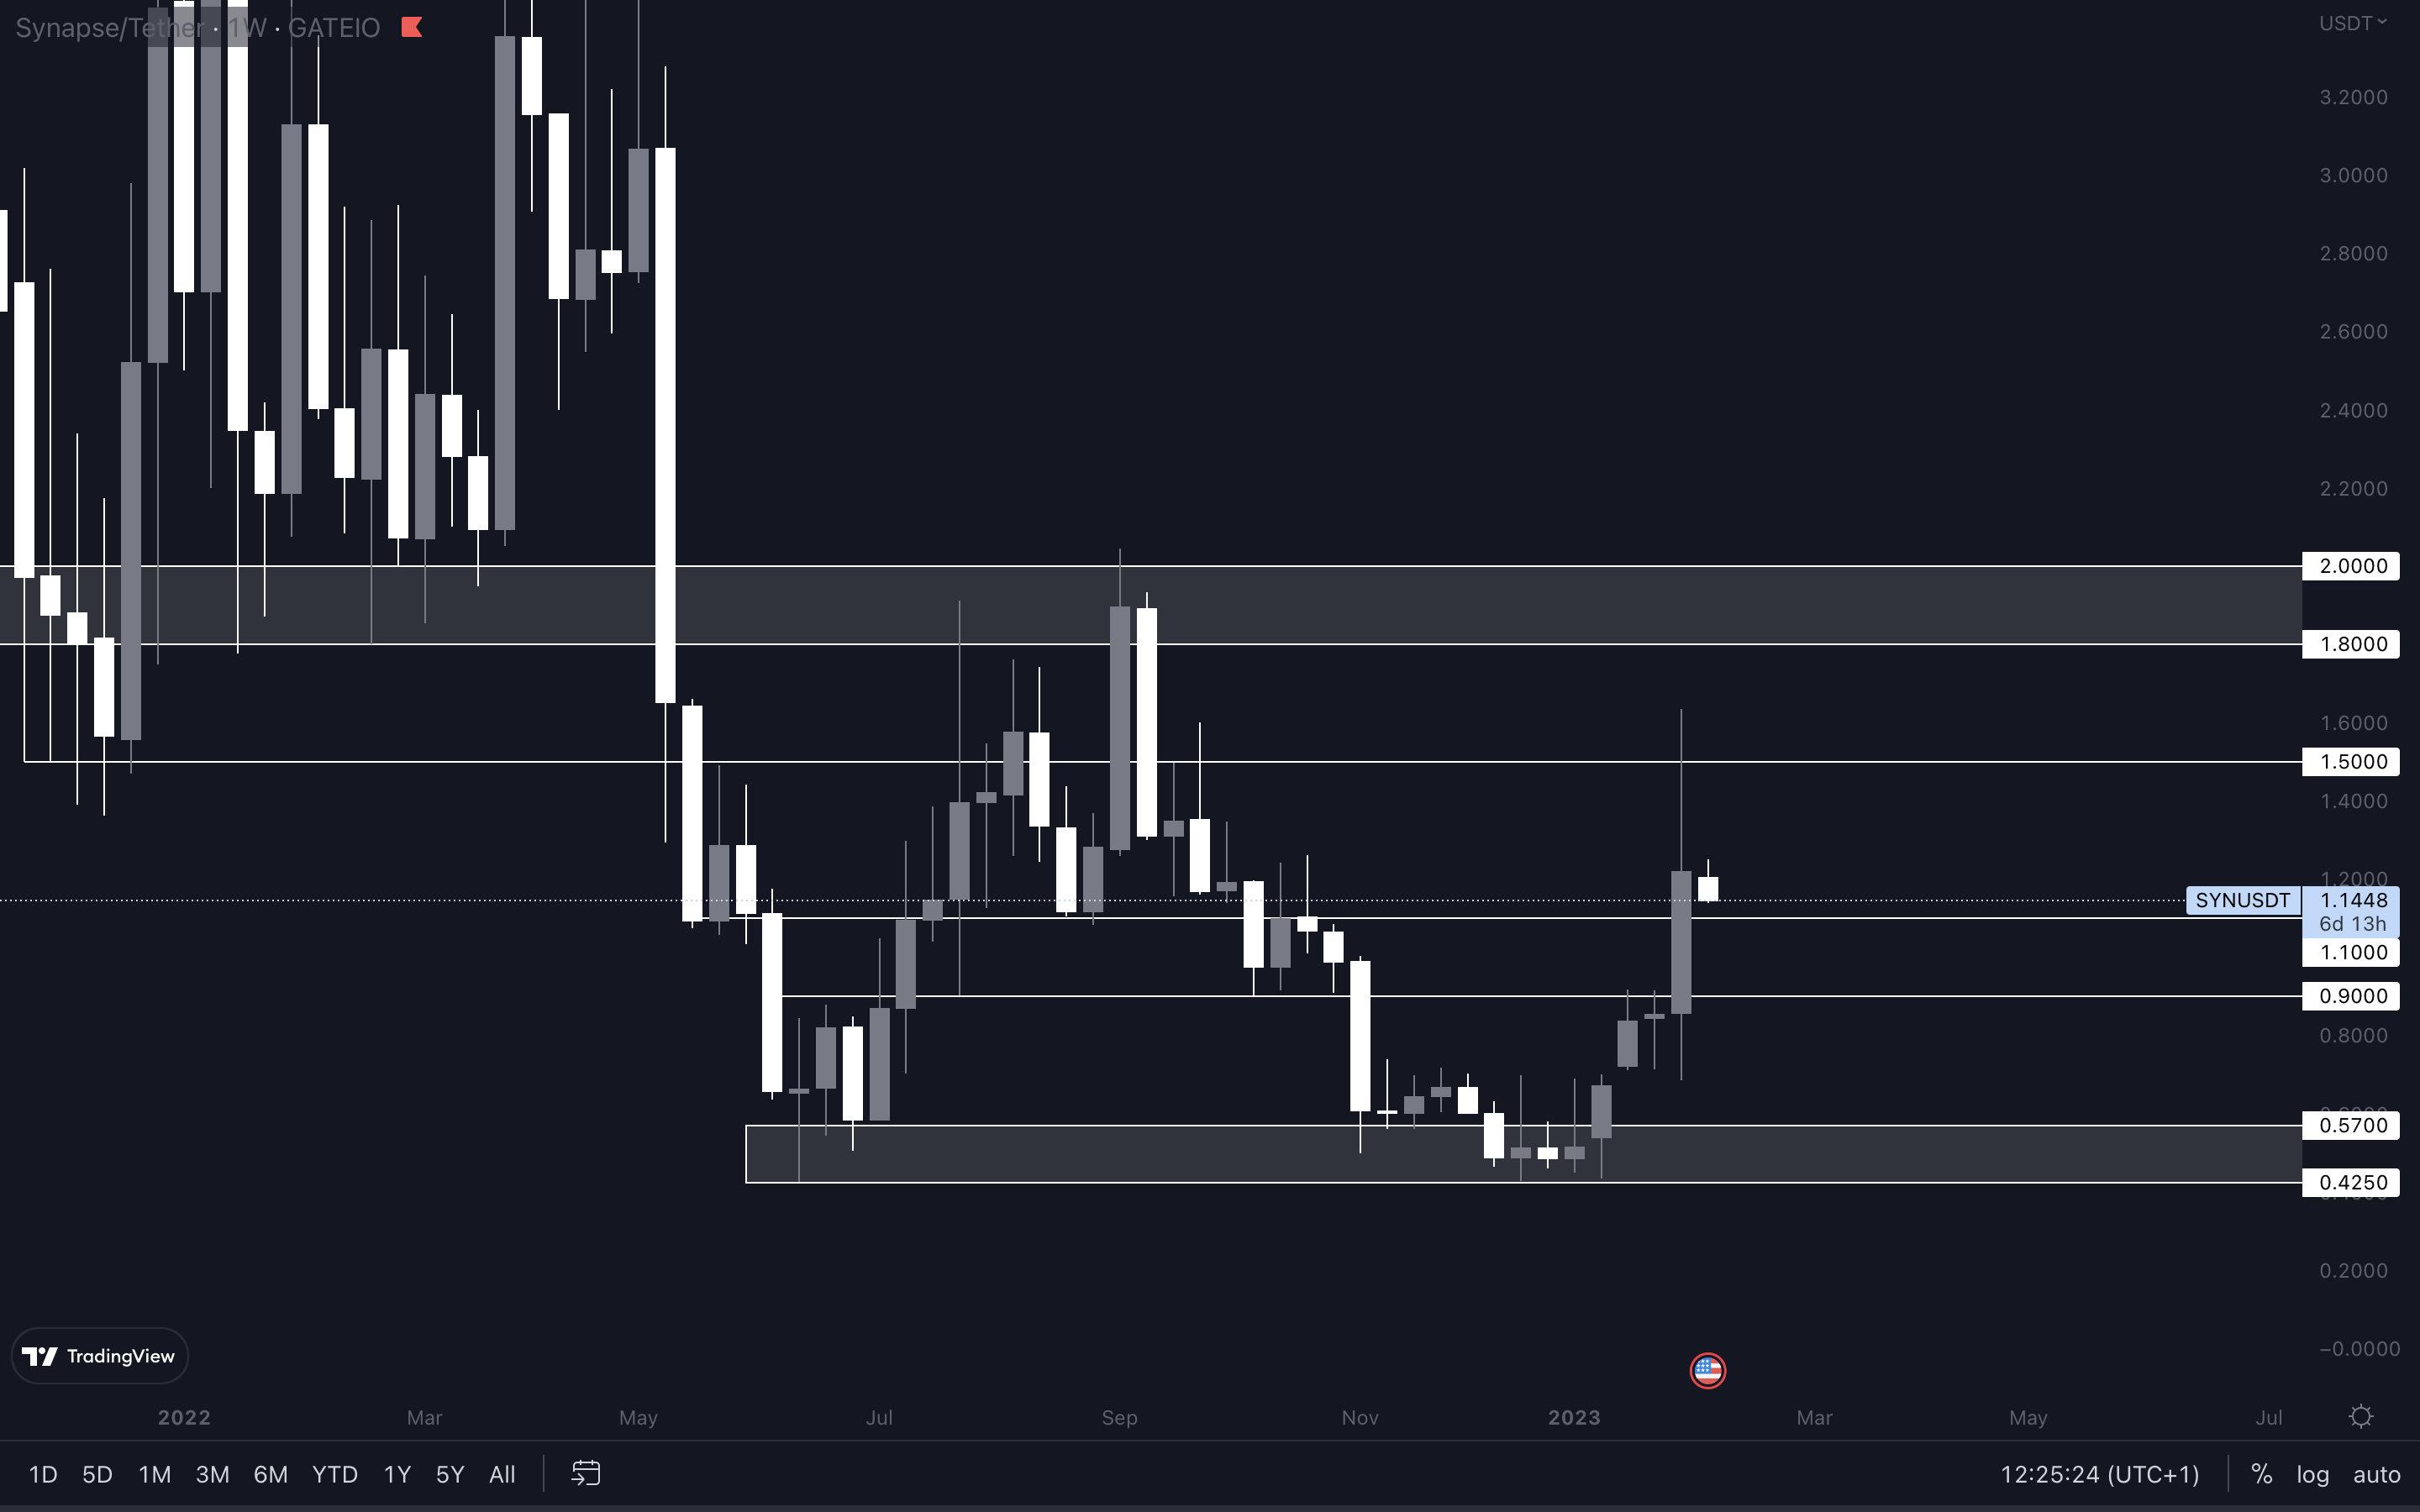
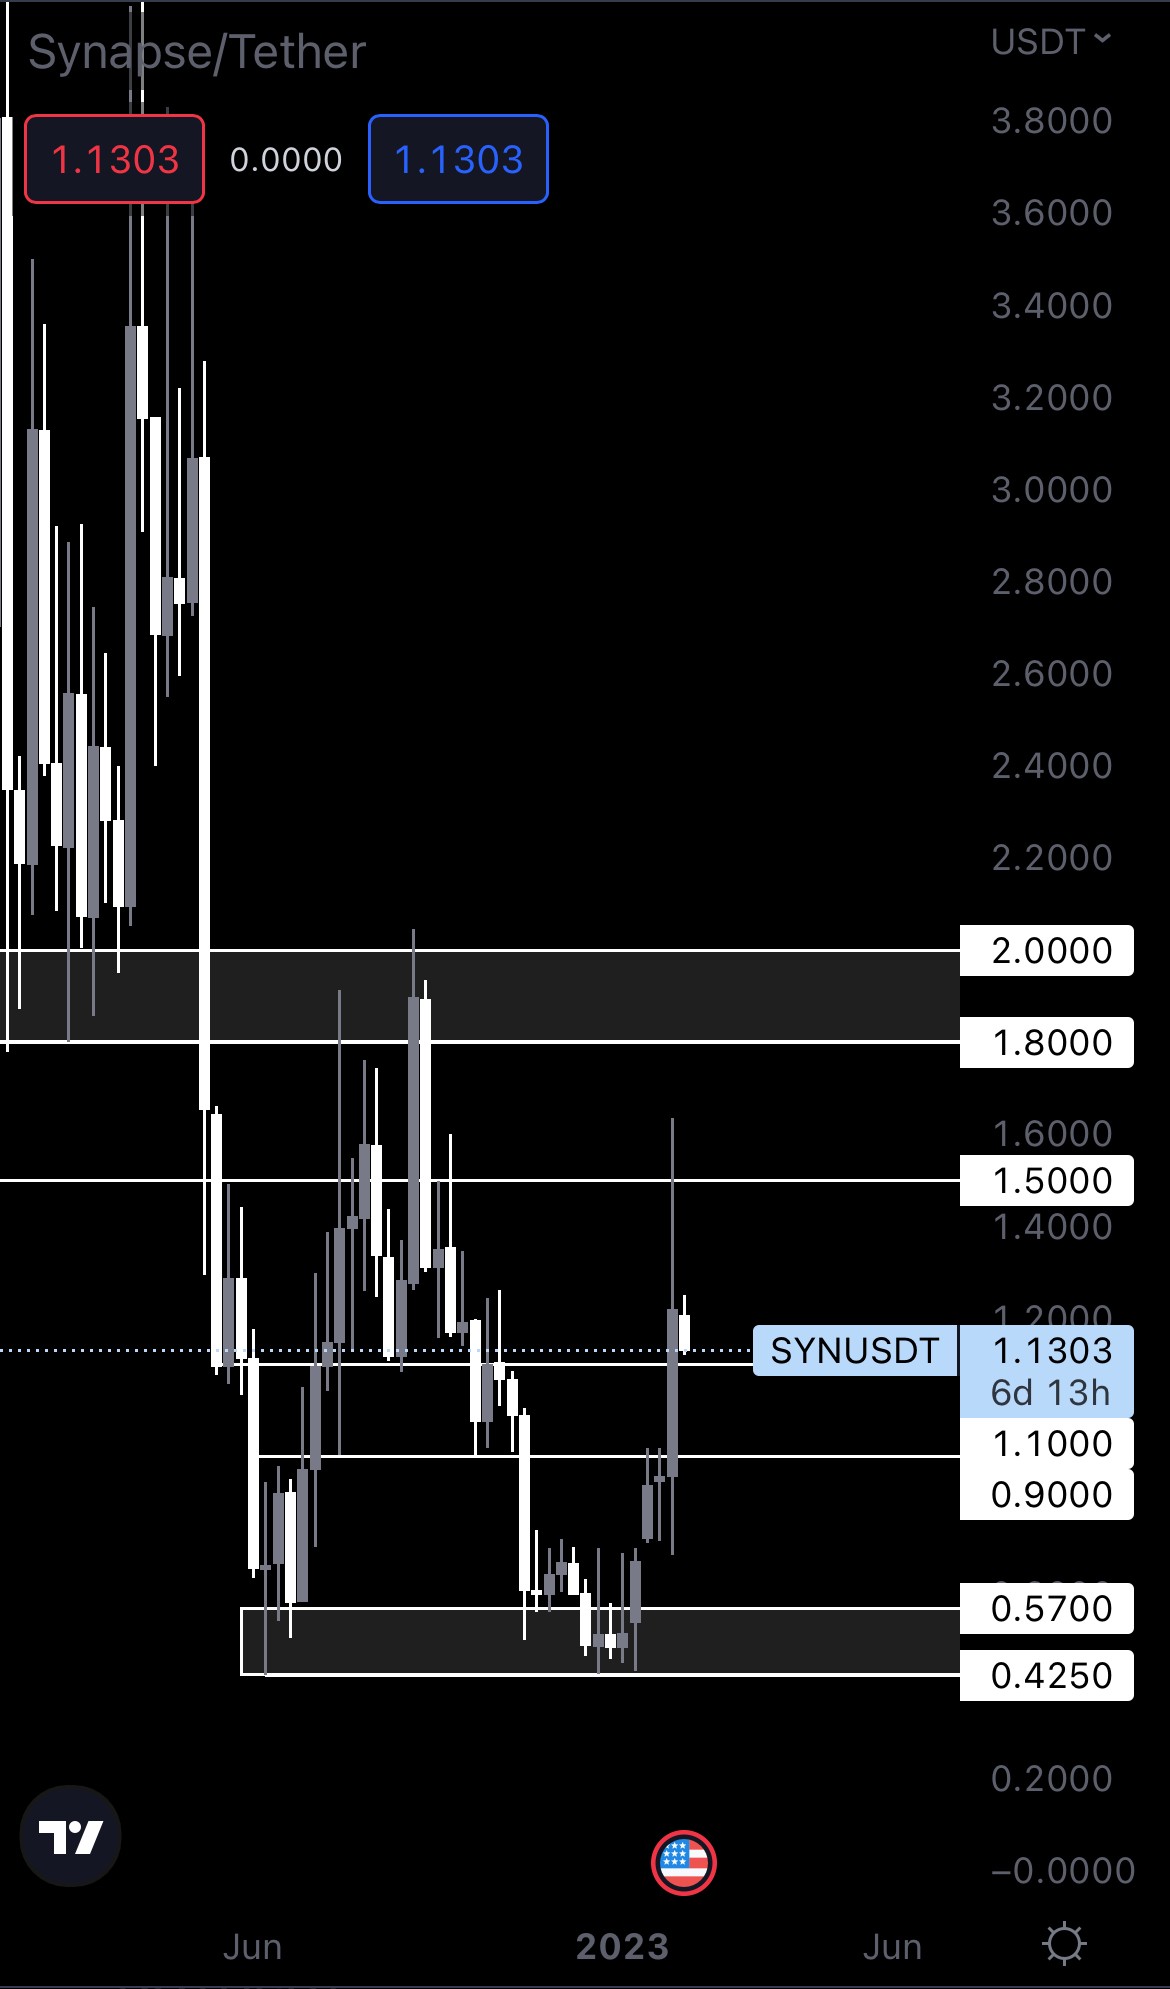
SYN managed to pierce through three different resistance levels in the span of 24 hours last week. Due to the overextension of the move, sellers stepped in and pushed its price down, after which SYN closed last week’s candle above $1.10. As long as the asset holds $1.10, then $1.50 can follow. Our take? SYN will likely lose $1.10 as support and head toward $0.90. This is in confluence with the rest of the market, as we believe there will be some downside in the short-term.
OP | Optimism

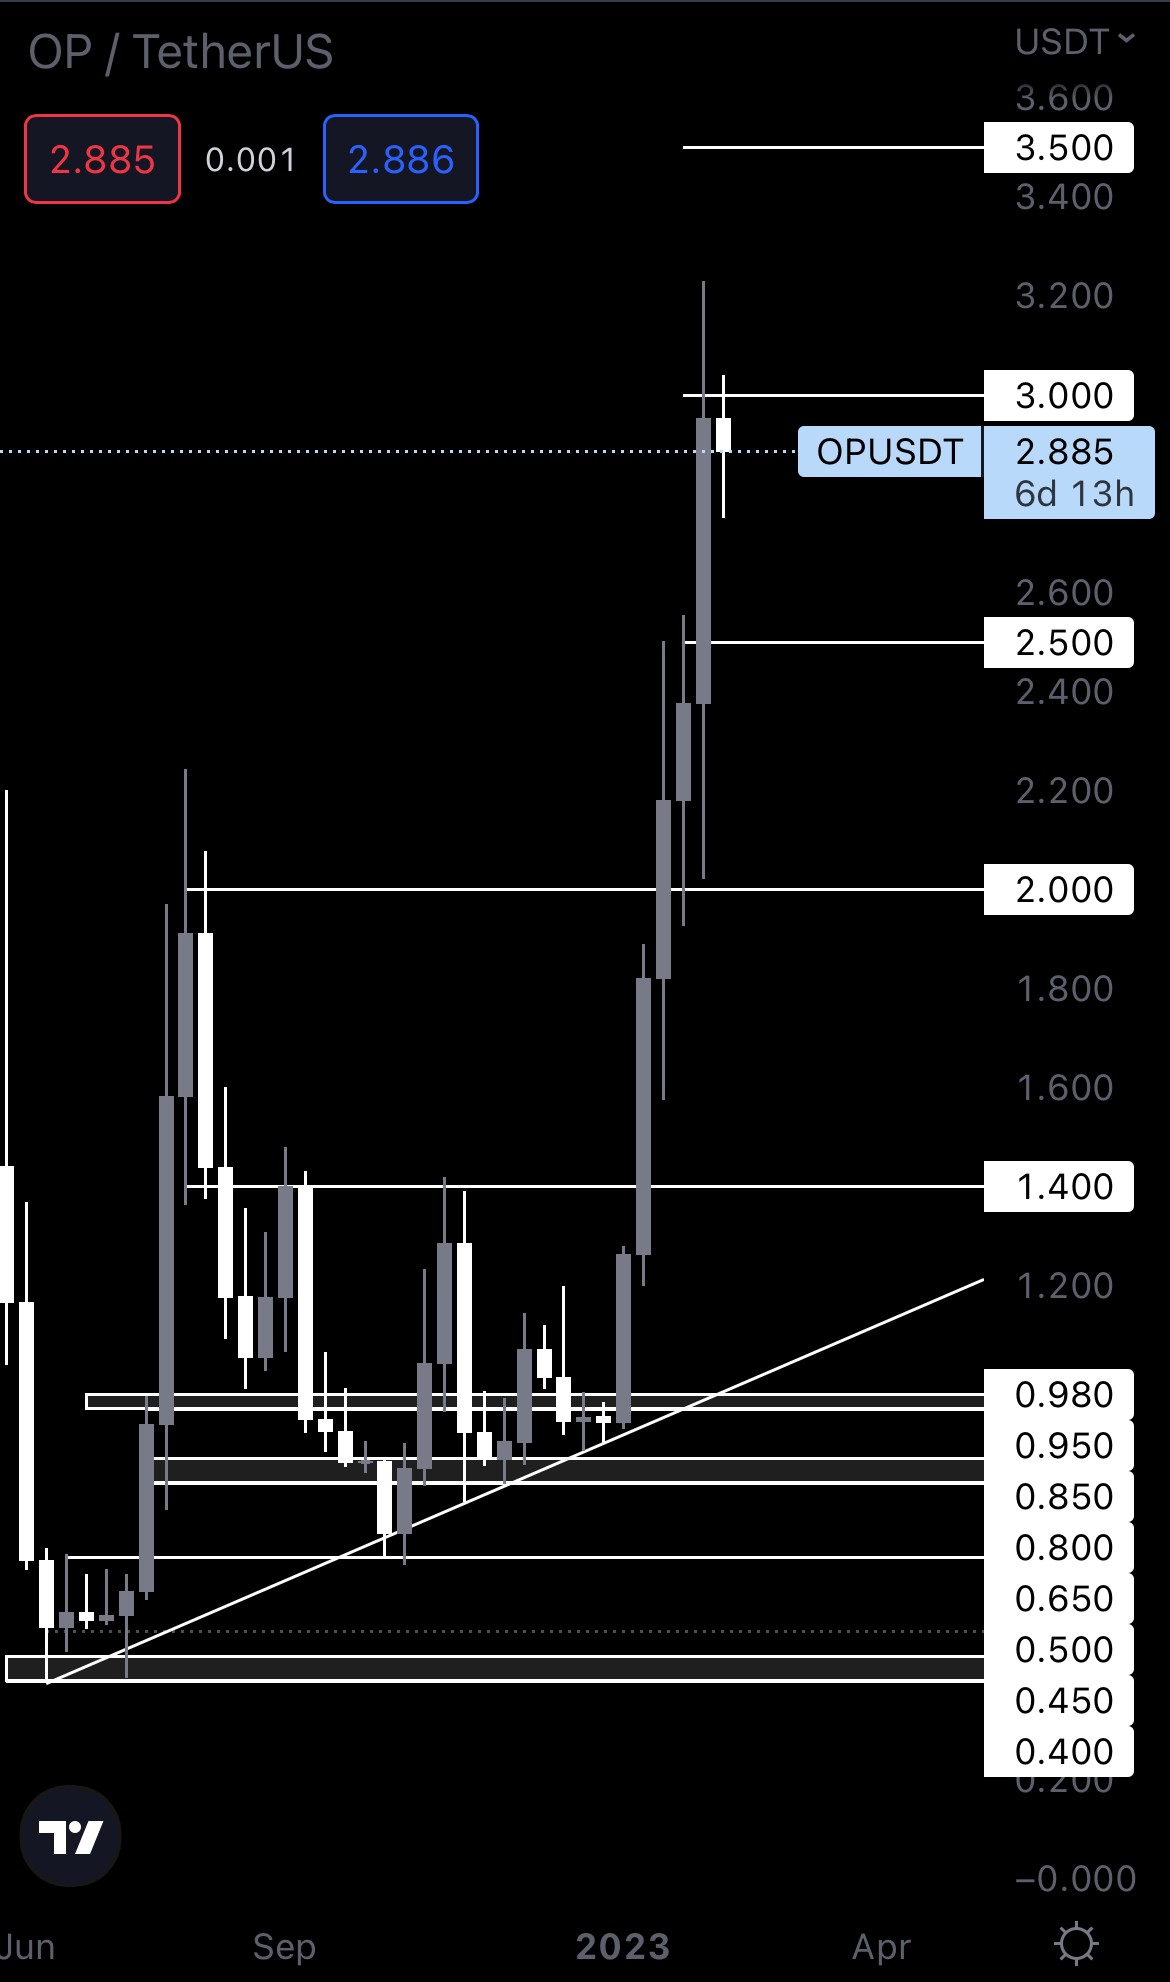
OP just doesn’t want to stop, does it? 🚀 Last week, the asset reached its psychological level of $3, as we expected. It now has $2.50 as support. A break above $3 would confirm a move to $3.50, the next psychological level for this asset. In the meantime, we should expect OP to perform in line with the rest of the market, and that suggests we could see OP going down toward $2.50 unless $3 is reclaimed.
LDO | Lido DAO
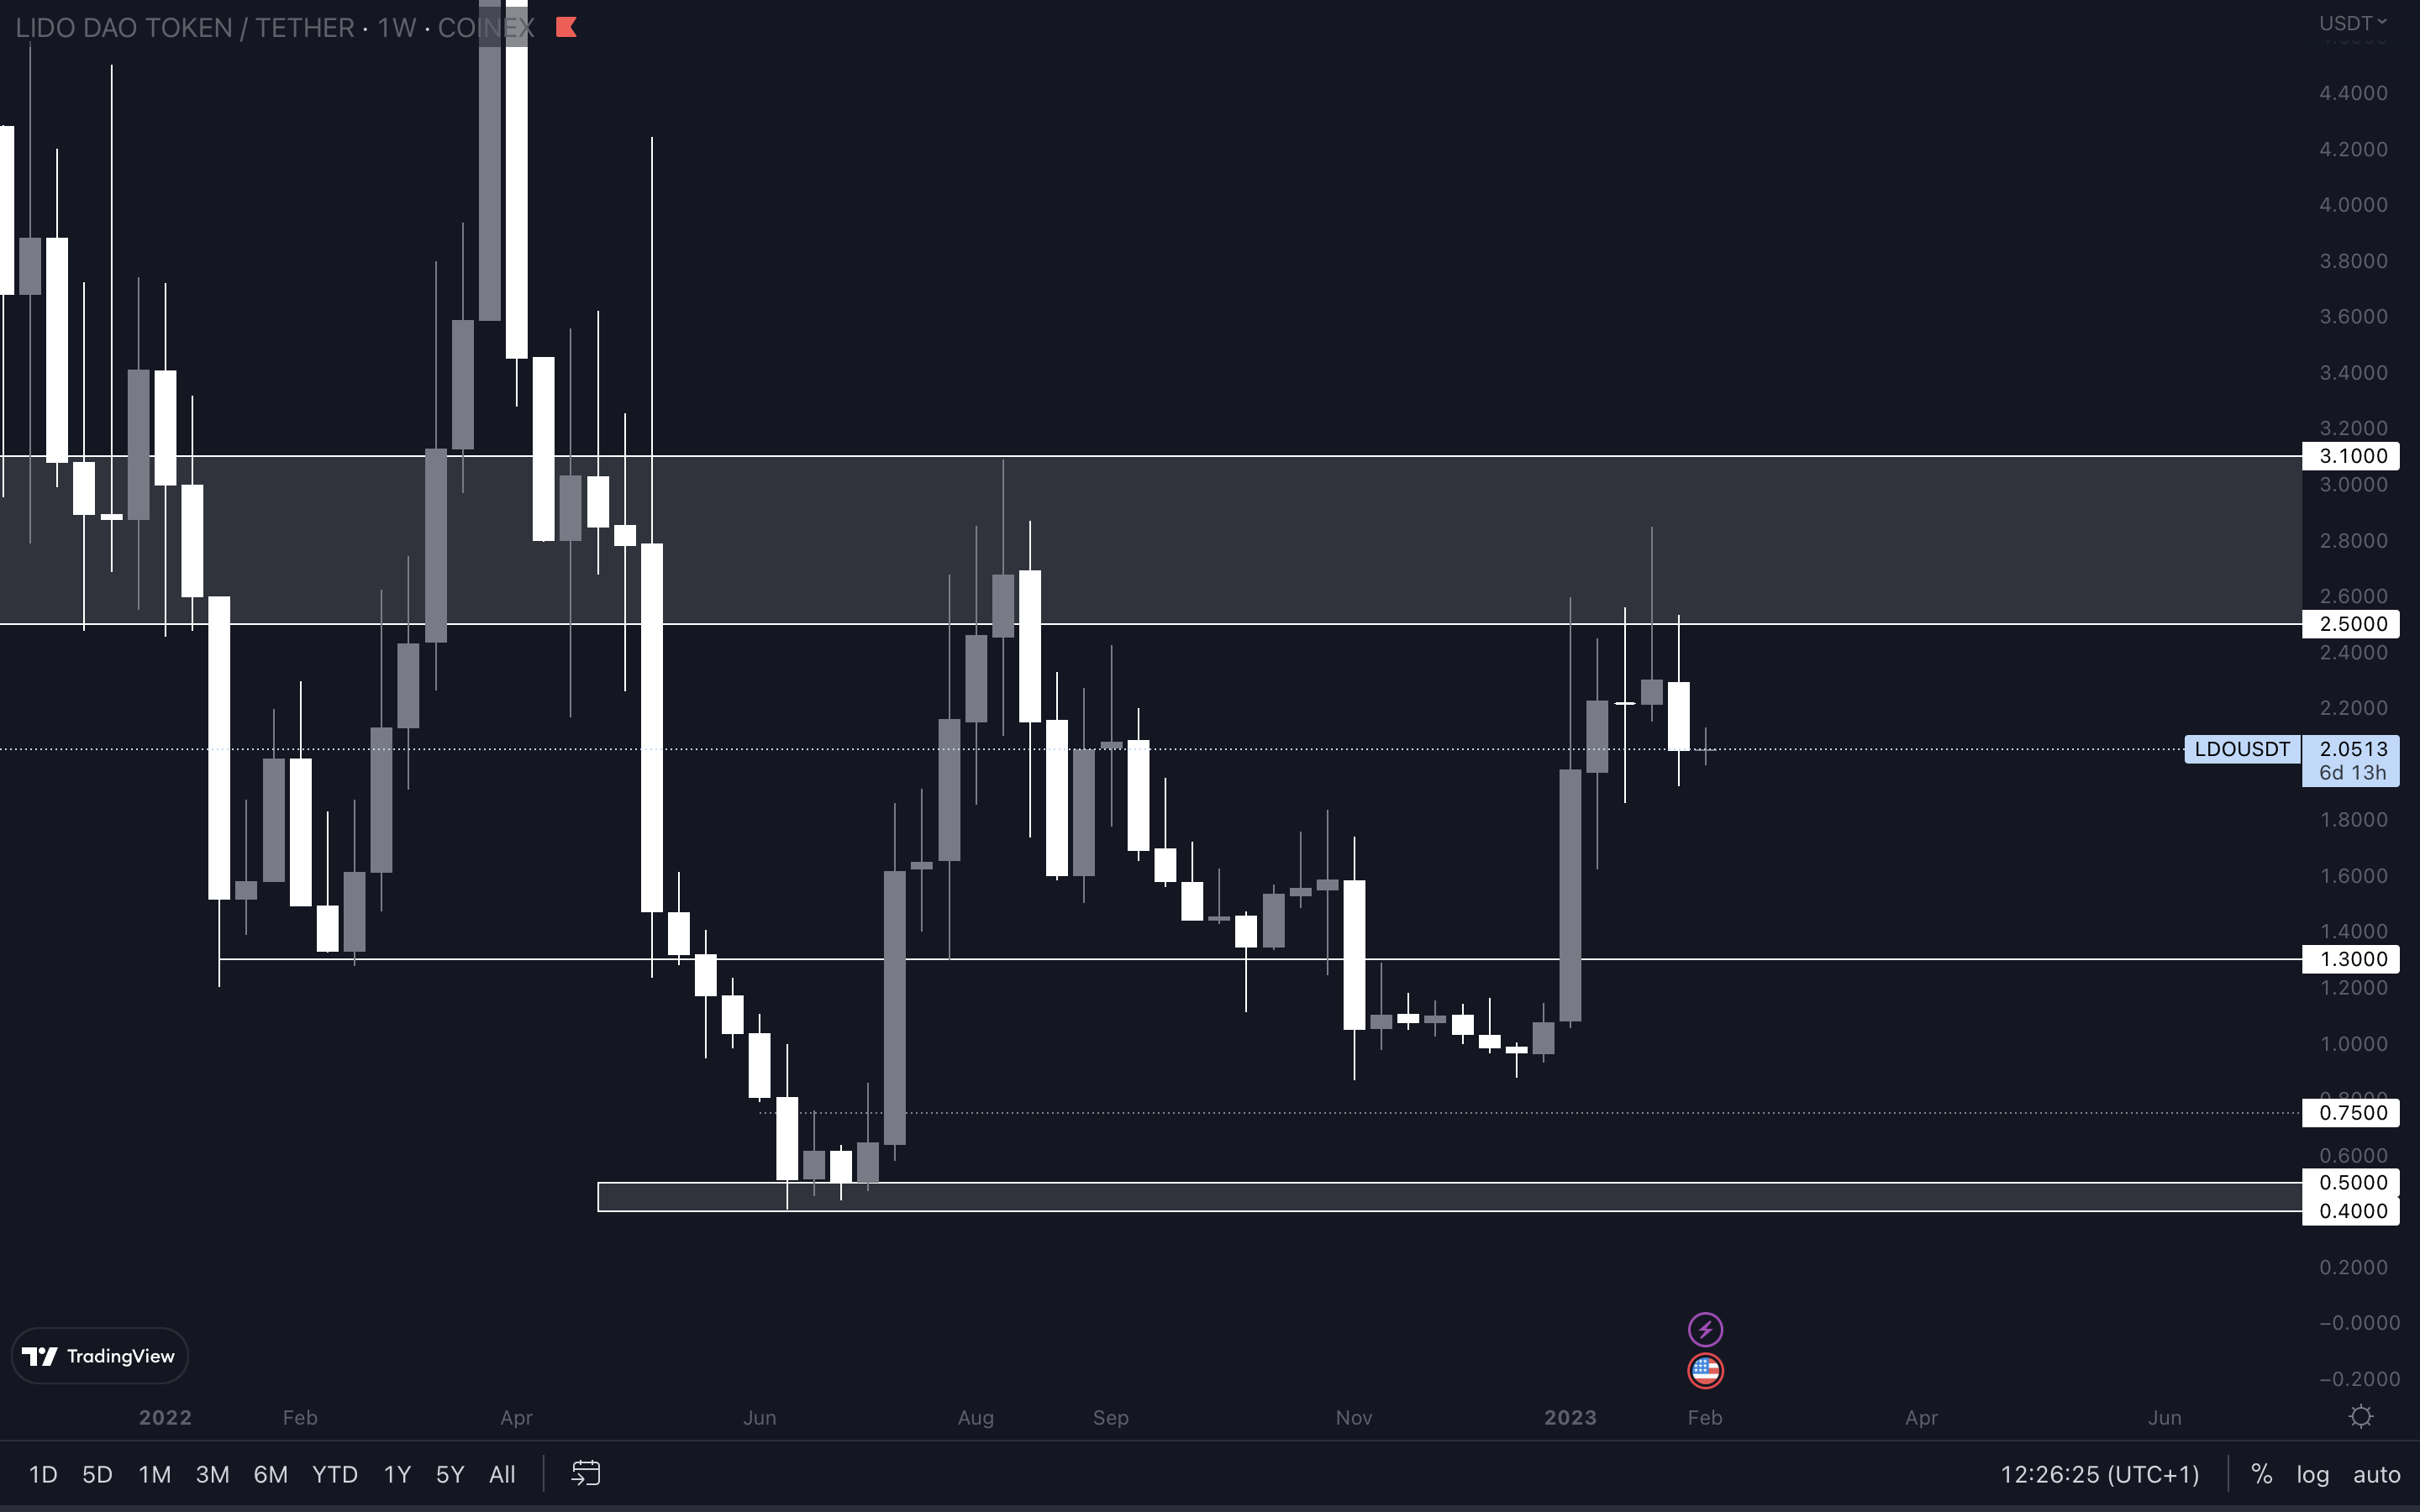
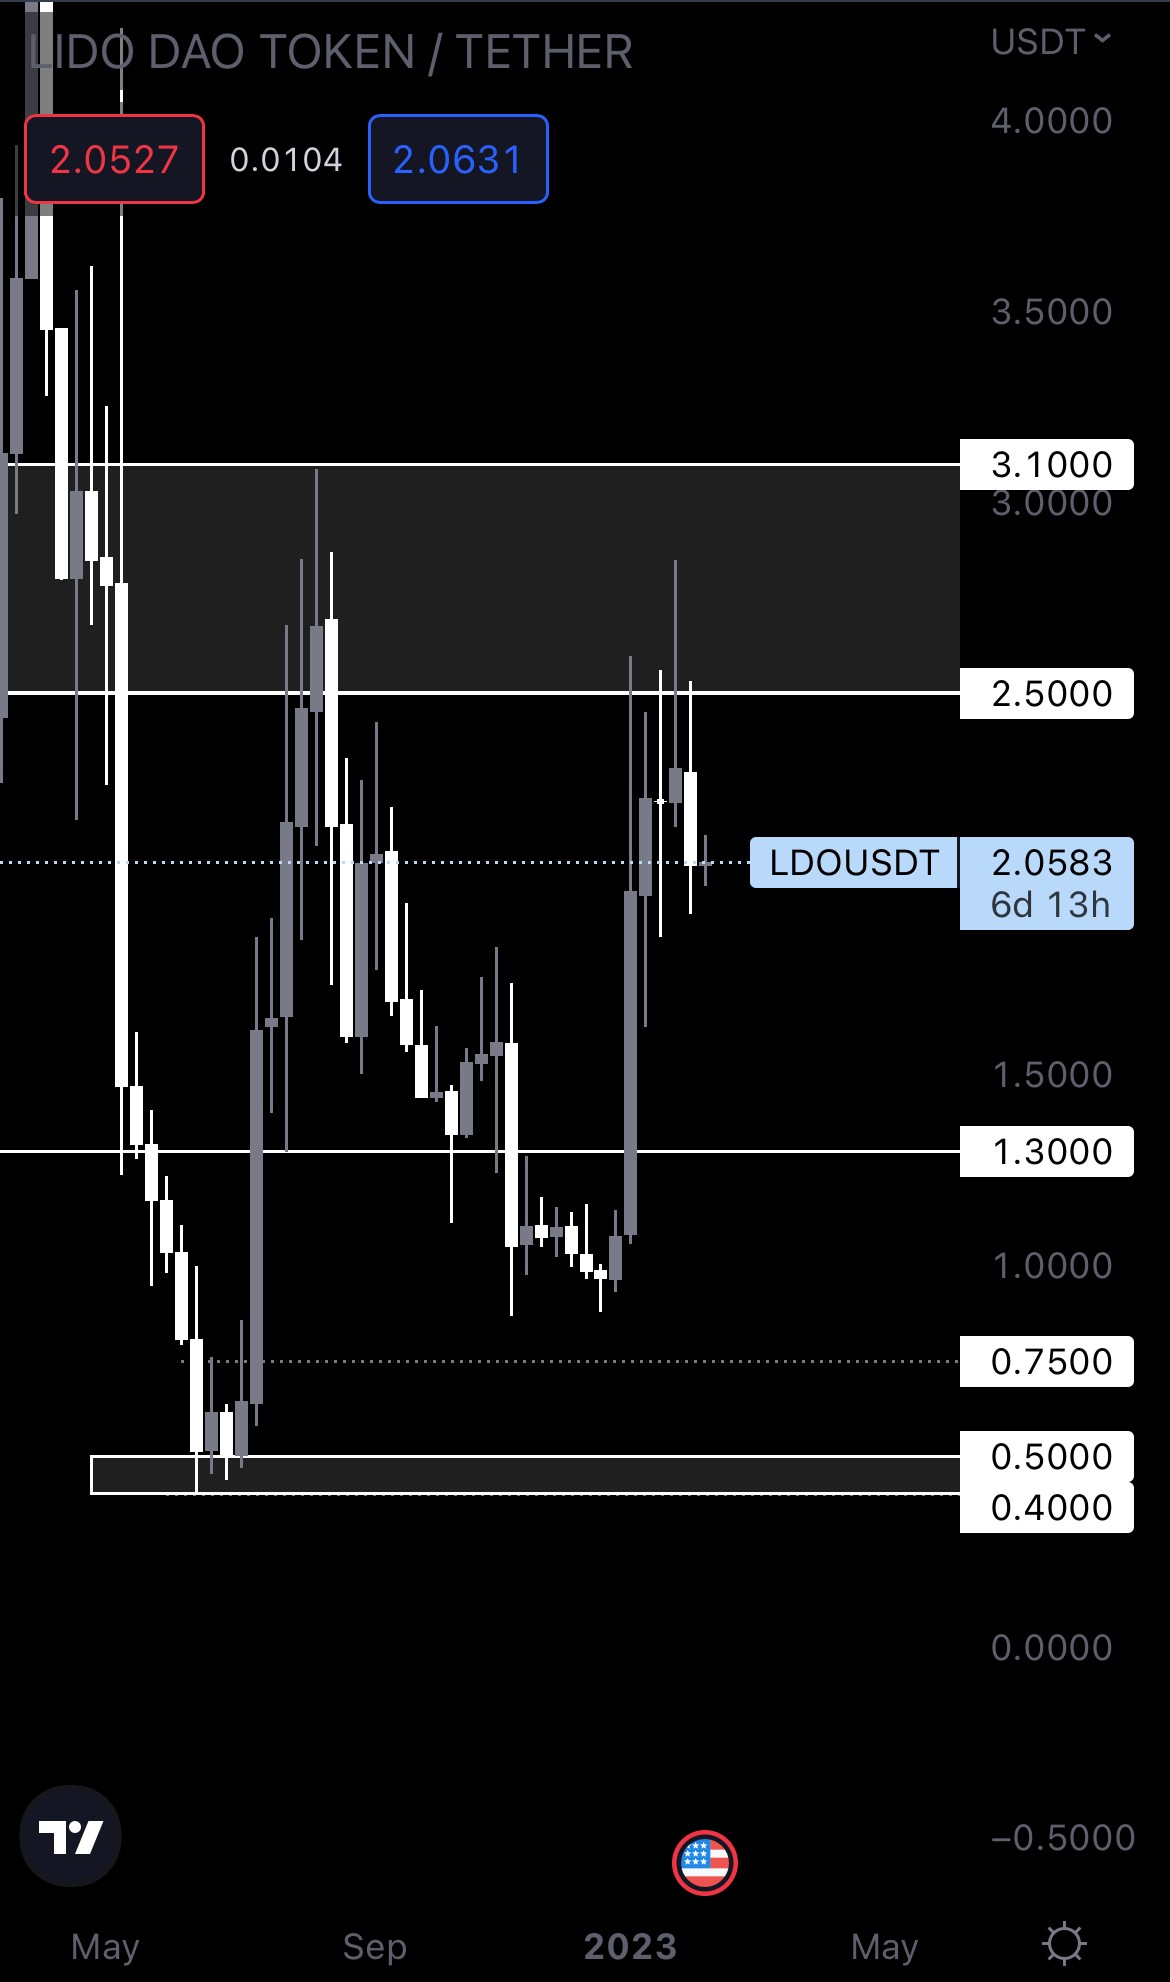 LDO’s previous weekly candles point to a rejection from $2.50. Despite multiple attempts to break above it, LDO was unable to do so. For that reason, we could be seeing LDO heading back down to $1.30 in the coming weeks.
Whether $1.30 is actually reached remains to be seen, as a higher low could form anywhere between its current price and $1.30. We’ll continue to track this chart as usual to spot any developments in that area.
HEGIC | Hegic
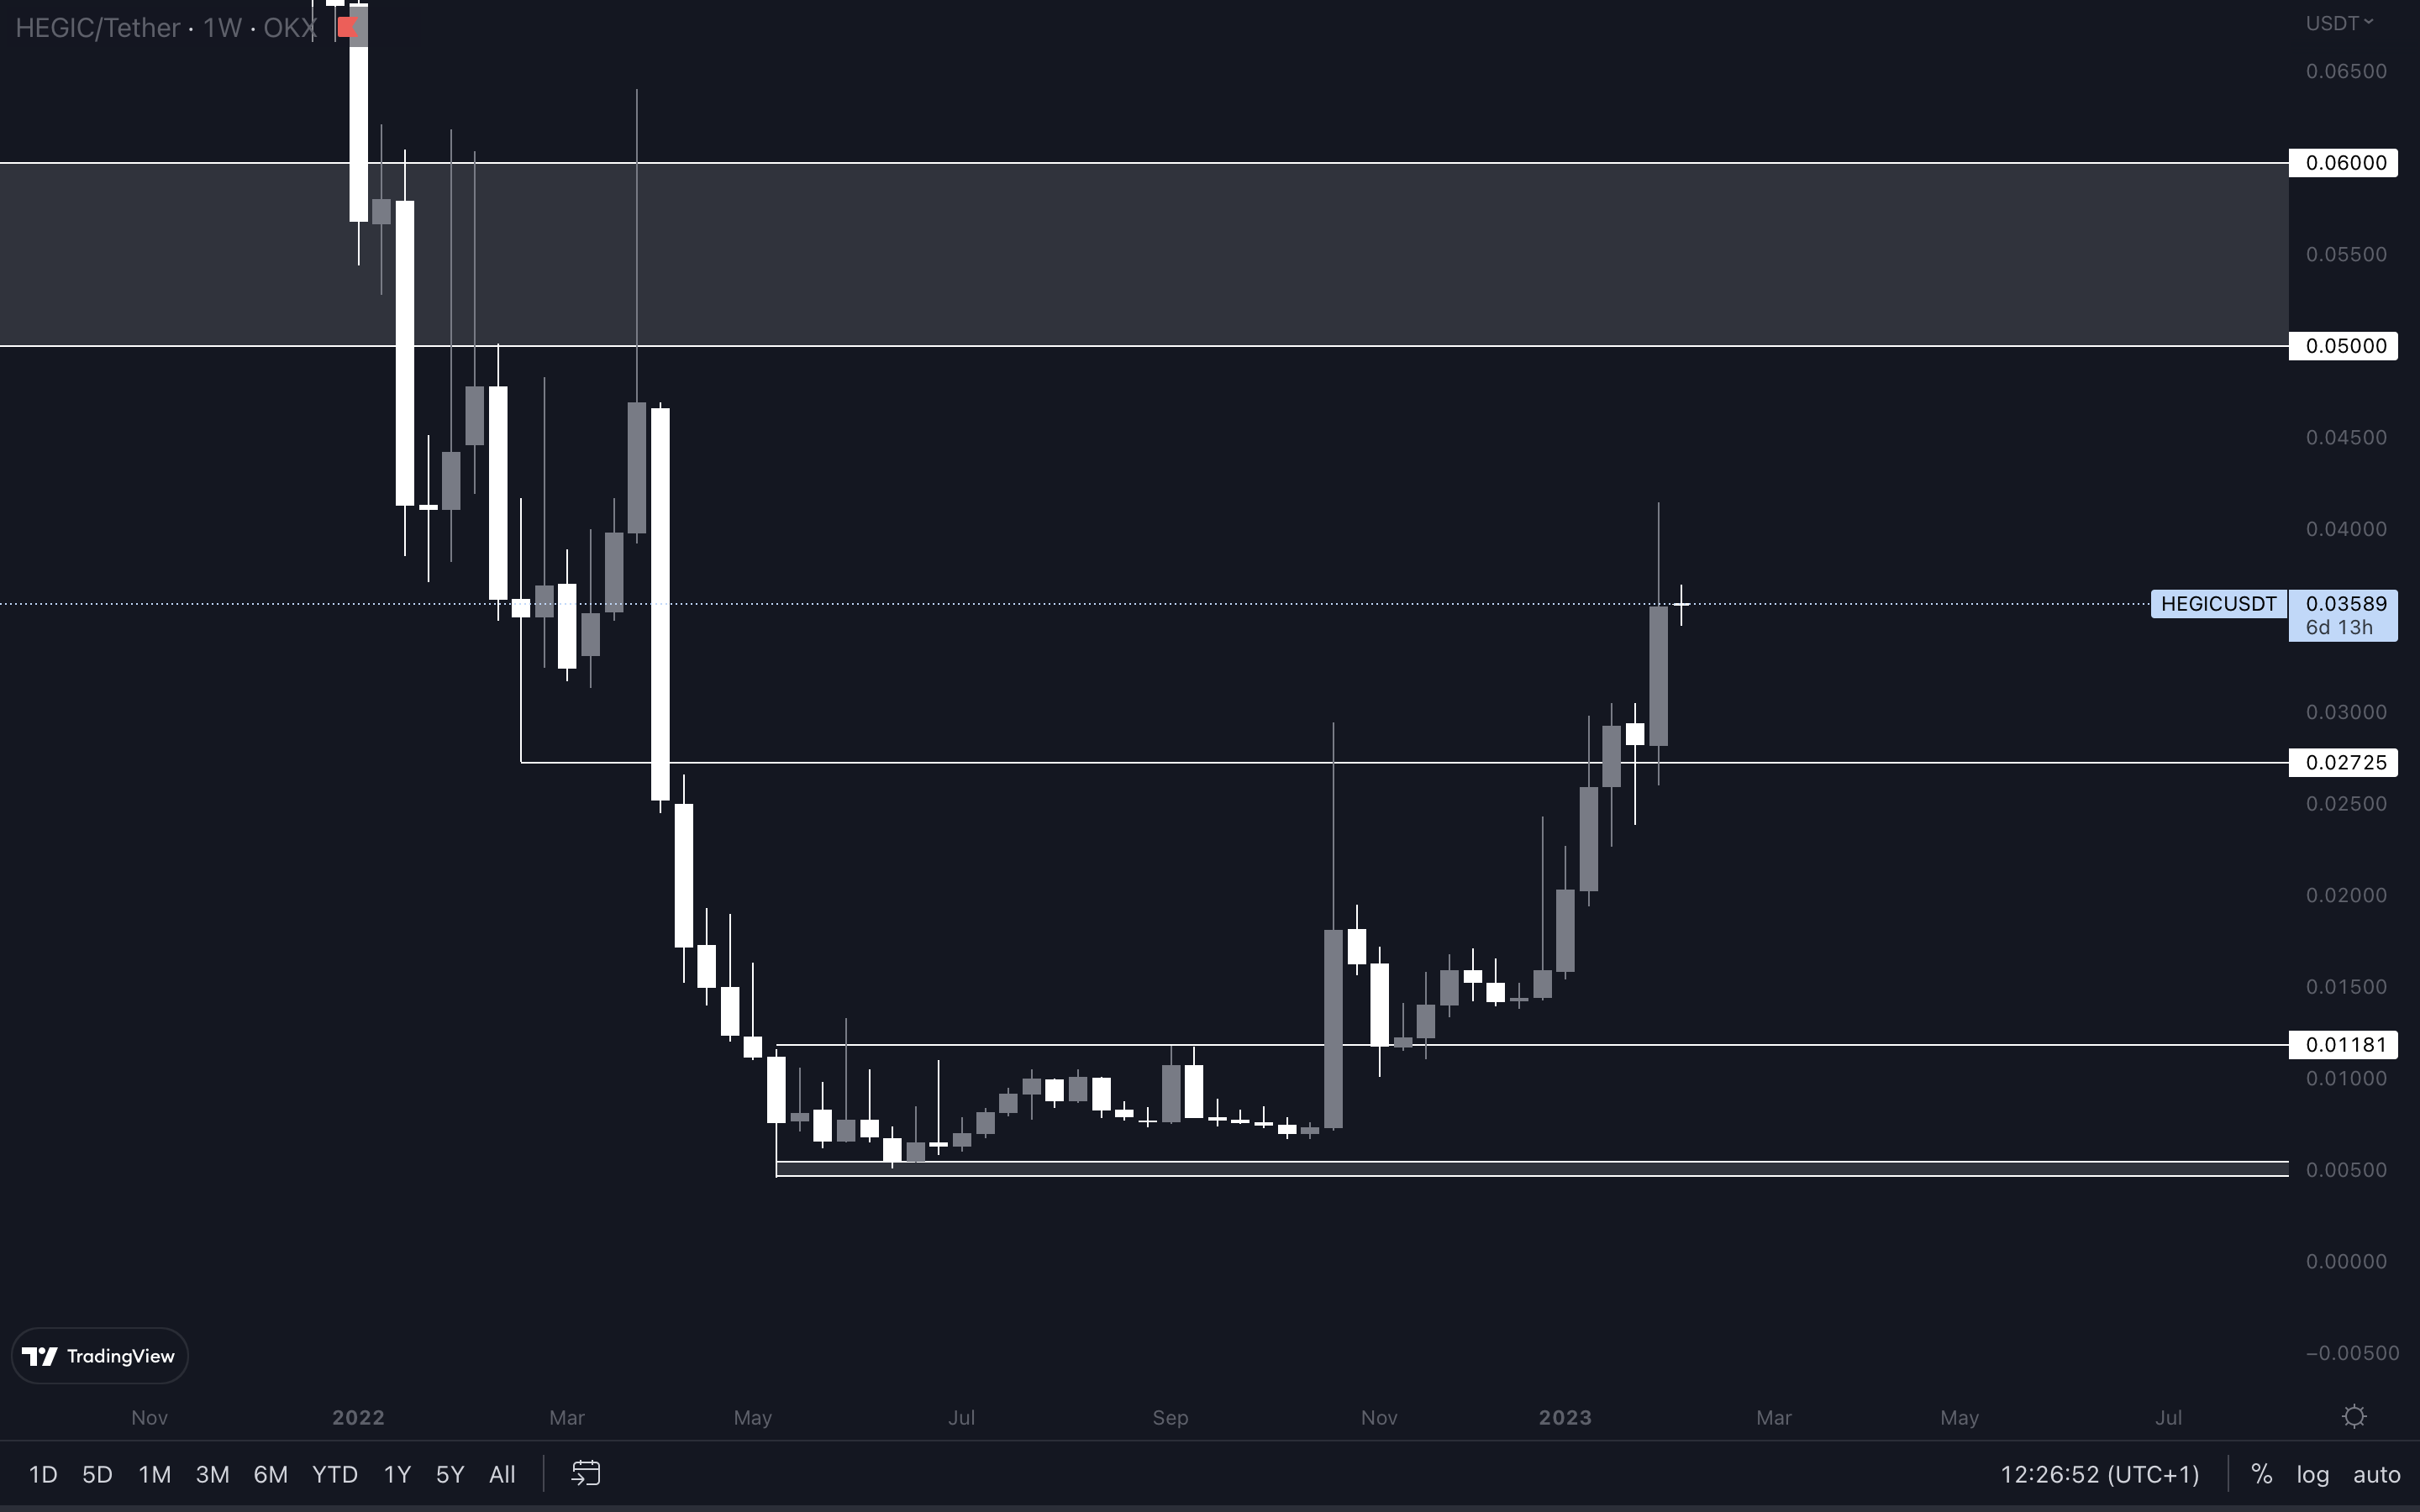
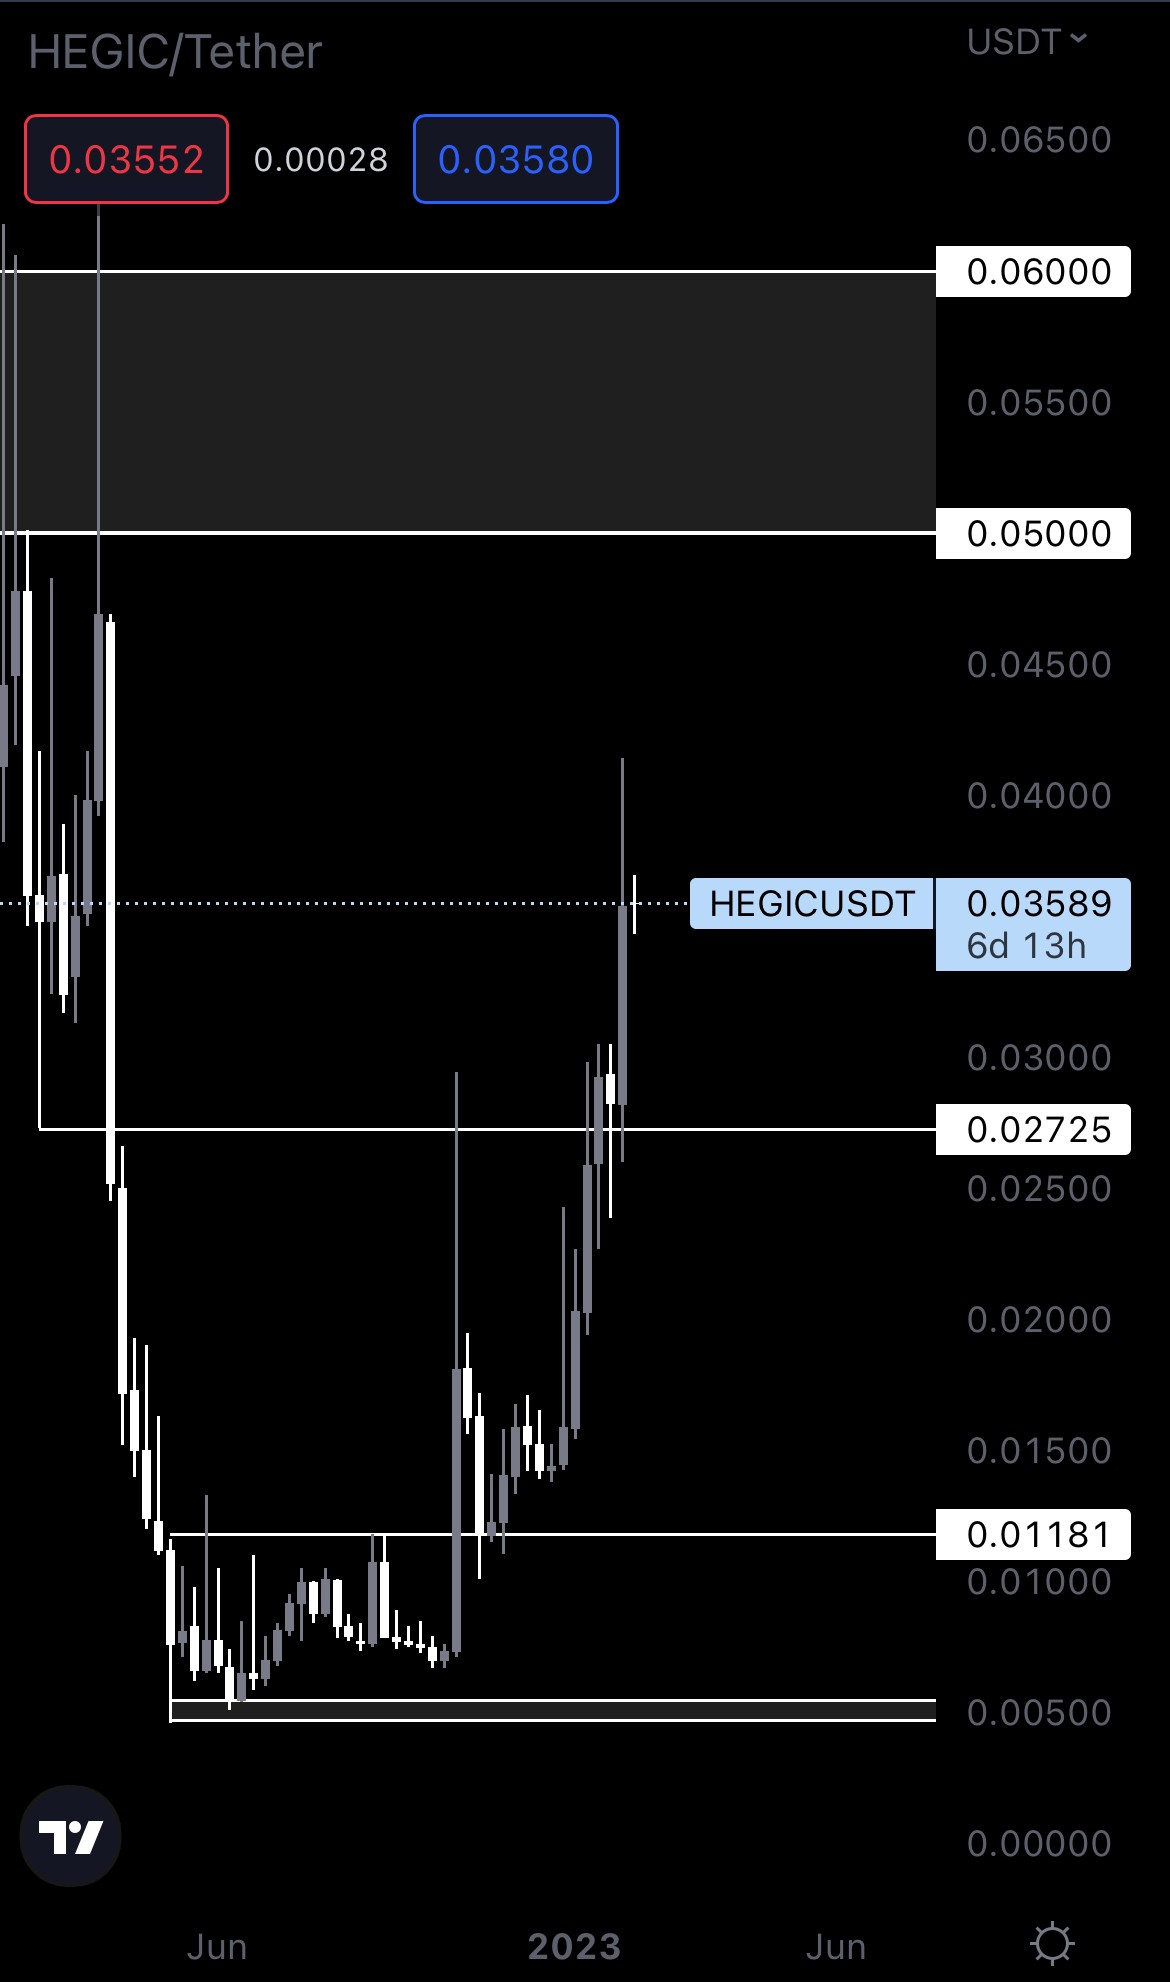
HEGIC’s weekly timeframe looks bullish AF. We have no reason to believe the $0.05 - $0.06 resistance will not be tested in the coming weeks. However, since the market will likely head to the downside in the short-term, HEGIC will probably follow and head lower. As long as we don’t see a weekly closure under $0.02725, a move to $0.05 - $0.06 remains on the cards.
ASTR | Astar
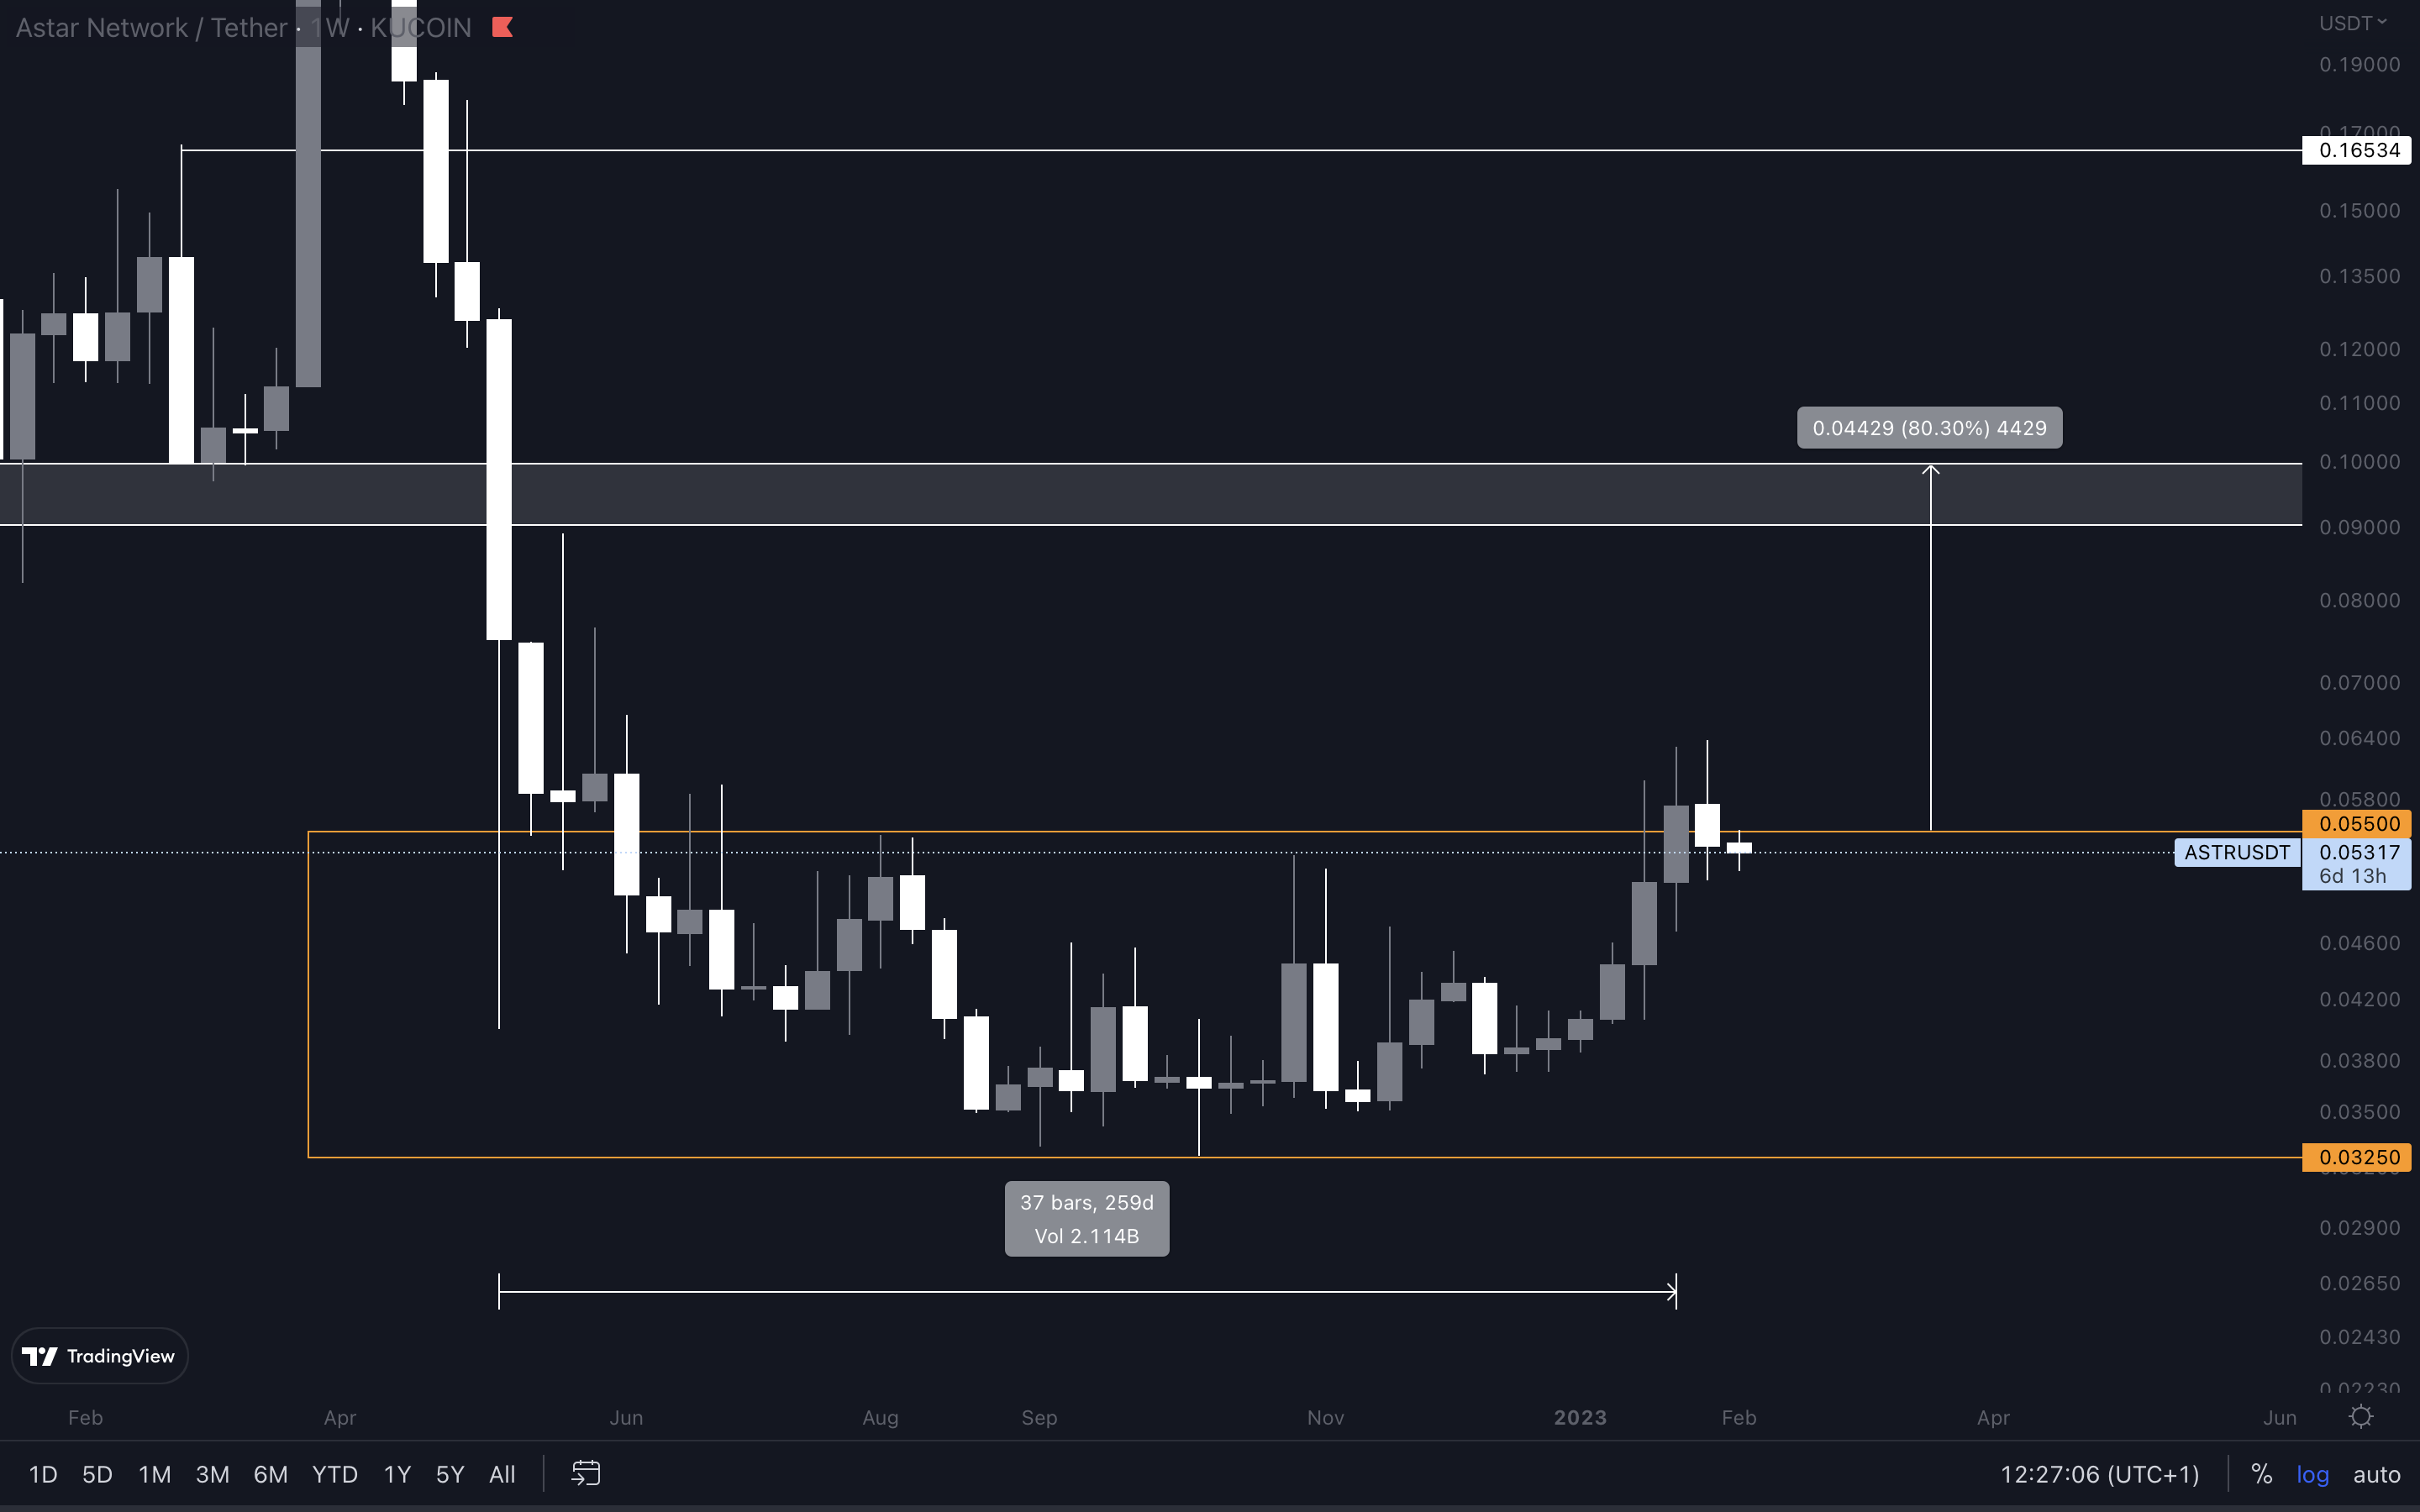
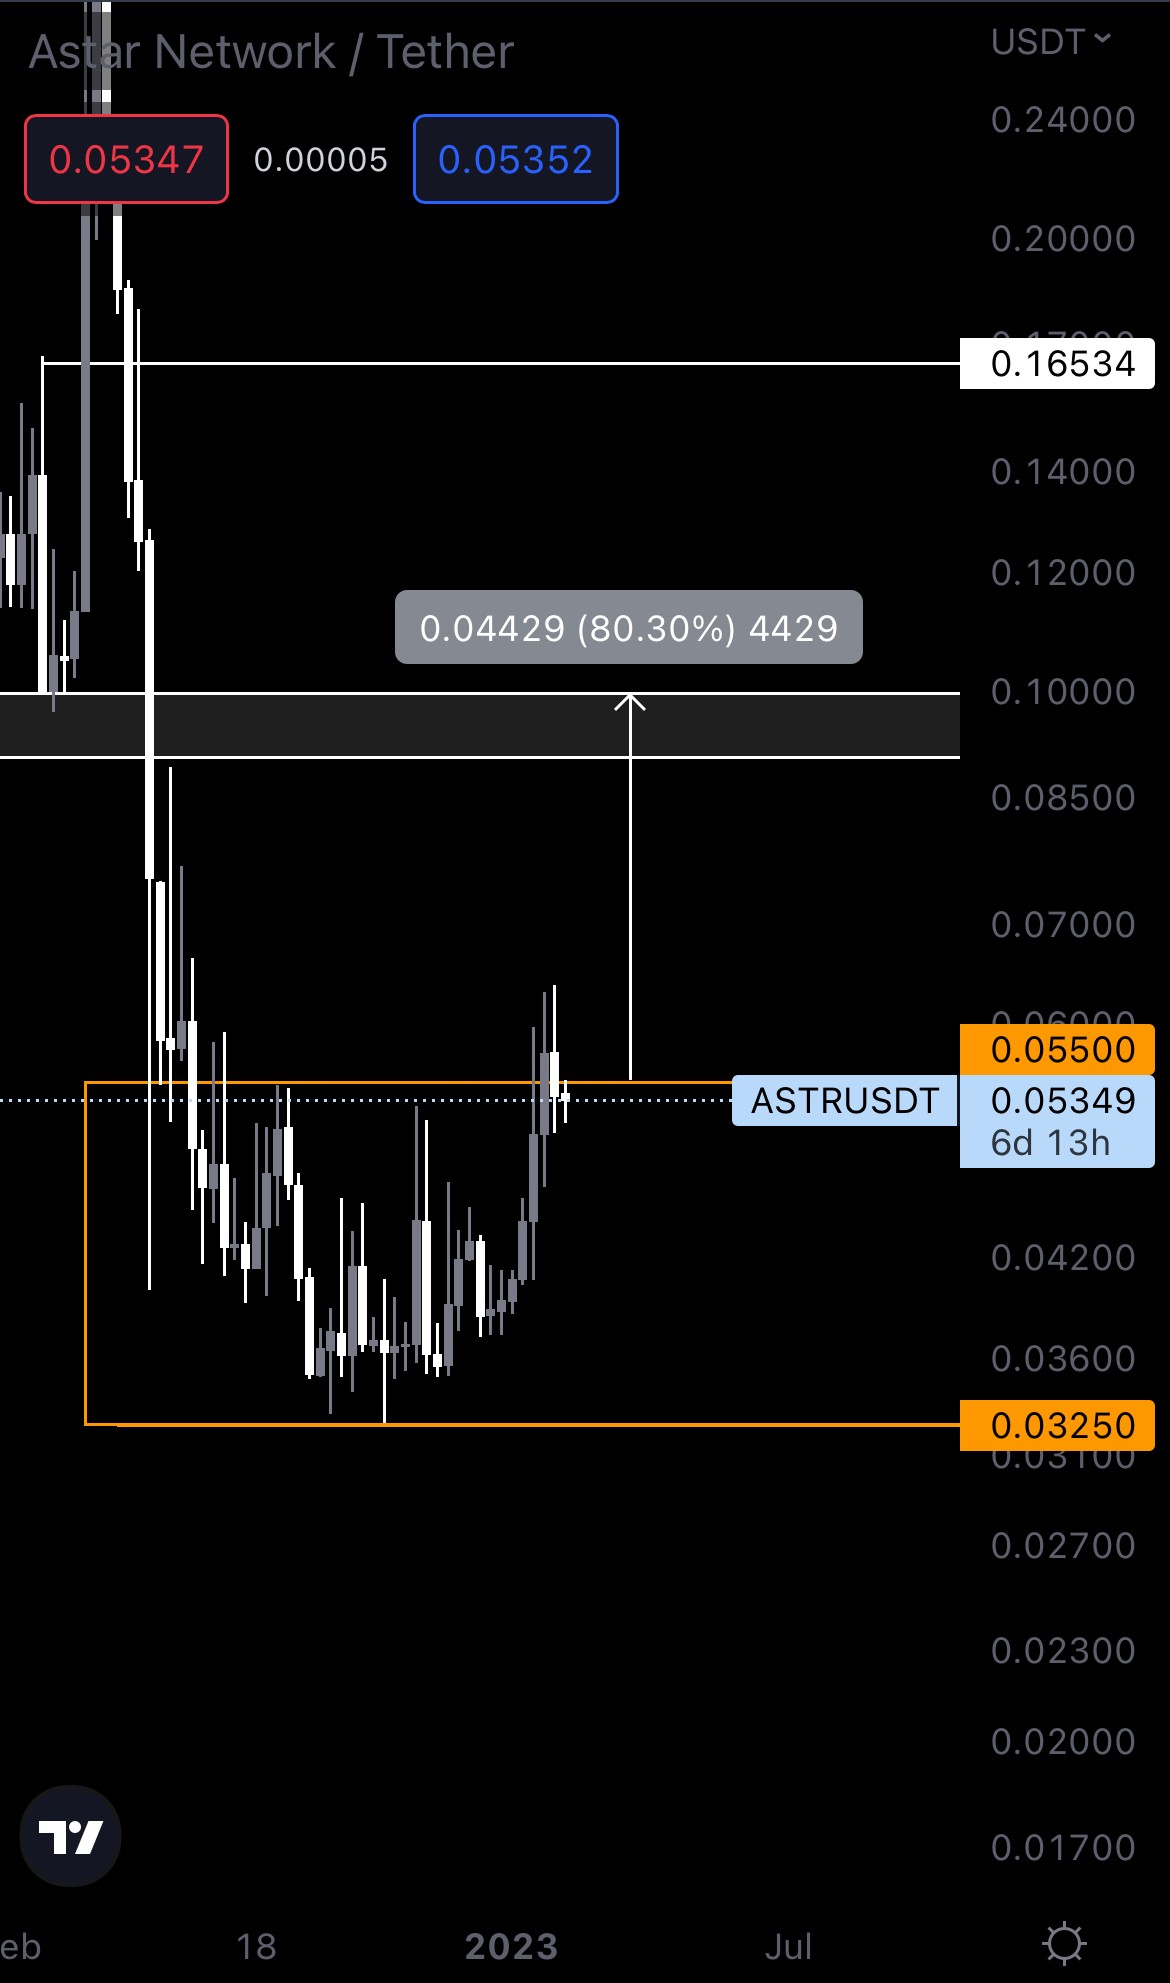
ASTR is back inside its accumulation area after closing last week’s candle under $0.05500. As a result, the move to $0.09 was invalidated and only a reclaim of $0.05500 would confirm it once more. In the meantime, expect ASTR to continue dropping inside the accumulation area (orange box), as this is in confluence with the market’s potential direction in the short term.
THOR | THORSwap
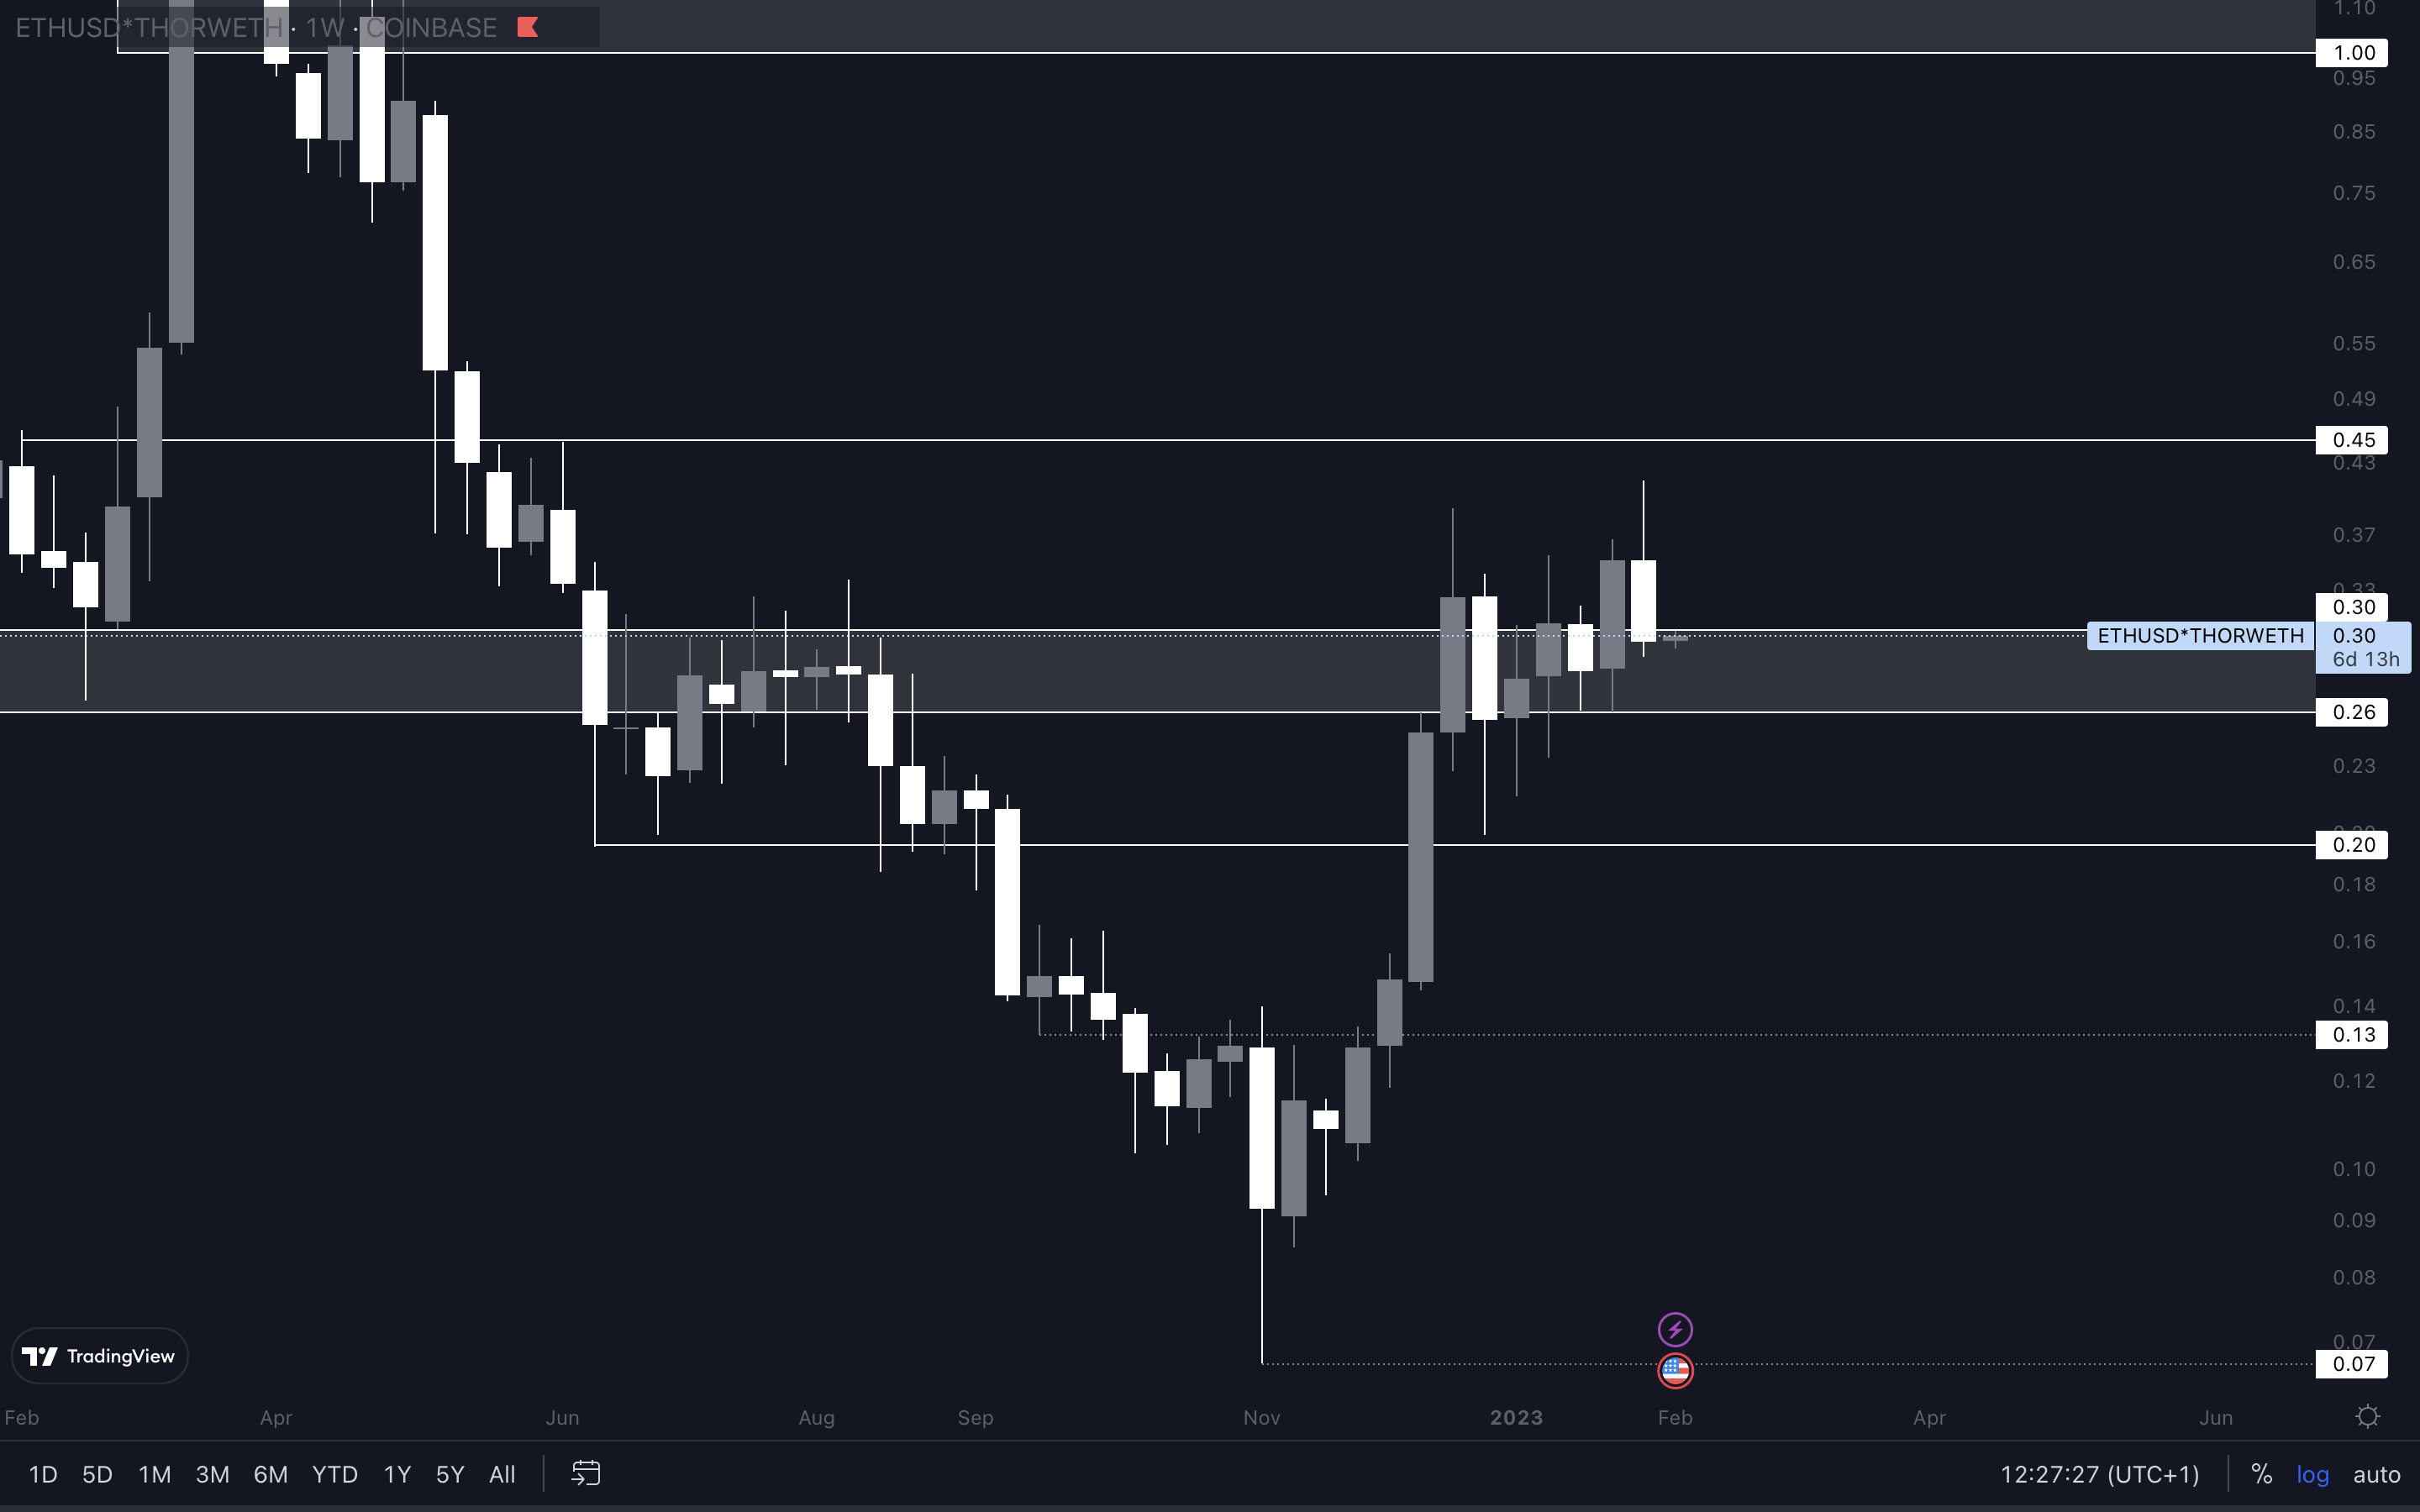
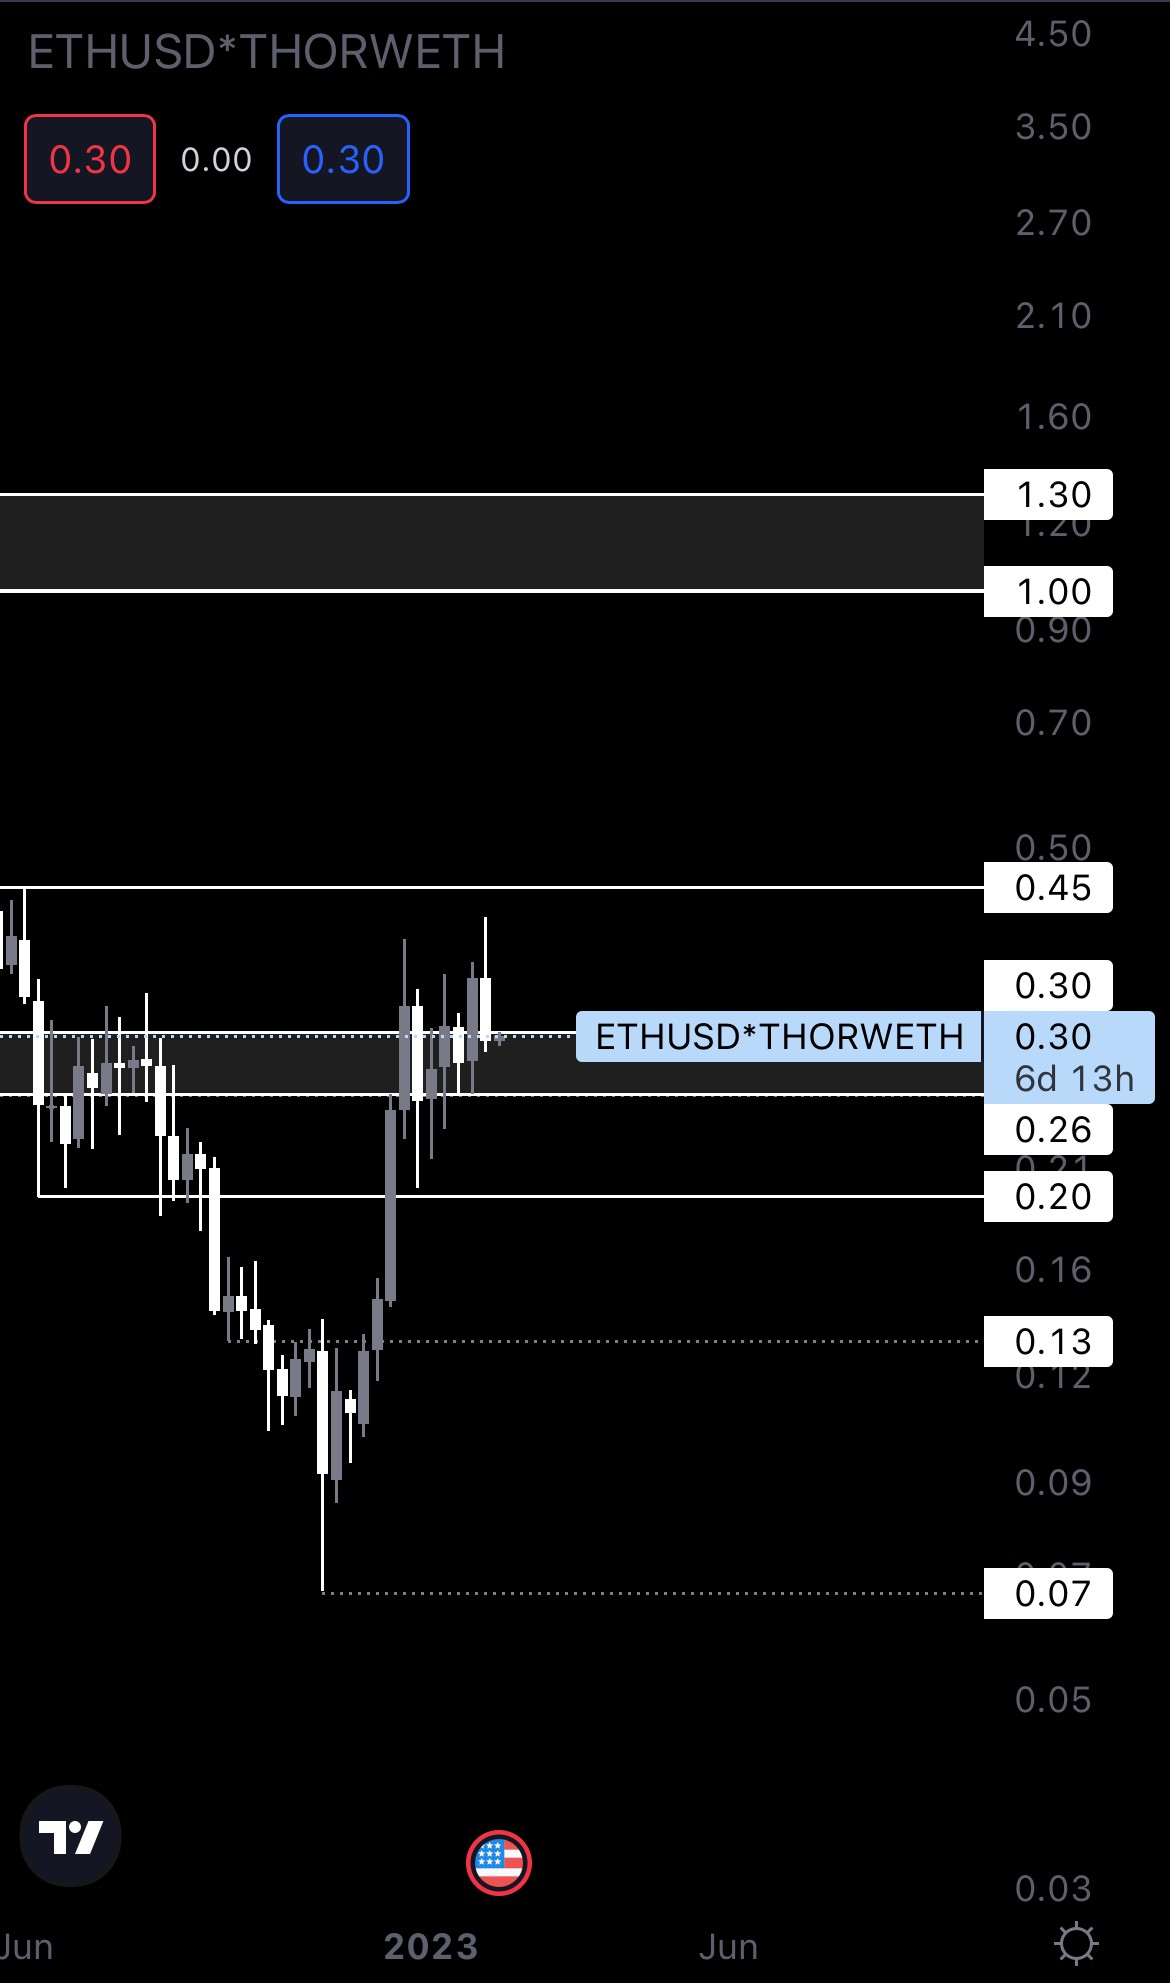
THOR’s symmetrical triangle was invalidated, as its price dropped back inside it yesterday. For that reason, we’ve removed it from the chart.
The asset is back in the $0.30 - $0.26 support area, and we should expect it to reach $0.26 soon, based on the rest of the market’s trajectory in the short term. A loss of $0.26 would put $0.20 on the cards.
MINA | Mina Protocol
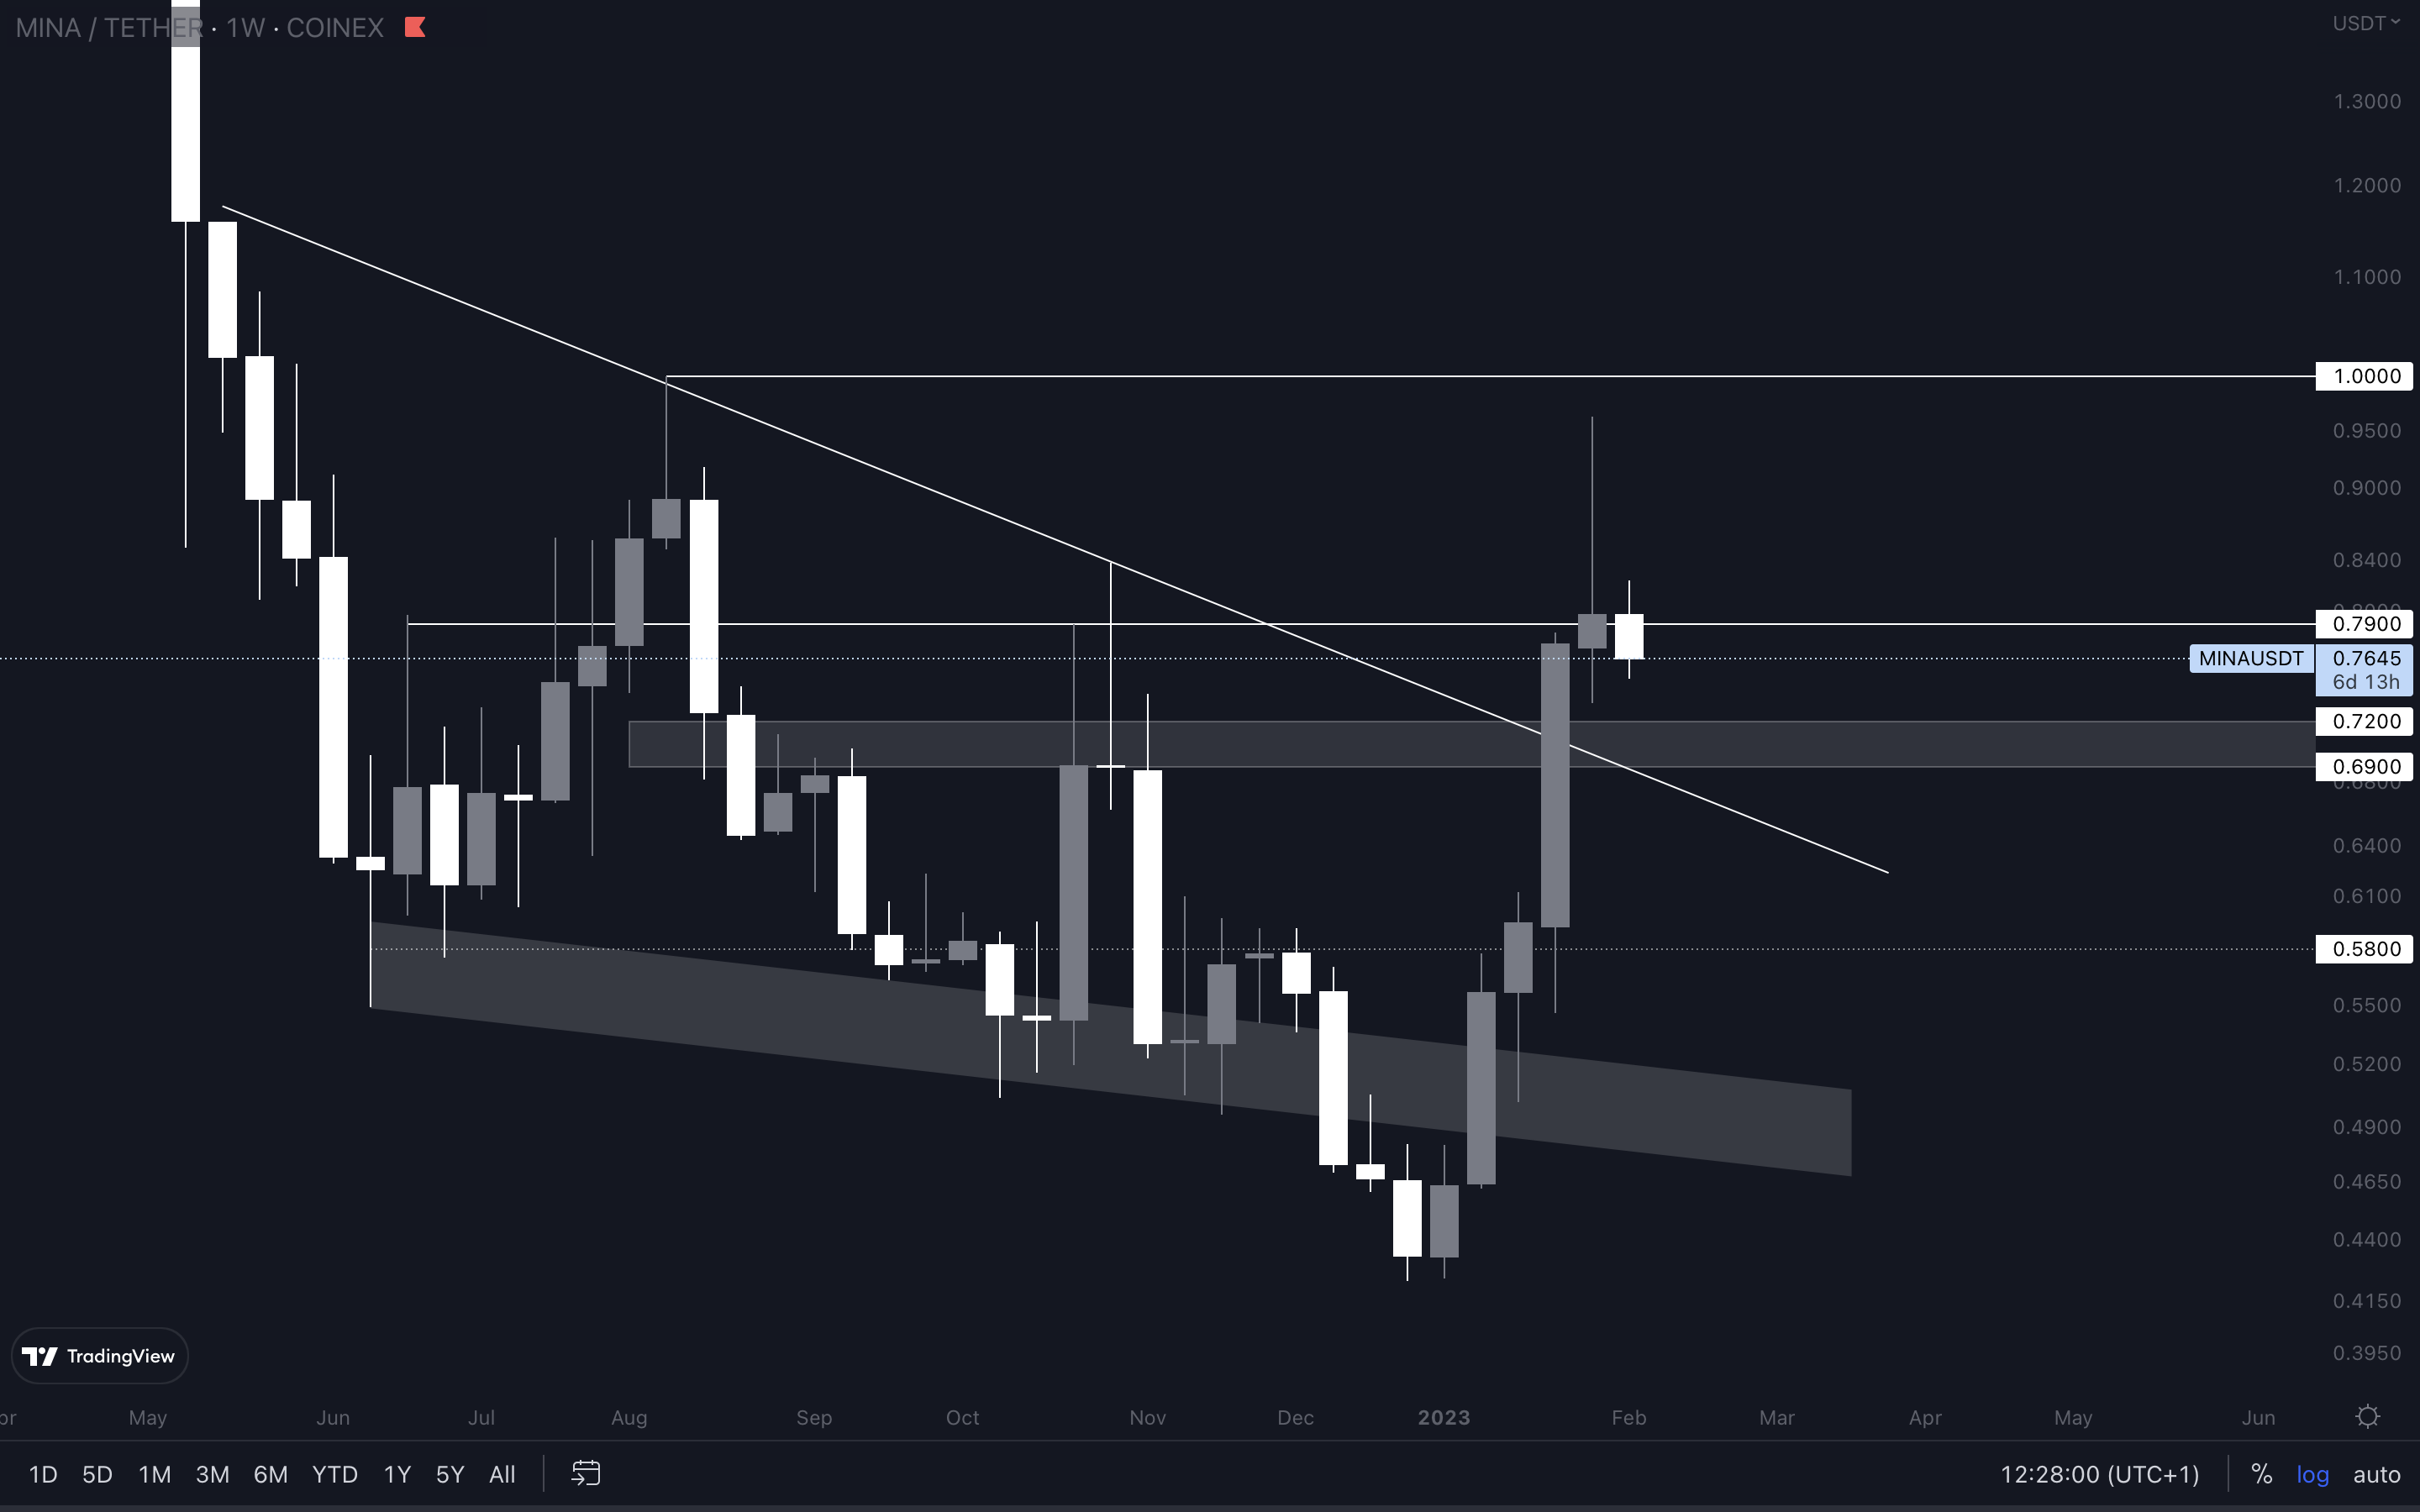
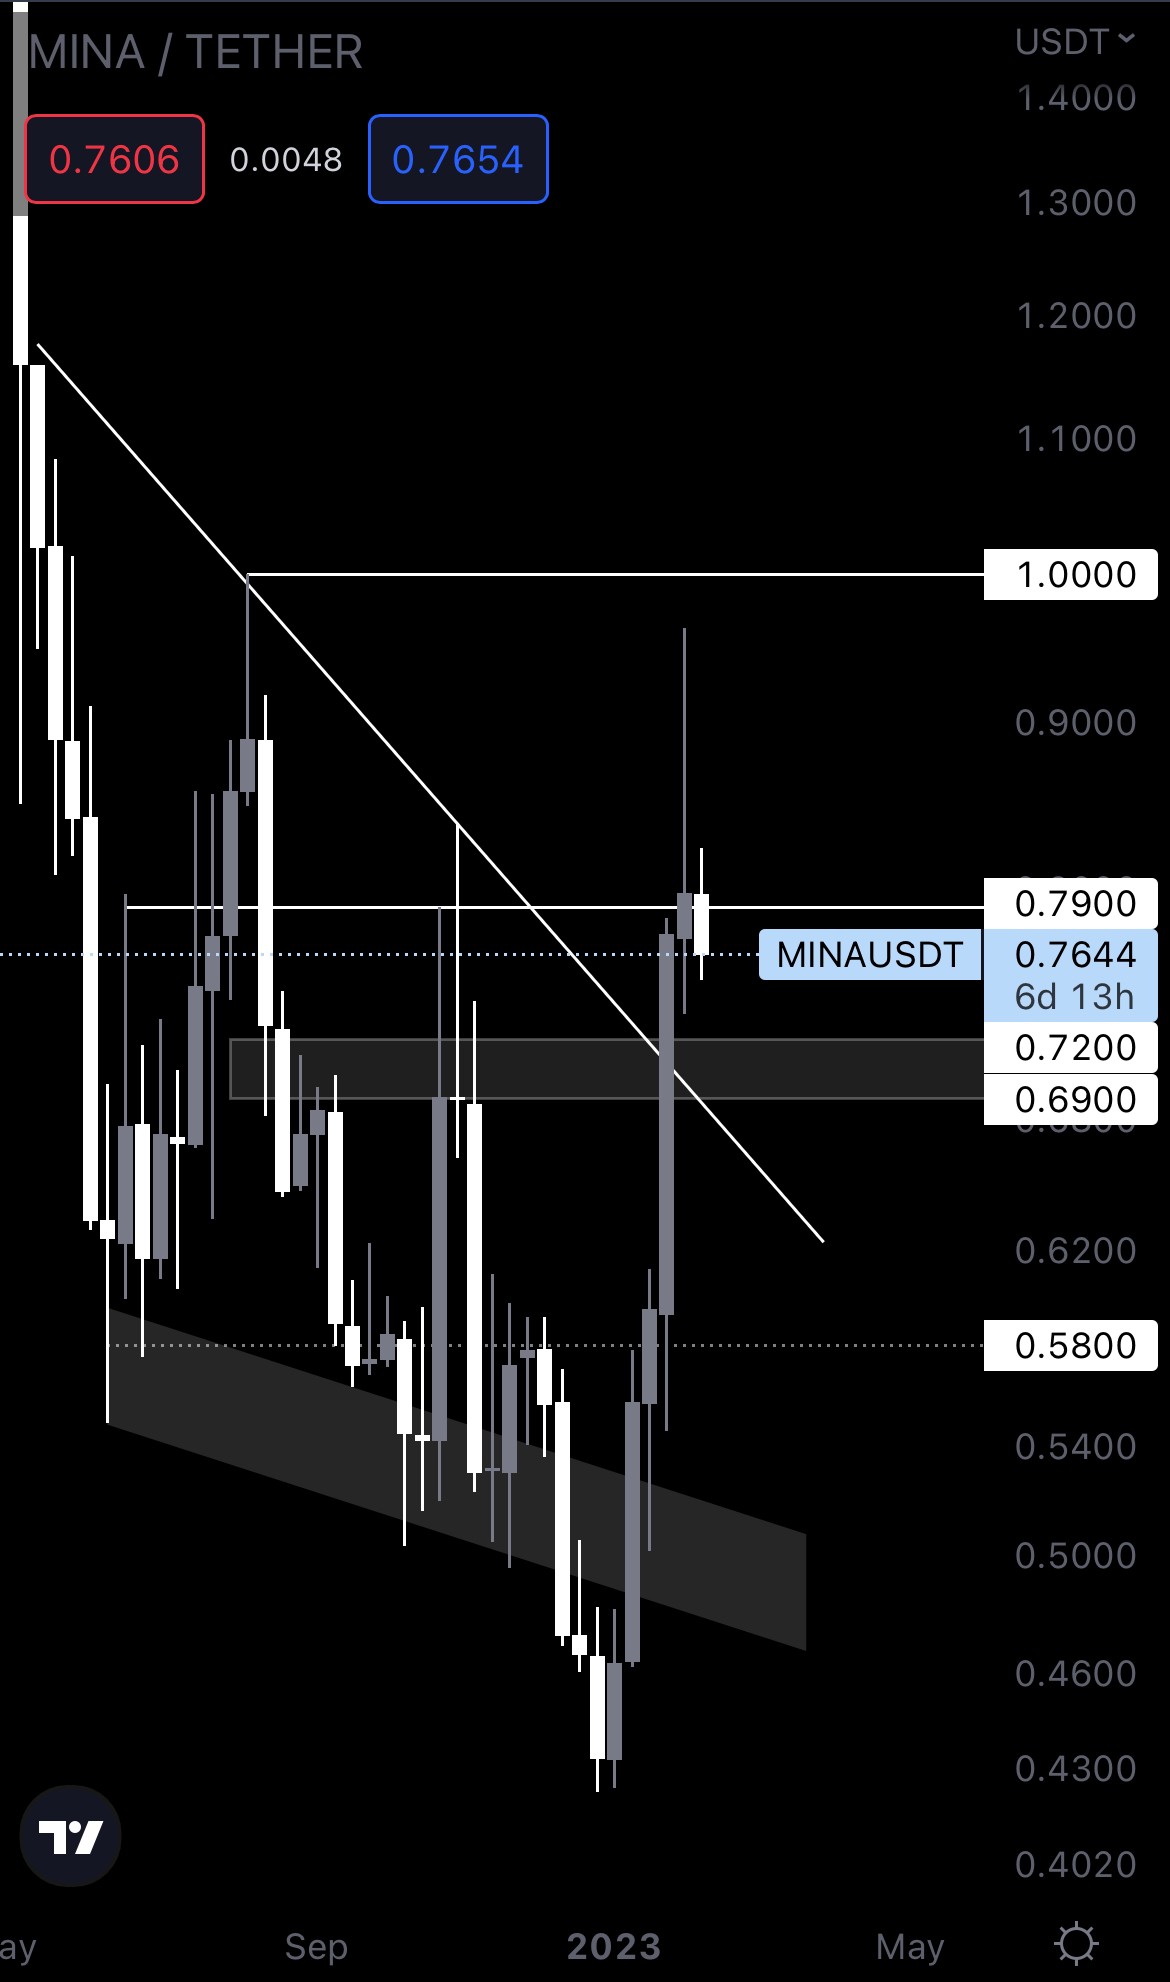
Although MINA closed last week’s candle slightly above $0.79, it still might head down to retest the next support area between $0.69 - $0.70. For upside to continue, we need the $0.69 - $0.72 support area to hold. A weekly closure under $0.69 would most likely push MINA back inside the falling wedge, invalidating any further upside until we see it break resistance again.
Cryptonary’s take
We might be looking at downside in the short term, something we have been expecting for some time. While we believe the short-term price action (next few weeks) will be bearish, our views for this rally haven’t changed, and more upside will likely come in Q1 and Q2 of 2023.
- Taking partial profits now is recommended, as the risks of a pullback have increased. This will leave room for lower entries if a pullback does occur.
- Tracking altcoins simultaneously with BTC is your best play. This will help you understand where local bottoms may form and identify good entry points.
Recommended from Cryptonary


