Save 23% ($351) & Get a Free 1-1 Call with our Team ⏰ : 0d 2h 59m 43s
Altcoin Opportunities

For the traders
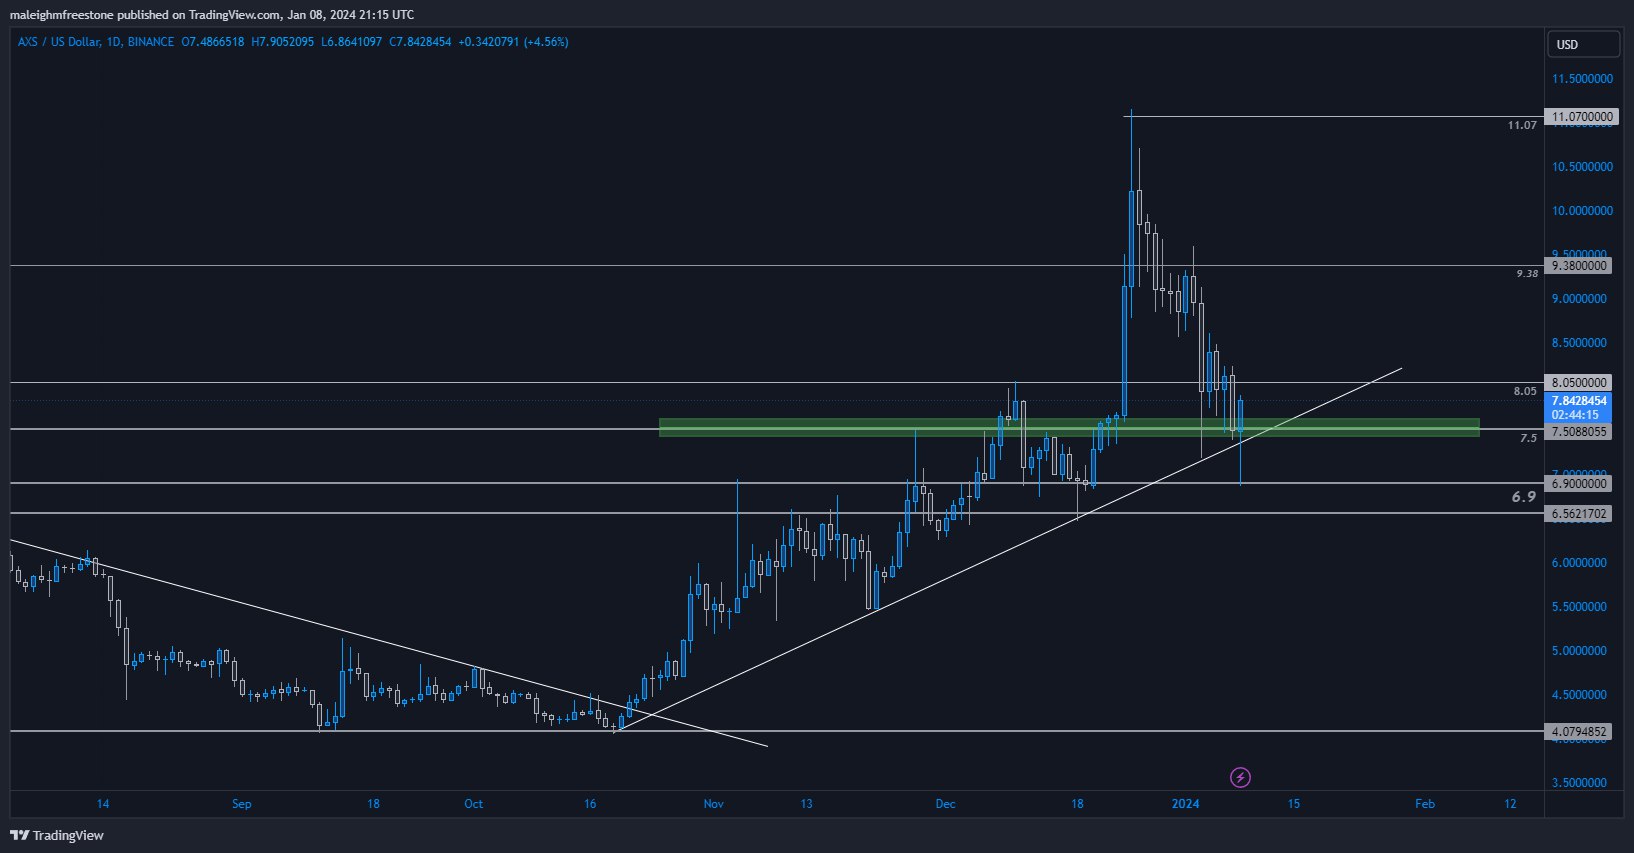
More and more lessons regarding higher time frame closures, as we can see, AXS spiked through our level of interest.This is why we view the higher time frame charts, guys, because now, if we can close strong on this daily, we have a very strong signal for further upside—a hammer candle forming on both a diagonal and horizontal level of support. Let's break down the scenarios.
We're looking to take out 11.07 eventually. It's a bit of a win-win.
Scenarios
Scenario 1: If we close like this, it's looking great for the upside. The market may pull back slightly intraday, but that'll only provide a better risk-to-reward ratio.Scenario 2: If we break lower, we're seeking 6.9, which has shown clear demand and a rejection, so it'll be a nice pullback.
Highest probability entry zone
$7.5 (strong daily closure).For the holders
It's a great pullback after a good recent performance; definitely a good place for the long-term holders to acquire more here.It may sound like a broken record, but in pullbacks, just take opportunities when you can.
Accumulation levels
$7.5 to $6.9Cryptonary's take
Lesson on the importance of higher time frames—stay out of the mess.Other than that, traders, if we can close strong, it's looking good.
And investors, fill your boots.
Recommended from Cryptonary


PRO
Market Direction
11 min read
Mar 24, 2026

PRO
Market Updates
8 min read
Mar 23, 2026
PRO
Market Direction
13 min read
Mar 20, 2026
