Save 23% ($351) & Get a Free 1-1 Call with our Team ⏰ : 0d 2h 59m 43s
Battle of Majors (VI): BTC vs ETH vs SOL vs HYPE
The market has been coiling up for weeks, with fear increasing at the slightest signs of weakness. Bitcoin is consolidating after leading the charge, and the focus now is shifting to what comes next- Ethereum, Solana, and our latest high-conviction pick, HYPE. Welcome back to the Battle of Majors…
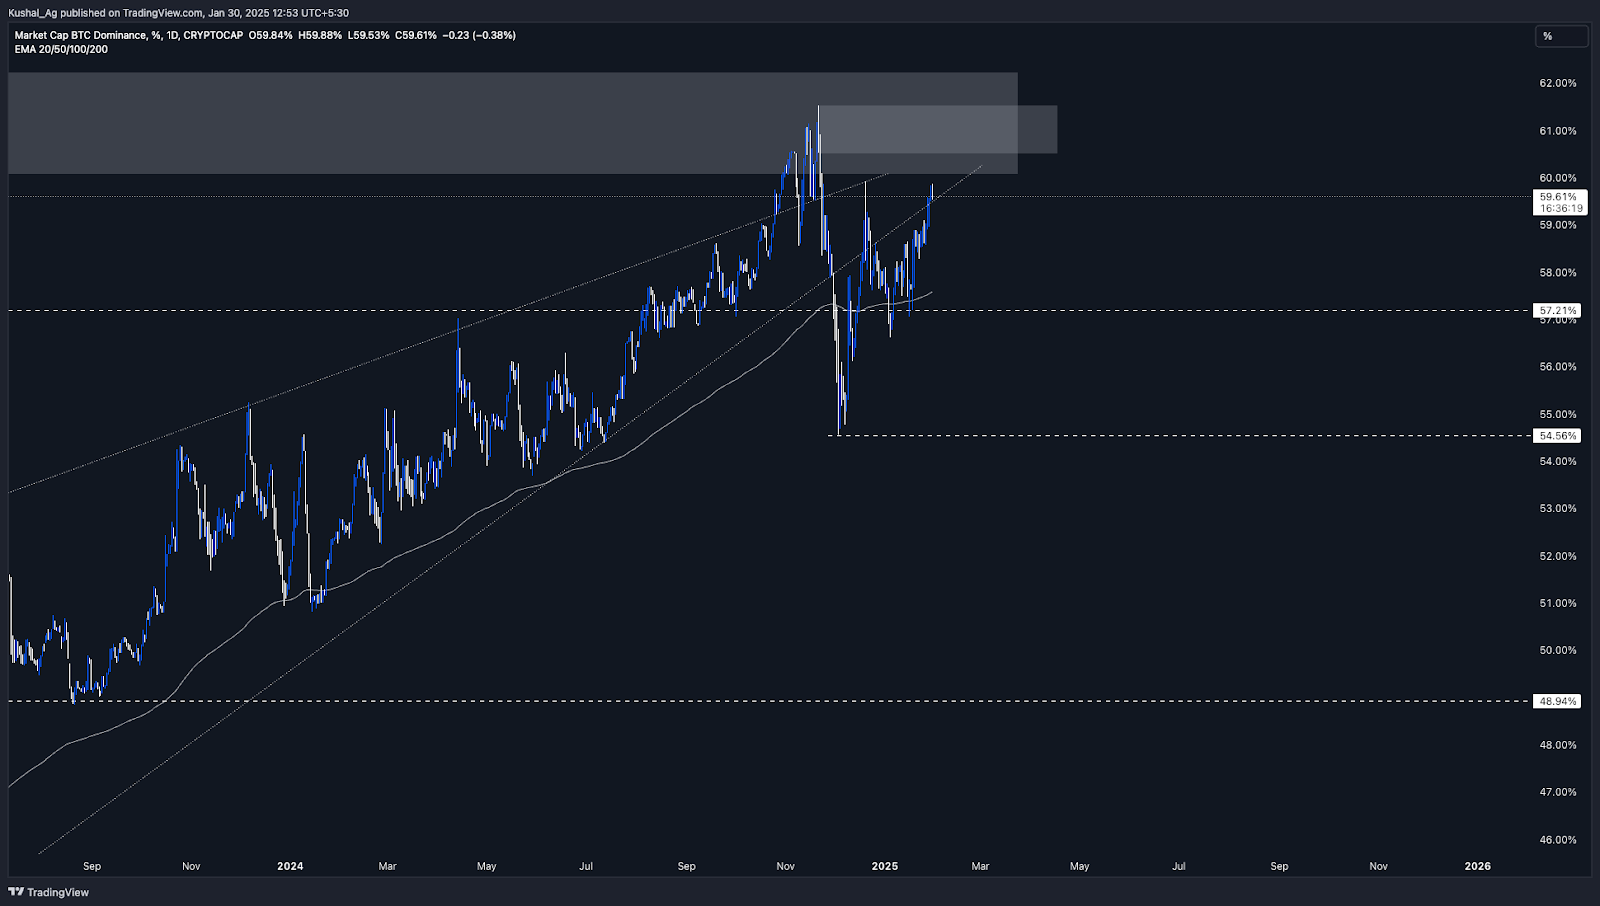
The past few months have been a game of patience. Total Market Cap has been locked in a range; Bitcoin dominance has been climbing up after hitting a low of 55.5% and is back to the 60% range right now, hovering just below it around 59.58%. But now, we're entering the moment where the next market leaders start to take shape.
Solana has been a dominant force in this cycle, outperforming Ethereum and capturing more market share than ever. But as the market evolves, a new player has entered the arena-HyperLiquid, which is also the latest addition to our Cryptonary's picks.
In this sixth edition of Battle of the Majors, we analyze how the Total Market Cap is positioning itself just under the range top of its consolidation, whether Bitcoin dominance has peaked, and how Ethereum, Solana, and HyperLiquid are competing in this market rotation. With money flowing into new narratives, we break down where the real opportunities lie and what's setting up to move next.
So, let's dive in!
Disclaimer: This is not financial or investment advice. You are responsible for any capital-related decisions you make, and only you are accountable for the results.
Total market cap
As usual, we will start with the Total Market Cap. On the daily timeframe, Total Market Cap has been ranging for the past 50-55 days after reaching $3.73Tt its all-time high. Price has moved sideways, establishing a well-defined range between $3.03t and $3.67t, with a crucial midpoint at $3.35t.
This midpoint has been a pivotal level, acting as both support and resistance depending on which side of the channel price is trading. This prolonged consolidation has created a tightening structure, where liquidity is being tested at both the top and bottom of the range before a decisive move occurs.
Throughout this range-bound period, price action has been choppy, with multiple liquidation events and failed breakout attempts. We will look into more details about this below.
Meanwhile, the orange trendline, which previously acted as resistance, has now been reclaimed and is acting as support. While this suggests price is holding steady, it is still too early to confirm directional bias.
Recent developments:
- Choppy Price Action & Liquidations: Total has been attempting to break out, but each breakout has resulted in quick rejections and wicks outside the range.
- Mid-December: A breakout attempt to $3.73T was quickly reversed.
- Mid-January: A breakdown to $3.02T was brought back up immediately.
- Recently, A wick to $3.69T tested the top of the range again.
- Trendline Breakout: Total is breaking out of a short-term orange downtrend trendline and holding above it. However, given the choppy environment, it's too early to confirm a breakout.
Key Levels:
- Support:
- $3.35T - Midpoint of the consolidation range
- $3.03T - The lower boundary of the range.
- $2.82T (200 EMA) - A critical support if a deeper pullback occurs.
- $2.72 - March 2024 higher high on the daily timeframe now turned into support
- Resistance:
- $3.7T-$3.73T - The upper boundary of the range. A clean breakout above this level would confirm a strong move higher.
BTC dominance (BTC.D)
Now, let's move to Bitcoin's dominance. BTC.D has been in a highly volatile phase over the past few months, with a significant breakdown followed by an aggressive recovery. On the daily timeframe, BTC.D initially broke below the 58% level at the end of November and quickly dropped to 54.5% within days.However, it rebounded sharply and is now trading at 59.62%, reclaiming lost ground and retesting previous resistance levels.
Key observations:
- Two scenarios in play:
- Bearish Retest: The breakdown below 58% could indicate that Bitcoin dominance has peaked, and this current move is a retest before another decline. If this scenario plays out, BTC.D will soon lose momentum and resume its descent.
- Extended Consolidation: If Bitcoin's dominance proves stronger than anticipated, it may consolidate in this zone before making its next decisive move.
Support & resistance levels:
- Supply Zone on the Upside:
- In terms of daily timeframe, BTC.D has a strong supply area of between 60.53% and 61.54%, which is its high for 2024.
- Currently, BTC.D is testing the wedge it previously broke down from, and this area will dictate whether the reversal continues or if BTC.D consolidates further.
- Support zones on the downside:
- 57.53% - 57.21%: A key support zone, aligning with the 200 EMA on the daily timeframe (currently around 57.58%). If Bitcoin dominance breaks down, this is the first major level to watch.
- 54.5%: The December low and a crucial level that, if broken, will confirm the broader reversal in Bitcoin dominance.
ETH/BTC
Unfortunately, Ethereum has continued to struggle against Bitcoin, breaking below its 2024 all-time low of 0.0319 and making a fresh four-year low of 0.0299. This breakdown highlights Ethereum's weak performance relative to Bitcoin, placing ETH/BTC at a critical inflexion point.
Key observations:
- Testing Weekly Demand Zone: The pair has now entered its weekly demand area, which ranges from 0.0314 down to 0.0294. This zone is still unmitigated, making this an important level to monitor. If ETH/BTC holds this range, it could mark the local bottom.
- Lack of Strength: Ethereum has consistently underperformed, failing to show momentum against Bitcoin. This has resulted in sustained downward pressure, with Bitcoin dominance remaining elevated.
Support & resistance levels:
- Support:
- 0.0314 - 0.0294 (Weekly Demand Zone): This is the last major accumulation area for ETH/BTC before entering uncharted territory. A failure to hold this zone would signal continued weakness.
- Resistance:
- 0.04 Region: This remains the most important level to reclaim. ETH/BTC was unable to break this resistance in Q4 2024, and it continues to act as a major barrier to Ethereum's relative strength.
SOL dominance (SOL.D)
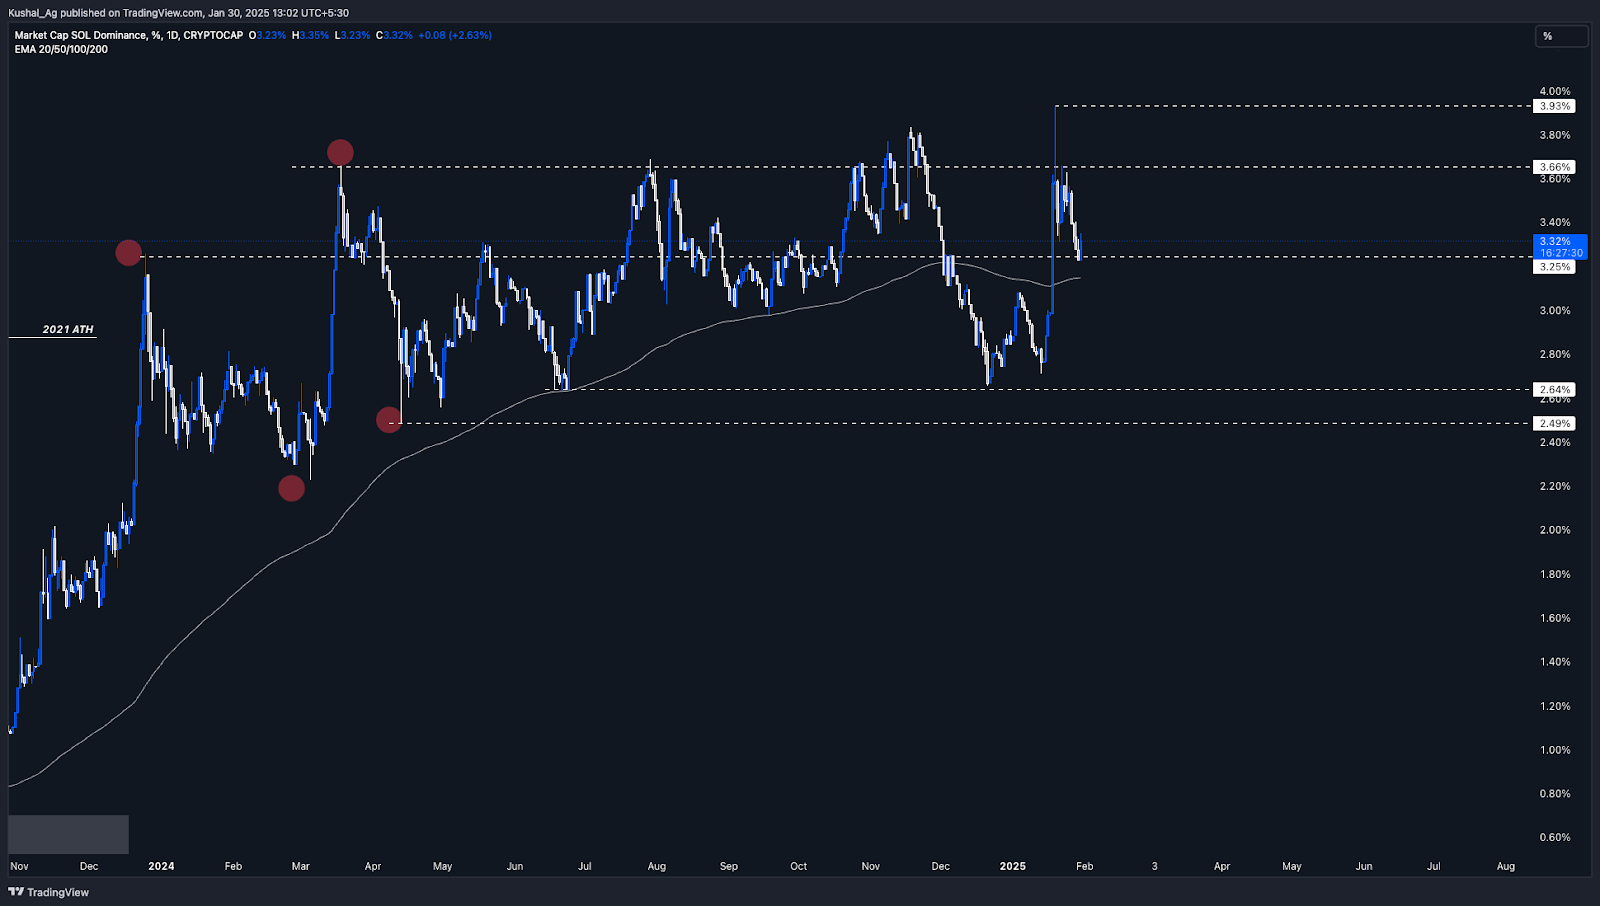
Here is some good news: Solana Dominance has continued to gain market share, recently hitting a new all-time high of 3.93% on January 19th. This move came after a successful retest of its 2.64% support level in late December, where SOL.D formed a double-bottom structure before surging upward.
Key observations:
- Major Catalyst: The sharp move in Solana dominance was largely driven by Trump's announcement of his meme coin launching on Solana, further validating the chain as the go-to network for memecoins. This move brought significant attention to Solana's ecosystem, reinforcing its dominance in this space.
- Rejection at 3.66%: Despite wicking to 3.93%, Solana Dominance was unable to hold above the 3.66% resistance level, leading to a pullback toward its 3.25% support.
Support & resistance levels:
- Support:
- 3.25% region - A strong support level where SOL.D is currently consolidating.
- 200 EMA (Daily) at 3.15% - This aligns with the lower bound of the support zone, acting as another strong defence for Solana Dominance.
- Resistance:
- 3.66% - The key resistance level that needs to be flipped for SOL.D to continue its uptrend.
- 3.93% (New All-Time High) - If Solana Dominance clears 3.66%, this will be the next key level to watch.
SOL/ETH
Solana has continued to outperform Ethereum, with SOL/ETH reaching a new high of 0.0936, surpassing its previous all-time high of 0.079 from November. However, this breakout was marked by a deep wick, with no candle closures above 0.0798, suggesting that sellers stepped in aggressively at those levels.Key observations:
- Strong Base at the 200 EMA: The pair bottomed out at 0.057, aligning with the 200 EMA on the daily timeframe, where it consolidated for over a month from early December to January. This base-building phase provided the foundation for its parabolic rally from 0.057 to 0.0936.
- Parabolic Rally & Sharp Rejection: After consolidating, Solana/Ethereum surged straight up, clearing multiple resistance levels before wicking to 0.0936. However, sustained price action above 0.0797 was not achieved, and SOL/ETH has since retraced.

Support & resistance levels:
- Support:
- 0.0725 - Current lower bound of the range.
- 0.064 & 0.061 - Major support levels below, both of which held well in previous retracements.
- Resistance:
- 0.0797 - The critical resistance preventing SOL/ETH from sustaining higher.
- 0.0936 (New ATH) - The next key level if 0.0797 is cleared.
SOL/BTC
The Solana/Bitcoin ratio has been in prolonged consolidation for over a year, ranging between 0.00278 on the upside and 0.0018 on the downside. Within this broader range, 0.00223 has proven to be a key level, frequently acting as strong support. Currently, SOL/BTC is trading at 0.00227, just below the 200 EMA on the daily timeframe, as it continues to coil up.Key observations:
- Prolonged Accumulation: The long-term consolidation structure suggests that Solana is building strength before making its next decisive move.
- Double Bottom Formation: SOL/BTC formed a double bottom at 0.00182 between late December and early January before breaking above the 0.00223 neckline, confirming the pattern.
- Rejection from range top: Following the breakout, SOL/BTC wicked to 0.00281, rejecting from the 0.00278 resistance and pulling back into the range.
Support & resistance levels:
- Support:
- 0.00223: A major inflexion point and the neckline of the double bottom pattern.
- 0.00182: The lower bound of the range, marking previous multi-month support.
- Resistance:
- 0.00265: The area has seen to be a difficult one to flip with major rejections seen in the past.
- 0.00278: The upper boundary of the range, which rejected price action recently.
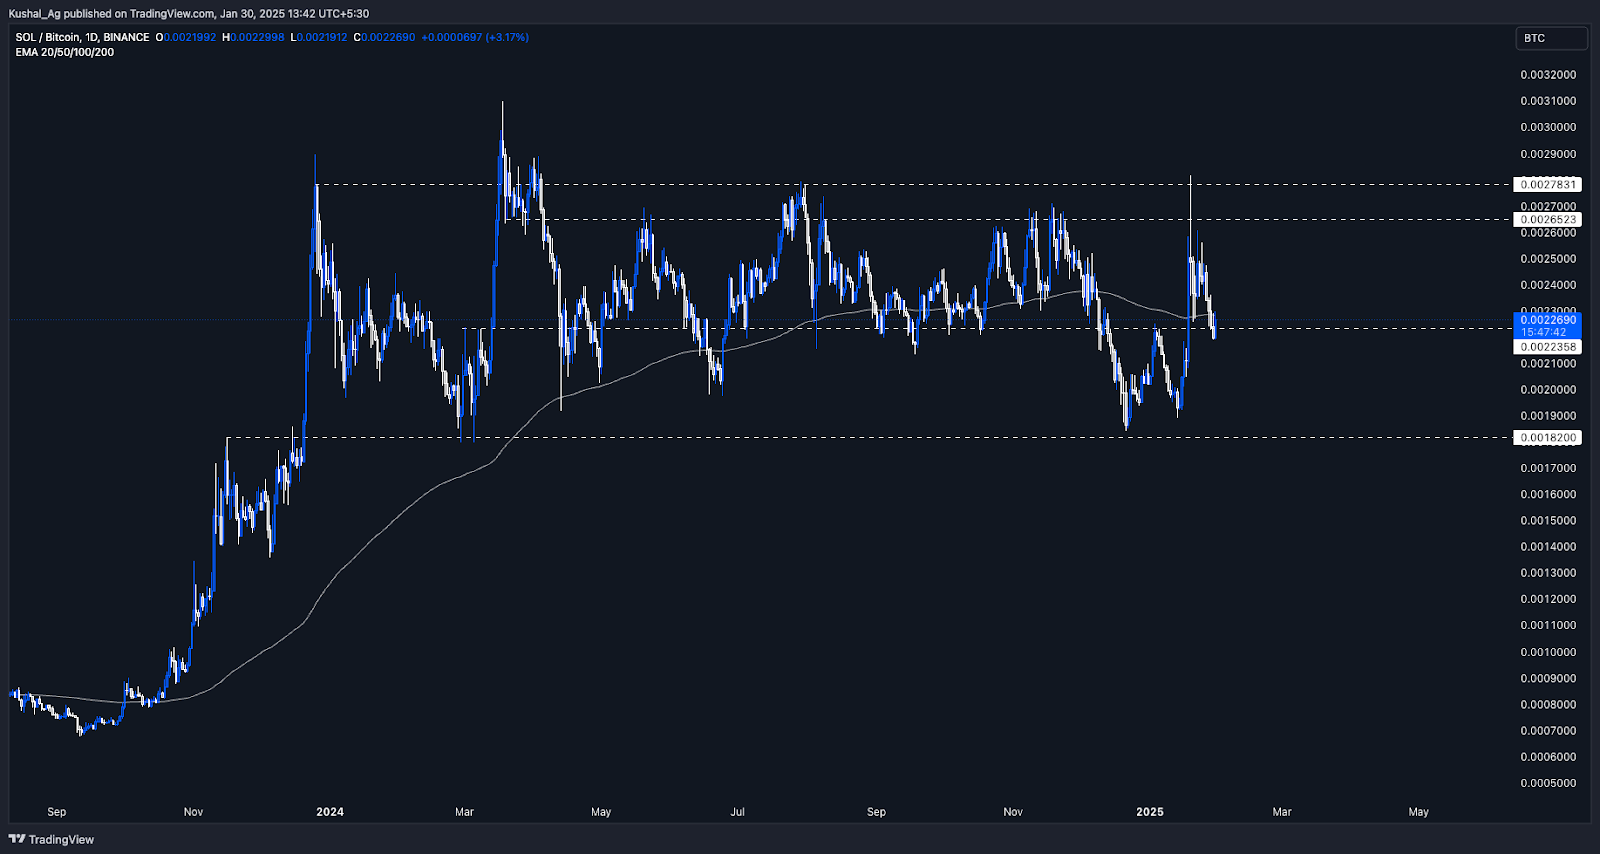
SOL/BTC is stuck in the middle of its range, with the price chopping around the 200 EMA. A clear break above 0.00278 would confirm a bullish continuation, likely leading to further outperformance from Solana. However, if the pair fails to hold 0.00223, we could see another retest of 0.00182 support before another breakout attempt.
HYPE/SOL
Hyper Liquid has been consolidating against Solana after peaking at 0.194 in late December. Since then, the pair has been in a lower-high, lower-low structure, respecting a downtrend trendline marked by an orange resistance line. Recently, this trendline was broken to the upside, signalling a potential reversal in the trend.
Key observations:
- Breakout Confirmation: On the 4-hour timeframe, HYPE/SOL has flipped the 200 EMA (currently at 0.103) and is now trading at 0.107, sitting exactly in a crucial support zone.
- Resistance levels:
- 0.122 - First resistance level to watch.
- 0.135 - Key level if the momentum continues.
- Support levels:
- 0.103 (200 EMA, 4H) - Crucial short-term support.
- 0.087 - Deeper support level if price fails to hold above 0.103.
HYPE/BTC
Hyper Liquid/Bitcoin follows a similar structure to HYPE/SOL, but it is more choppy and volatile. The pair has been ranging between two key levels (marked as Line 1 and Line 2) for several weeks. A breakout of the orange downtrend line occurred about a week ago, but the price has struggled to sustain momentum after taking rejection from Line 2.
Key observations:
- Choppy price action: HYPE/BTC has been consolidating between Line 1 and Line 2, creating a range-bound environment.
- Recent rejection: After breaking the downtrend, the price was rejected from Line 2, pulled back to Line 1, and has now been rejected from Line 2 again.
- Support & resistance levels:
- Support: Line 1 is the critical demand zone where price has consistently found buyers.
- Resistance: Lines 2, 3, 4 and 5 act as consecutive resistance points, with Line 5 being the all-time high for HYPE/BTC.
- 200 EMA as a Midpoint: The 200 EMA on the 4-hour timeframe sits exactly in the middle of this range, acting as a pivot level within the consolidation.
Cryptonary's take
Bitcoin has run its course, dominance is testing its limits, and Total Market Cap is compressing for the next breakout. The $3.73T level is the final threshold-once breached, we enter uncharted territory.Ethereum has been at its lowest point in years, yet every reversal starts with extreme weakness. If ETH/BTC holds, capital will begin shifting from Bitcoin to Ethereum and from Ethereum into the broader market. Solana remains the top-performing asset of the cycle, but a new challenger has emerged: HyperLiquid. The battle for leadership is about to unfold, and we are excited about what is coming.
This is where narratives are made and positions are defined-what happens next will determine the winners of this cycle.
Peace!
Cryptonary, OUT!
Recommended from Cryptonary


