Save 23% ($351) & Get a Free 1-1 Call with our Team ⏰ : 0d 2h 59m 43s

Over the past two weeks, the market has experienced sideways price action across most coins. However, last week saw a brief push on the upside when BTC broke above the $60-$62k range, testing $65k. This quick squeeze-up led to a positive reaction in several coins, allowing them to gain momentum above their previous ranges.
The overall market appears to be in a consolidation phase, with sideways price action likely to continue in the short term. However, the market seems to be getting closer to its next significant pump-up.
Today, we'll begin by analysing the total market cap (TOTAL) to provide context for the entire market. We'll then dive into the ratios of the majors, focusing on the ETH/BTC and SOL/BTC pairs, and assess a few additional charts.
Disclaimer: This is not financial or investment advice. You are responsible for any capital-related decisions you make, and only you are accountable for the results.
TOTAL (Total Market Cap)
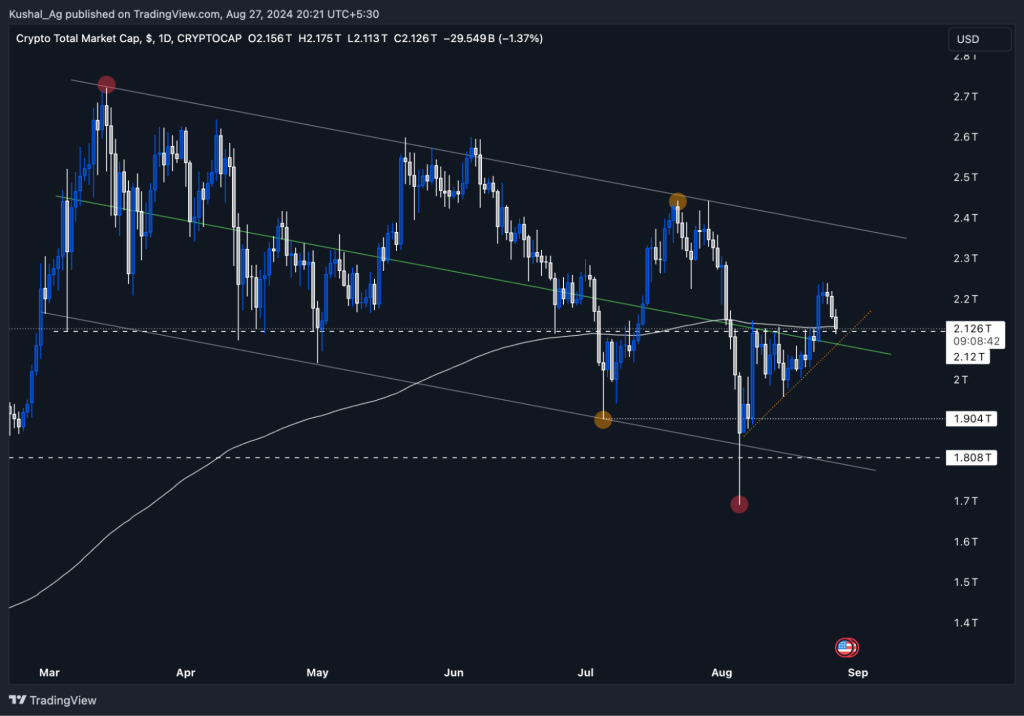
Current state: TOTAL was observed squeezing under the 200 EMA (white line) and the 50% level of the bull flag it has been forming (Green line). On Friday, following the market's positive reaction to the Federal Reserve's Jackson Hole event, TOTAL broke to the upside from this squeeze, gaining approximately 6% and establishing itself in the upper part of the bull flag.Key observations
- Support: The $2.12T resistance has now flipped into support, along with the 200 EMA and the 50% retracement level of the bull flag. This flip is crucial for the market to continue fueling its next leg higher.
- Retest: Today, we saw the market come back to the $2.12T mark for a retest, and it's holding strong. Price is now even taking support and trading above the 200 EMA.
- Potential scenario: The market has reclaimed a good area for shorter-term price action. The $2.12T level holds strong, and while a slip below it might occur, it would likely be a liquidity grab rather than a sustained drop. If such a flush occurs, a quick reversal with prices making new highs in the lower timeframe is probable.
Conclusion
The market has shown strength by reclaiming and holding the $2.12T level. This area now serves as a solid support, and the current structure suggests that the market is well-positioned for further upward movement.ETH/BTC
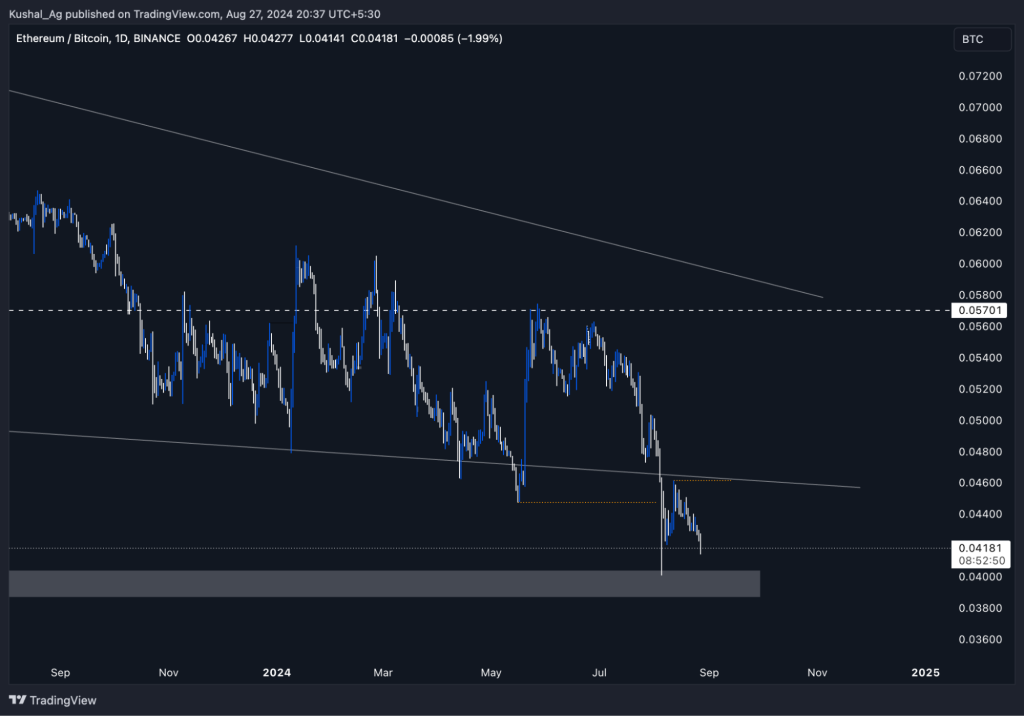
Current state: ETH/BTC has been trading within a long-standing falling wedge on the weekly timeframe. The pair tested and liquidated zones below the lower end of the wedge around the 0.04 level, which has acted as significant support. However, ETH/BTC has yet to show clear signs of reversal.Key observations
- Support: The price is heading back towards the grey support zone, indicating that ETH/BTC may continue to consolidate within this area before attempting a move higher.
- Resistance: Flipping above the 0.0046 level is crucial for ETH/BTC to get back into the weekly wedge and regain bullish momentum. This level serves as a key resistance that must be overcome for ETH to start moving higher.
- Potential scenario: The pair will likely remain choppy until ETH/BTC flips the 0.0046 level and re-enters the wedge. However, once ETH/BTC begins to reverse, we can expect a good inflow of capital into ETH, which will likely be accompanied by a broader altcoin rally.
Conclusion
ETH/BTC remains in a critical consolidation phase, with the 0.0046 level acting as a pivotal resistance. A break above this level would signal the end of the current choppy price action and could lead to significant capital inflows into ETH, driving a broader altcoin market rally.SOL/BTC
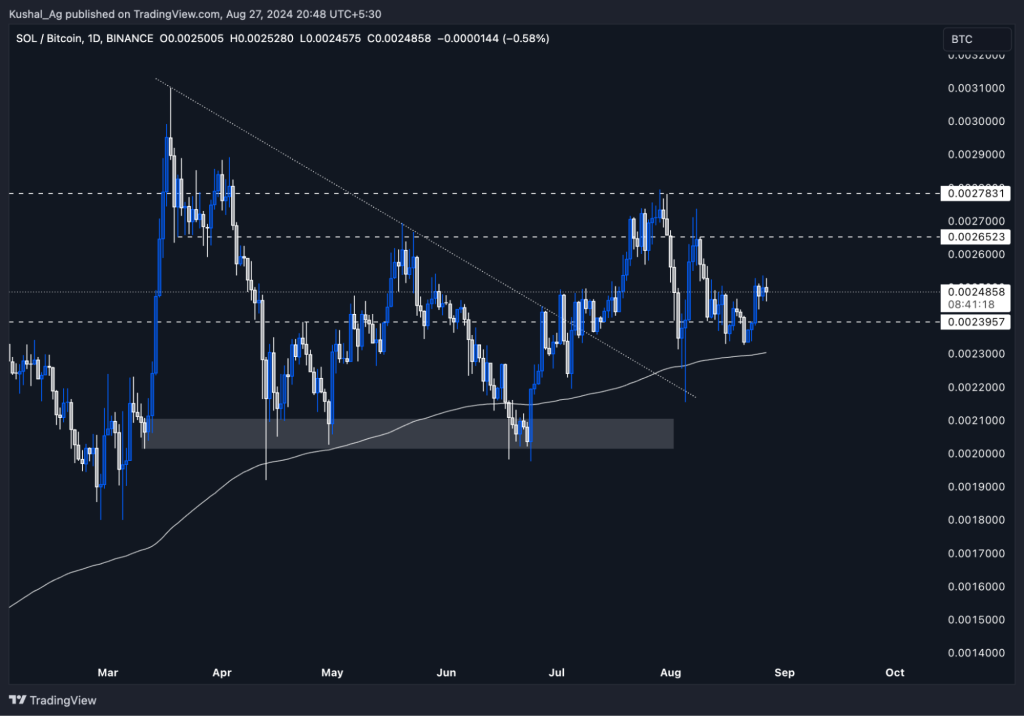
Current state: SOL/BTC has been trading above the 0.0024 range, taking support from this level as indicated by the dotted white line. Despite the broader market facing some downward pressure today, SOL/BTC has held up relatively well, showcasing SOL's strength against BTC.Key observations
- Support: The 0.0024 level, reinforced by the 200 EMA, has provided strong support for SOL/BTC. Additionally, the 0.0023 level serves as another key support area on the downside, with the 200 EMA closely aligned.
- Resistance: On the upside, SOL/BTC faces resistance at 0.00265 and 0.00278. These levels will be crucial to watch as the broader market attempts to break out and move higher.
- Market dynamics: SOL's relative strength against BTC is an important indicator to consider when investing in an altcoin. The pair's ability to maintain support while other pairs face downward pressure suggests that SOL is well-positioned to outperform BTC once the wider market begins to show signs of breaking out.
Conclusion
SOL/BTC continues to demonstrate strength, holding key support levels and resisting broader market downturns. As the market moves higher, SOL is likely to outperform BTC, making it a strong candidate for those looking to invest in altcoins with favourable BTC pair performance.SOL/ETH
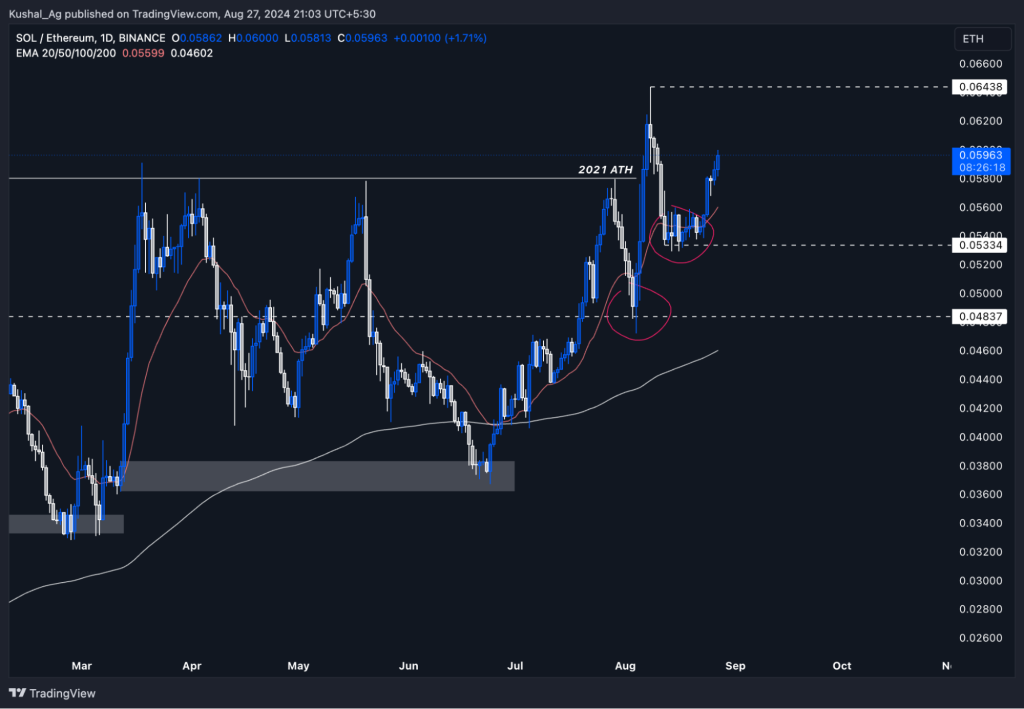
Current state: The SOL/ETH chart is one of the most impressive upward-trending charts on both the lower and higher time frames. This chart perfectly illustrates what we at Cryptonary have been emphasising for a long time: Solana is set to outperform. The pair has once again reclaimed its 2021 all-time high (ATH) and is holding strong at this level.Key observations
- Support: The 2021 ATH has been reclaimed, and SOL/ETH is currently holding this level with strength. I've also included the 20 EMA in today's analysis, which serves as an excellent indicator for identifying higher lows in a strong, bullish trend. We can see how beautifully 0.055 acted as a higher low, supported by the 20 EMA.
- Trend Confirmation: This support from the 20 EMA has been confirmed twice, as marked by the red circles on the chart. Each time, the price took solid support from the 20 EMA before moving higher, indicating that this trend is likely to continue.
- Resistance: On the downside, 0.053 has now emerged as a new support level for SOL/ETH, while the 0.064 level (ATH) serves as the key resistance on the upside.
- Market Dynamics: This chart strongly suggests that Solana is poised to outperform Ethereum in the coming months. The consistent strength and support from key levels highlight the bullish outlook for this pair.
Conclusion
SOL/ETH is displaying a textbook bullish trend, with strong support levels and a consistent upward trajectory. As Solana continues to outperform Ethereum, this pair remains one of the most promising indicators of Solana's potential dominance in the crypto market.BTC Dominance (BTC.D)
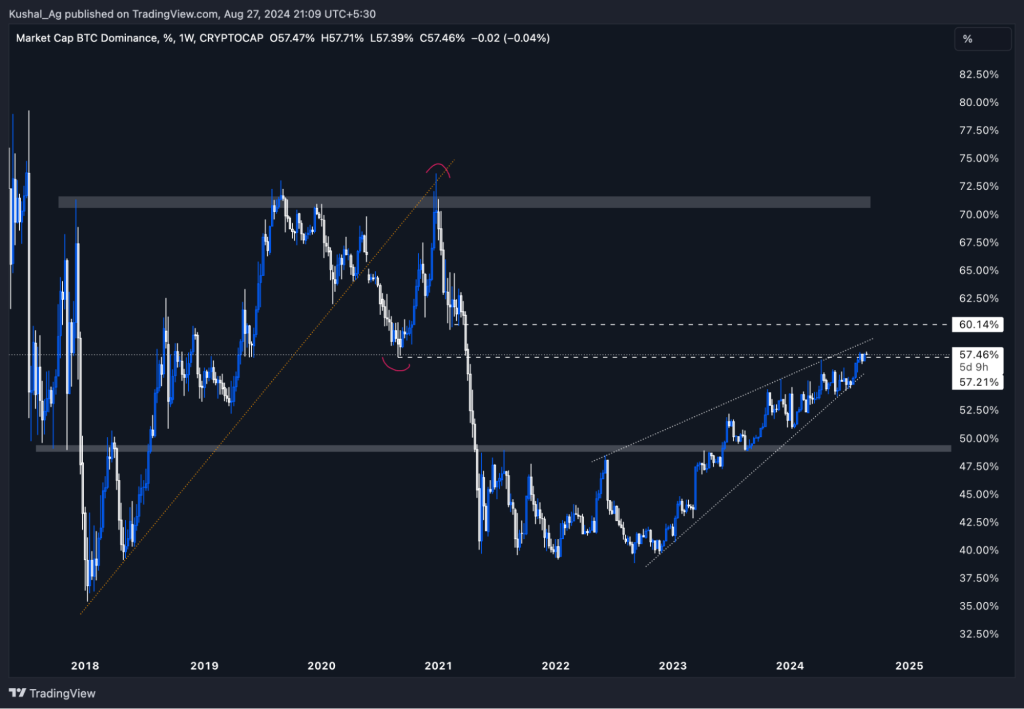
Current state: BTC dominance has continued to move within the long-standing rising wedge on the weekly timeframe, which has been developing for over two years. As BTC.D approaches the apex of this formation, the market remains at a critical juncture where a major move is imminent.Key observations
- Resistance: The 57% region continues to serve as a significant resistance level. This level aligns with the apex of the rising wedge, marking a historically important area where BTC.D previously formed a lower high before spiking to 72% and then sharply declining to under 40% in 2021.
- Potential scenario: While BTC.D could still rise towards the 60% level, this move is likely to represent the final leg before a potential breakdown from the wedge. Such a breakdown would likely result in a flow of capital from BTC into altcoins, potentially triggering the next altseason.
- Market dynamics: The prolonged consolidation within the wedge and the approaching apex suggest that BTC.D is nearing a decisive moment. The direction of the breakout or breakdown will have significant implications for the broader market, especially for altcoins.
Conclusion
BTC dominance remains at a critical point as it approaches the tip of a two-year rising wedge. The 57% resistance level is pivotal, and while a move to 60% is possible, a breakdown from this wedge could lead to a substantial shift in market dynamics, favouring altcoins over BTC.SOL Dominance (SOL.D)
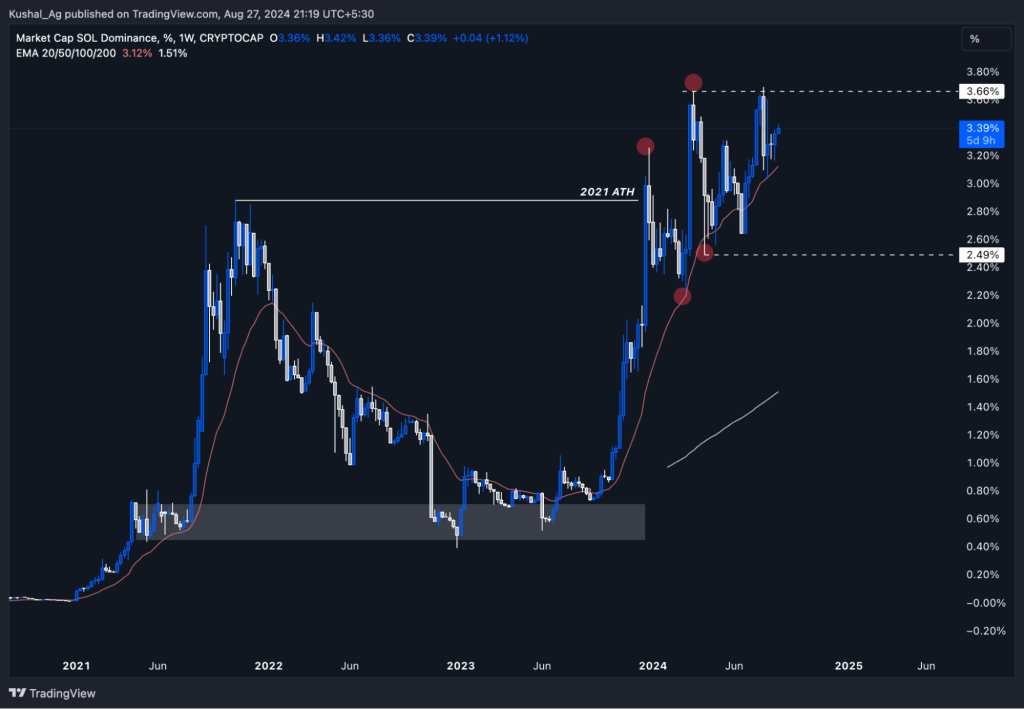
Current state: Today, we're analysing SOL dominance on the weekly timeframe to gain a cleaner and larger overall view of Solana's market position. Solana has been holding firmly above its 2021 ATH, consistently forming higher lows as it contracts within a range defined by the 3.66% level and the 20 EMA, which is marked by the red line.As mentioned earlier, the 20 EMA is a crucial indicator in trending markets, and it has once again proven to be reliable in SOL's ongoing trend.
Key observations
- Support: The 20 EMA, currently positioned around the 3.66% level, has provided strong support, helping SOL maintain its bullish structure. The 2.5% level remains the key support on the downside, ensuring that SOL retains its dominance within the broader market.
- Resistance: As SOL.D continues to squeeze within this range, the likelihood of a significant breakout increases. This move is expected to lead to Solana capturing an even larger share of the total market cap, reinforcing its position as a leading asset in the crypto space.
- Market dynamics: The ongoing contraction in SOL dominance suggests that the market is preparing for a significant move. With SOL holding above its 2021 ATH and the 20 EMA offering consistent support, Solana is well-positioned to increase its dominance in the coming months.
Conclusion
SOL dominance is squeezing into a pivotal range, with the 3.66% level and 20 EMA providing strong support. As Solana continues to consolidate, a breakout is likely, allowing SOL to capture a larger share of the total market cap. This chart remains one of the most bullish indicators for Solana's continued success.Cryptonary's take
The analysis across these major assets highlights several key correlations and confluences that are shaping the current market dynamics:- TOTAL and BTC.D: TOTAL's recent reclaim of the $2.12T level and BTC dominance's approach to a critical resistance at 57% indicate that the market is at a turning point. Should BTC's dominance break down from its rising wedge, we could see a significant inflow of capital into altcoins, driving TOTAL higher.
- ETH/BTC and SOL/ETH: Both pairs are showing signs of potential consolidation and upcoming moves. ETH/BTC remains in a choppy range, awaiting a breakout above 0.0046, while SOL/ETH continues to demonstrate a strong bullish trend, supported by the 20 EMA. These movements suggest that SOL will likely lead the charge among altcoins once the market conditions improve, especially against ETH.
- SOL/BTC and SOL.D: SOL's strength is evident across its BTC and ETH pairs and in its overall dominance. The bullish structure in SOL/BTC and the contracting pattern in SOL.D both indicate that Solana is preparing for a significant upward move, potentially outperforming both BTC and ETH as the broader market gains momentum.
With BTC dominance approaching a critical resistance, the potential for a capital shift into altcoins is growing, and Solana continues to stand out as a key player in this cycle.
At Cryptonary, we've long believed in Solana's potential to outperform this cycle, and the current data only strengthens this conviction. Whether it's SOL's dominance chart or its performance against BTC and ETH, Solana's influence in the market is undeniable.
The 20 EMA has consistently supported SOL's bullish trend, and the ongoing squeeze in SOL dominance suggests that a breakout is imminent, signalling further gains for Solana.
In summary, the pieces are in place for significant market movements. The majors are primed for action, and as the broader market begins to decide its direction, we expect Solana to continue leading the charge.
Recommended from Cryptonary


