Save 23% ($351) & Get a Free 1-1 Call with our Team ⏰ : 0d 2h 59m 45s
Disclaimer: This is not financial or investment advice. You are responsible for any capital-related decisions you make, and only you are accountable for the results.
BTC:
- BTC's Funding Rate is at 0.005%, indicating there is some Short interest here.
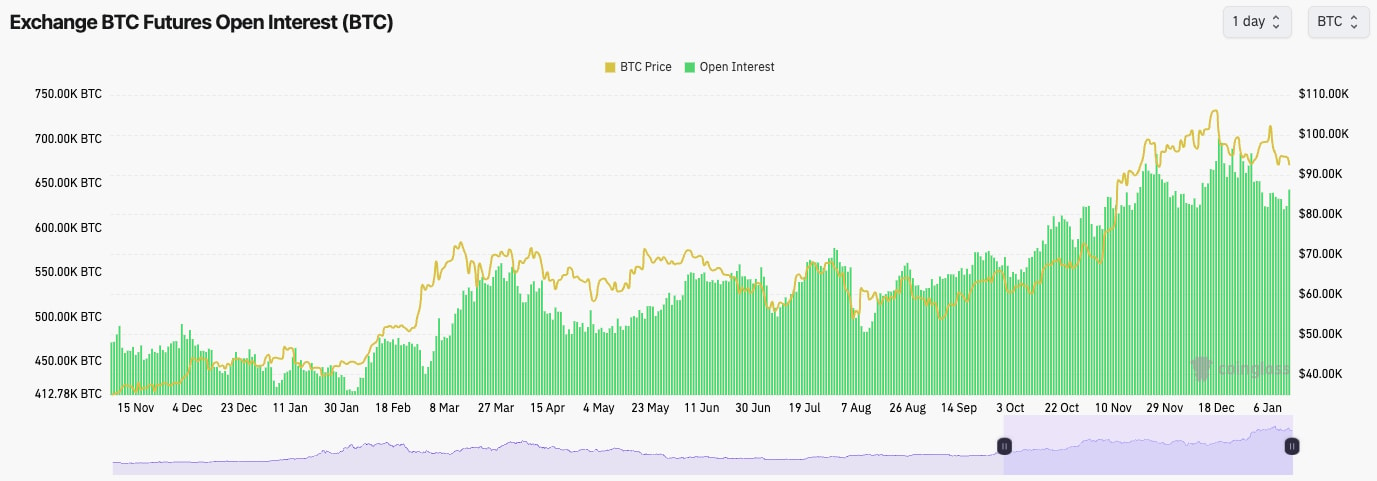
- BTC's Open Interest is up 4% from the lows but still remains 10% off the highs. The recent 4% increase is likely more dominated by Shorts. However, it is not so dominant that the funding rate has gone negative.
- Positioning is still relatively even overall here.
Technical analysis
- Bitcoin is currently playing between the key range of $91,500 (support) and $95,700 (resistance).
- Beyond $95,700, the main horizontal resistance is $98,900.
- There is a zone of support below $91,500, with that extending down towards $90,000.
- If $90k is lost, it's possible that the price dips into the low $ 80k in the short term.
- The RSI is at 41, so it's a middle-ish territory, but it probably still has room to go down further, particularly as it is below its moving average and remains in a downtrend.

- Next Support: $91,500
- Next Resistance: $95,700
- Direction: Bearish
- Upside Target: $95,700
- Downside Target: $87,000
Cryptonary's take
So far today, the price has held the lows (in the $ 90k range) and actually responded positively. However, we'll need a strong amount of bidding to push BTC into the resistance of $95,700 and then beyond that. Whilst BTC remains between $91,500 and $95,700, we remain with the view that it's more likely we'll see a breakdown and for BTC to head into the $80k's in the short-term.A breakout above $95,700 would invalidate this. Today, we have the S&P and Nasdaq gaping down, so we might see a bid there as they close the gap, which could give BTC a bid. However, we expect them to reject after the gap has been filled, and that would also likely result in BTC going lower with them. We expect BTC to head into the low $ 80k in the short term (next 1- 2 weeks). No, we don't believe the inauguration is a buy-the-news event.
ETH:
- ETH Open Interest is frightening. It just keeps soaring higher.
- ETH's Funding Rate is at 0.005%, which again shows a balance between Longs and Shorts.

Technical analysis
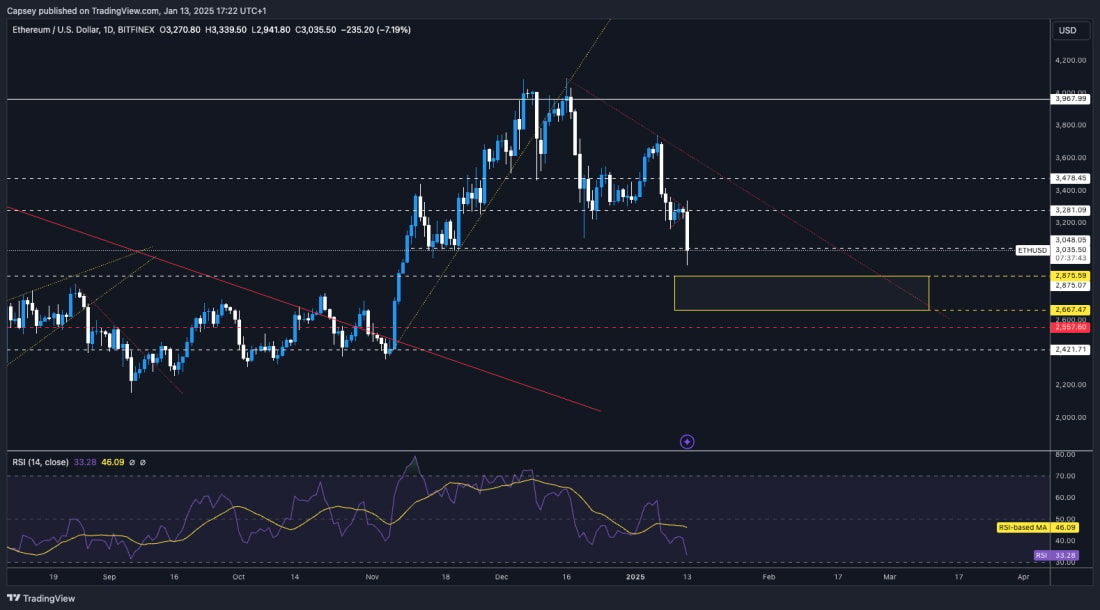
- ETH had a nasty rejection on Jan 7th, which was the jobs data, and it lost the key horizontal level of $3,280 just days later, breaking down from the bearish pennant.
- On the upside, the key level for ETH to reclaim is $3,480, although the price is 15% away from there currently.
- ETH has now moved down into the local horizontal level of $3,050, where we have initially seen some bids come in, and the price is holding up for now. Beneath $3,050, the next horizontal level is at $2,875, with the Yellow Buy Box going down to $2,660.
- The RSI has moved down drastically and now just sits above oversold territory, although there aren't any bullish divergences yet.
- Next Support: $3,050
- Next Resistance: $3,280
- Direction: Bearish
- Upside Target: $3,280
- Downside Target: $2,660 - $2,875
Cryptonary's take
ETH has pulled back substantially, but it is close to approaching the Yellow Buy box, whilst the RSI is also close to being overbought. What we'd like to see is a price to pull back to the Yellow Buy box and remain range-bound for a period. In this period, we'd like to see 1 or 2 bullish divergences (lower low in price, higher low on the oscillator) build-up. That would be the indication for us to potentially Buy/Long.We wouldn't be surprised to see ETH either range here in a tight area for a few days or break lower. We're expecting an upside at some point, but not in the immediate term. We have the inflation data on Wednesday, and a hot print could be what sends ETH into the Yellow Buy box. Let's see.
SOL:
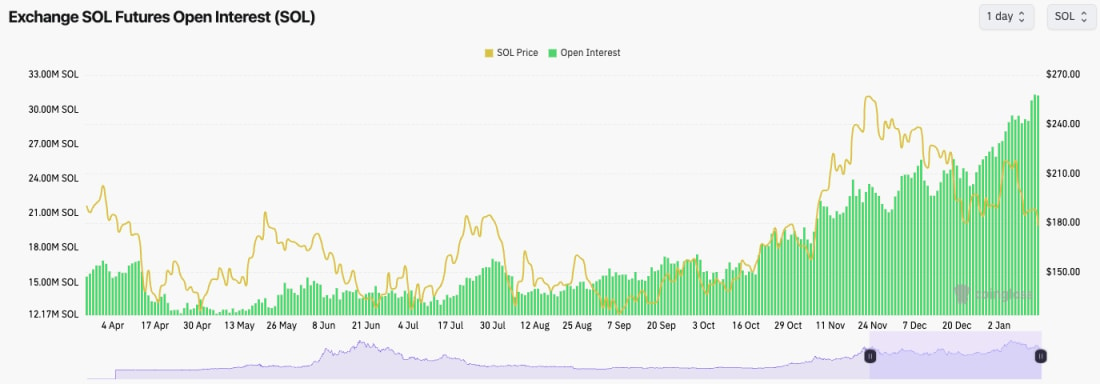
- SOL's Open Interest also continues to grind higher, indicating that there is a large build-up of leverage. SOL's funding rate is close to flat, at 0.00%, indicating there is an even balance between Longs and Shorts currently.
Technical analysis
- SOL broke out of its main downtrend line, but the price was rejected at the horizontal level of $222. Price then broke below the horizontal level of $203, formed a bearish pennant and broke down again.
- Today, the price broke down to $170, but we've seen bidders step in and push the price back close to $180 currently. $178 is new local support for the price, with the major horizontal support beneath the current price at $162.
- The Yellow Buy Box is currently between $120 and $145. We will be majorly interested if SOL visits that area, although we're not expecting this in the immediate term.
- The RSI is at 37, which is just above overbought territory, although there is room to still go lower. A retest of 30 on the RSI would likely put in a bullish divergence (lower low in price, higher low on the oscillator). We'd potentially be buyers of this.
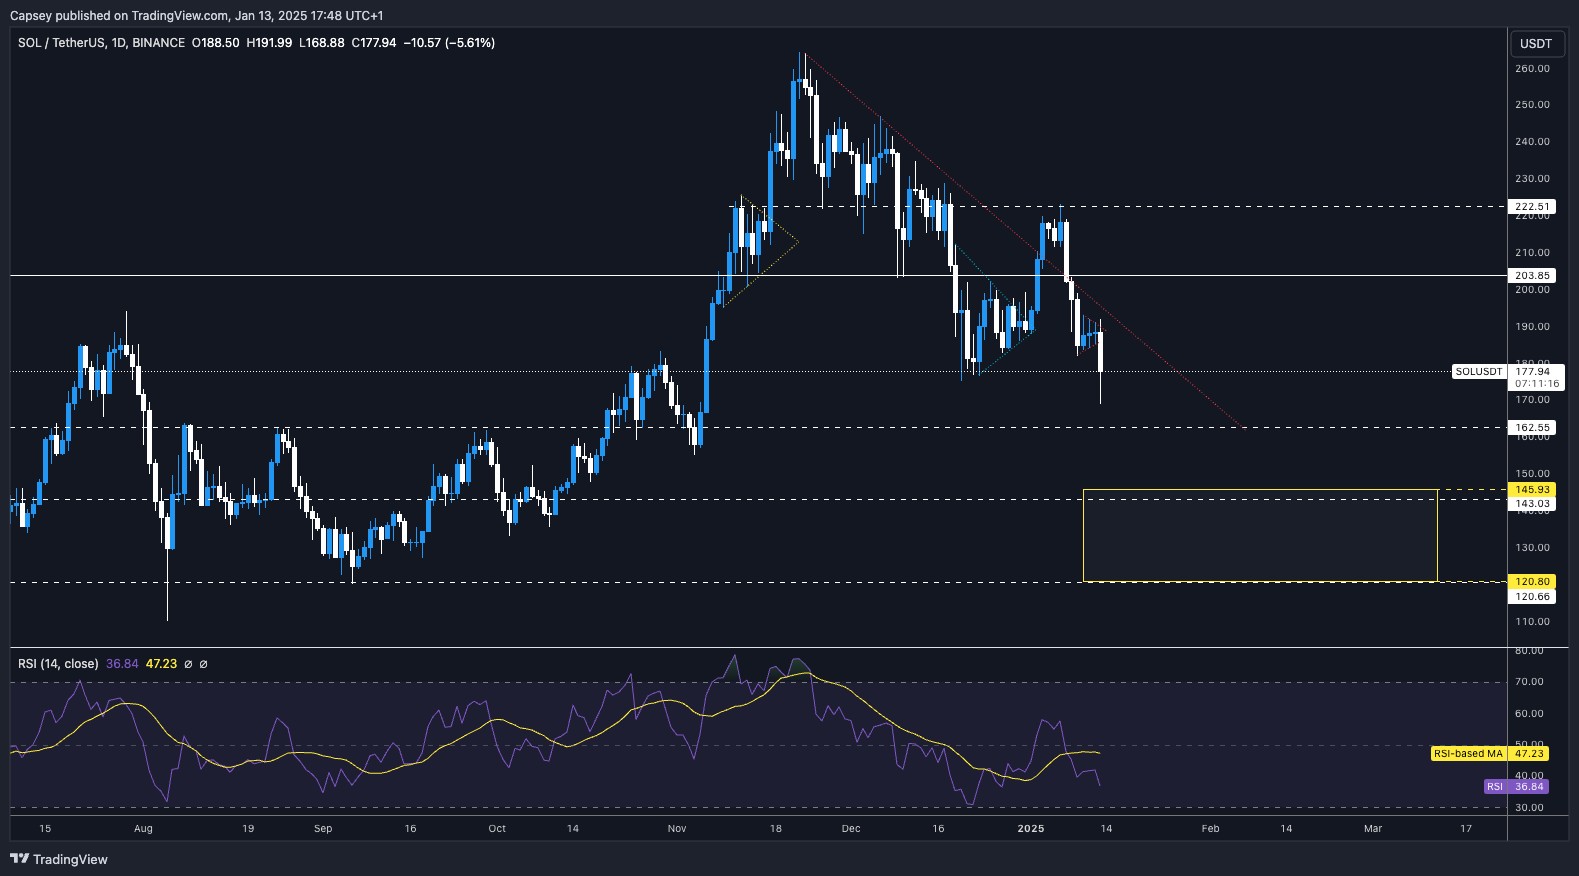
- Next Support: $162
- Next Resistance: $184 - $190
- Direction: Neutral
- Upside Target: $203
- Downside Target: $145 - $162
Cryptonary's take
SOL has pulled back substantially. If the price moves below $162, we'll become interested in potentially adding to our bags. However, we'd prefer the Yellow Box for larger buys. In the immediate term, it's possible we get a move up to $184 before a further move. SOL is the more tricky one out of the majors here to call correctly. We're unsure of direction in the immediate term, but we do think prices can go lower in the coming month.WIF:
- Meme, in general, is at the furthest end of the risk curve, and as we've seen Dollar and Yields up, that furthest end of the risk curve has sold off the most.
- Price has unfortunately lost some key levels, and when the price broke out of the range between $1.80 and $2.00, it couldn't be reclaimed above $2.20, which made us wary since the price has essentially been down only.
- Price has now seemingly also lost the $1.60 area, with $1.40 as the final support before a more meaningful breakdown is possible.
- However, the RSI is very oversold in most timeframes, while the RSI is in a downtrend. If and when we get a breakout (probably in weeks), we could see some more substantial upside. But it's possible this will go lower first, even though it is very oversold here.
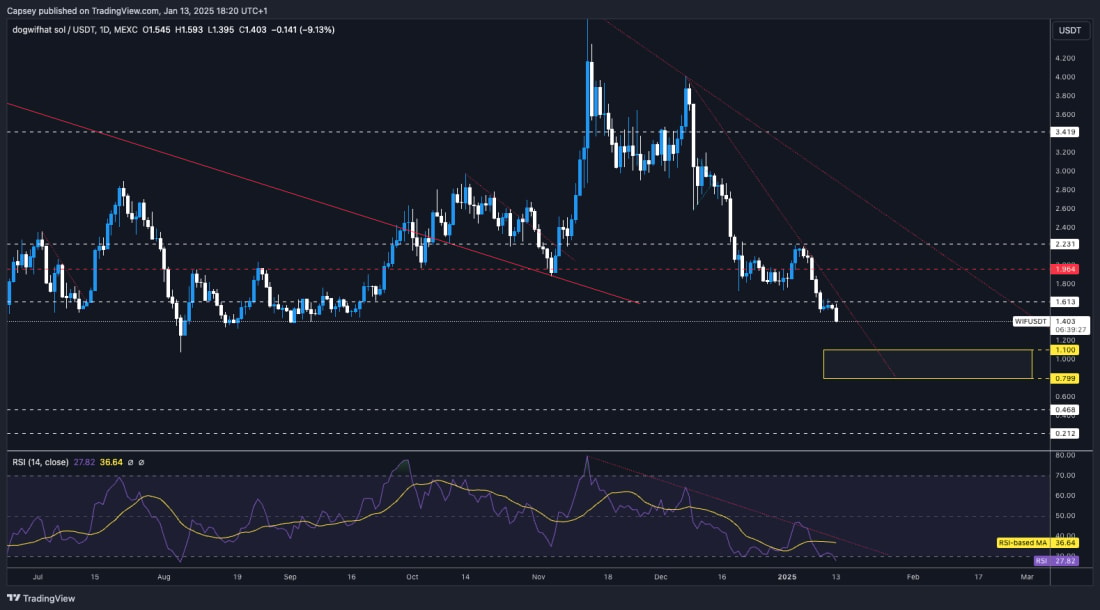
- Next Support: $1.40
- Next Resistance: $1.96
- Direction: Neutral/Bearish
- Upside Target: $1.96
- Downside Target: $1.10
Cryptonary's take
WIF has had a big comedown in recent weeks, but it is now very oversold. When a bounce does come, we might expect it to be rather substantial. However, we don't see a mega bounce in the immediate term. If WIF reaches the Yellow Buy Box, we'd be buyers of WIF there.It's also possible this box may be too low, which is something to consider. In the short term, WIF feels very oversold, but we do want to see the price build a range first and see where it settles.
POPCAT:
- POPCAT has been in a major downtrend for some time now, and like WIR, it has lost some key levels, with the rejection into the horizontal resistance at $0.92 being a key to the continued downside.
- POPCAT is now finding some support at the horizontal level of $0.54, with $0.40 the next major horizontal level below.
- To the upside, $0.71 is now a new local resistance, with $0.92 still being the major horizontal level for the price to flip.
- The RSI is sat on top of oversold territory, but it has put in its second bullish divergence (lower low in price, but higher low on the oscillator).
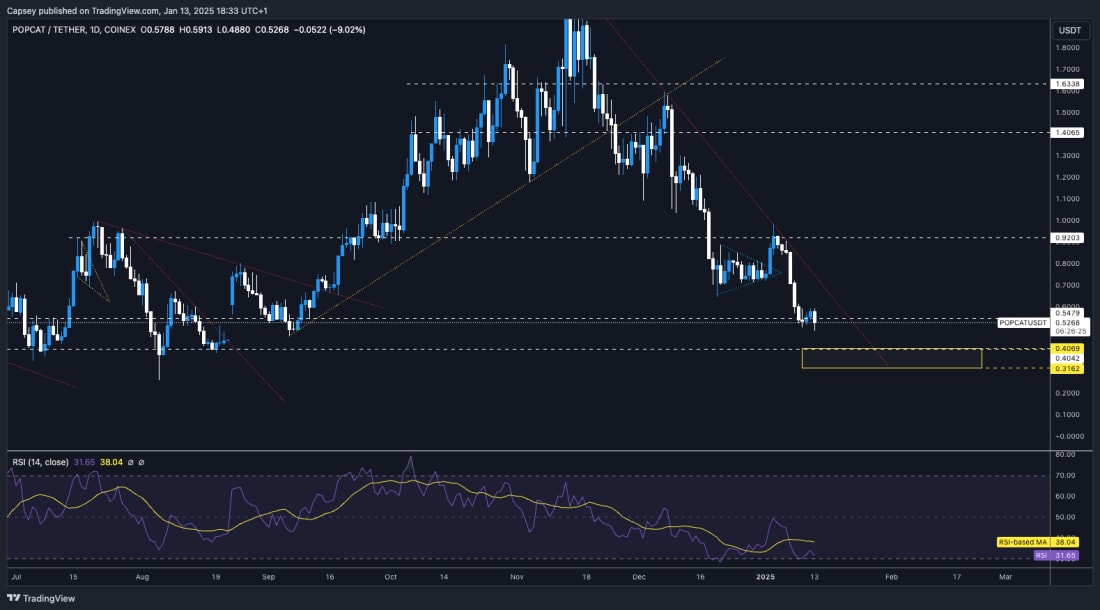
- Next Support: $0.54
- Next Resistance: $0.71
- Direction: Neutral
- Upside Target: $0.70
- Downside Target: $0.40
Cryptonary's take
Like other memes, POPCAT has sold off substantially, down 75% from its all-time highs. But, the price is now squeezing into its downtrend line, and the price is very oversold, having now also put in two bullish divergences. Whilst it's possible that the price goes lower (possibly the Yellow Buy box), it's also possible that the coins at the furthest end of the risk curve (memes) have sold off first and that possibly the majority of their drawdown is done.However, we're not expecting a substantial upside in the short-term, and it's, therefore, possible we see price build a range at the lows whilst the majors (BTC, ETH and SOL) continue to go lower. Let's see.
SPX:
- The last week's price action hasn't been ideal, although we did expect a pullback from the $ 1.60s which we called for in our last Market Direction.
- Price has now pulled back to the prior all-time highs. This could potentially become a new level of support, considering this was an old resistance level. Beneath prior highs (where we are currently at $0.93, say), there is a lot of support, with a big cluster between
- $0.72 and $0.75, although we wouldn't be surprised to see the price have a small bounce from $0.90.
- The buying area we have identified is sub $0.72 if we get it. This is between $0.59 and $0.72.
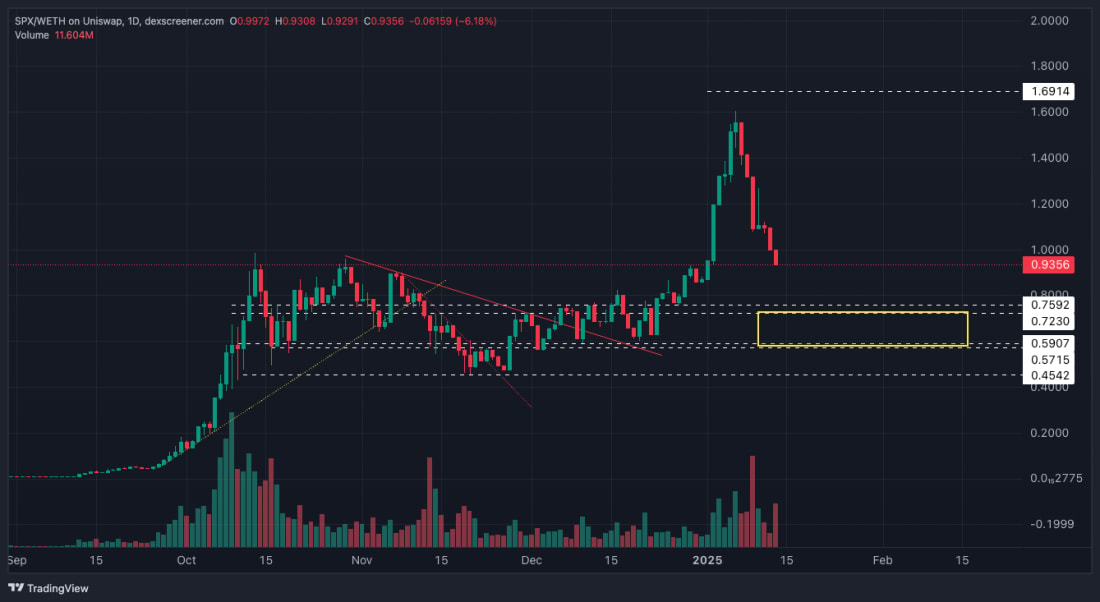
- Next Support: $0.90
- Next Resistance: $1.10
- Direction: Neutral
- Upside Target: $1.10
- Downside Target: $0.75
Cryptonary's take
Yes, this is down a fair amount in the last week, but if you were heavily positioned in SPX, you've avoided a lot of the pain in the market that we've seen over the last 6-8 weeks, so I certainly wouldn't see this as a bad thing. Ultimately, $0.93 is still mega, and it's a price that's mostly above all of 2024's pricing.In the short term, it's possible we will see a bounce in SPX from $0.90, maybe retesting to $1.10. But if $0.90 breaks, the main support zone will be $0.72 to $0.75.
Recommended from Cryptonary


