Save 23% ($351) & Get a Free 1-1 Call with our Team ⏰ : 0d 2h 59m 44s

Bitcoin is knocking on $53k's door, determined to break through, but will BTC smash through resistance or face plant off its latest high? That’s what everyone is trying to figure out.
Meanwhile, alt majors Ethereum (ETH) and Solana (SOL) are playing it cool, but warning bells are ringing about overheated leverage. As for the dogwifhat (WIF); we might be getting another opportunity to load up on this favorite at a discount.
So how high will Bitcoin bounce before bears maul leveraged longs?
Let's dive in.
You can jump to the analysis of assets you are most interested in by clicking the directional links below.
Disclaimer: Not financial or investment advice. You are responsible for any capital-related decisions you make, and only you are accountable for the results. “One Glance” by Cryptonary sometimes uses the RR trading tool to help you quickly understand our analysis. They are not signals, and they are not financial advice.
BTC update
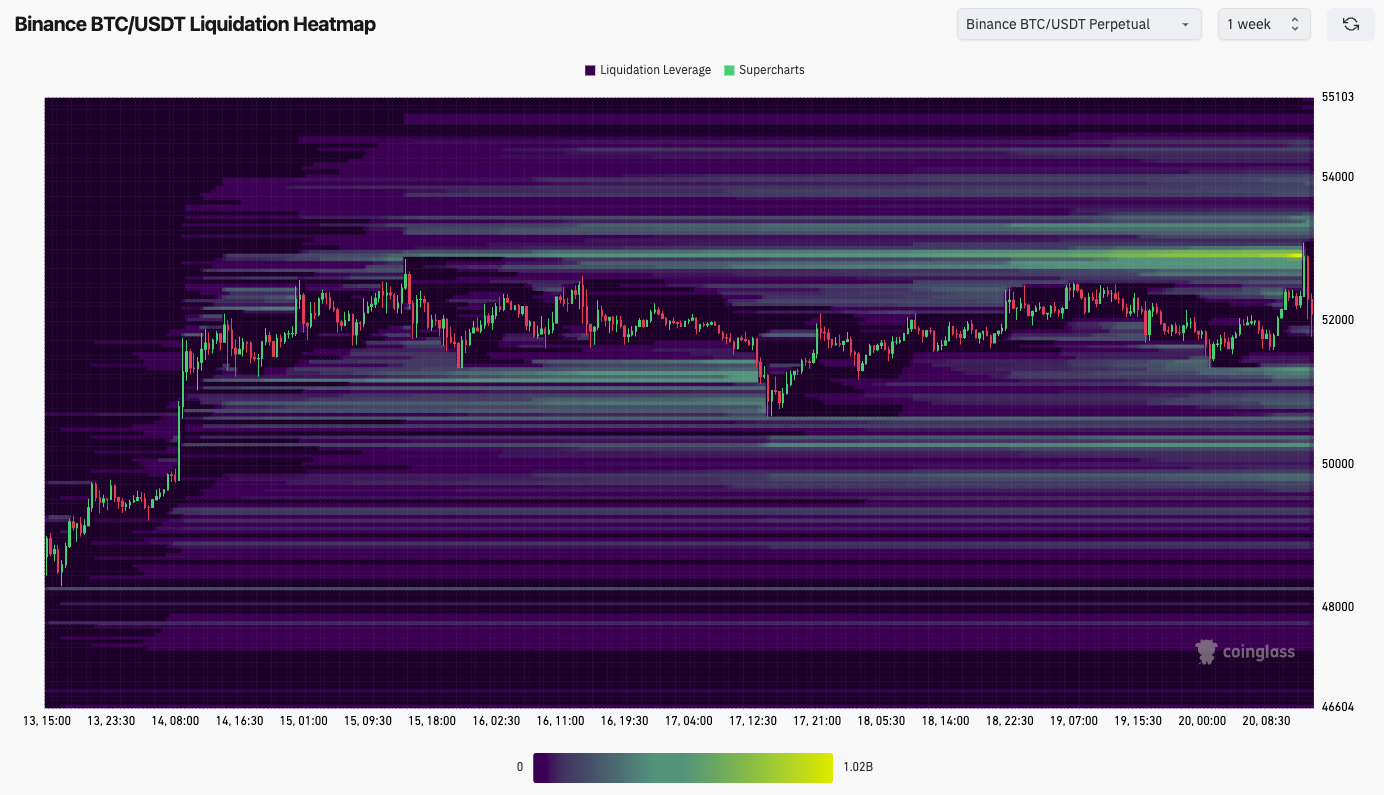
Bitcoin has pushed into that $53k level, but what does it stand here?Firstly, liquidity has been hunted and taken at $53k, which we can see from the liquidation heatmap attached below. Exchanges and market makers hunt these liquidity areas (traders's Stop Losses) as they earn maximum fees from these liquidations.
Once hunted, price can then turn around in the other direction. The brighter the colour (yellow), the larger the amount of USD liquidations there was in that area.
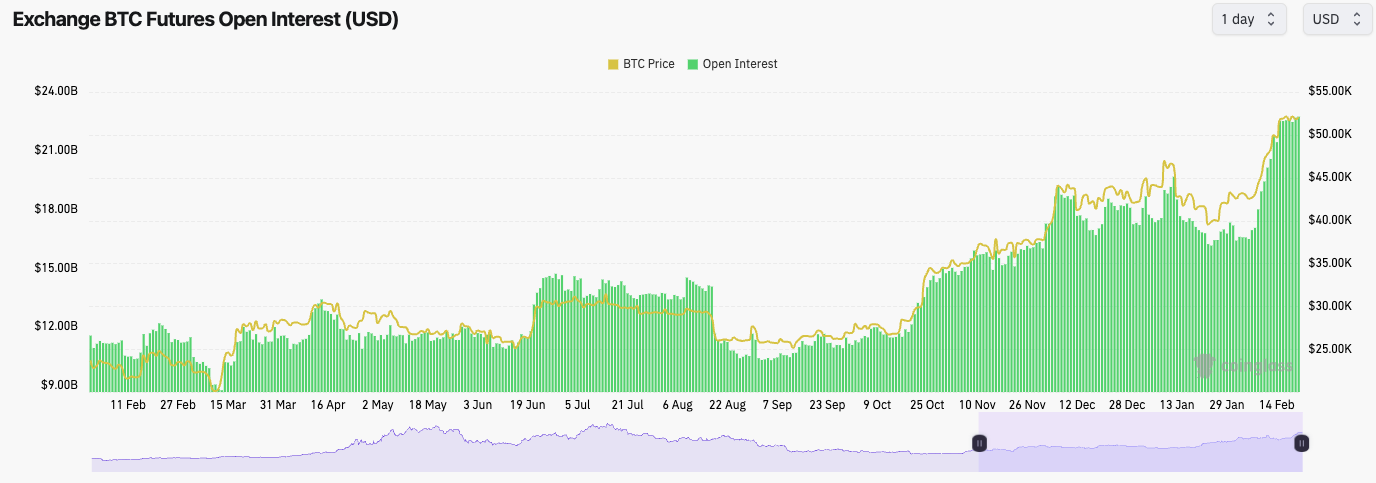
The Open Interest on Bitcoin is very high. Going into new bull markets, you can expect a general increase as more participants enter the space. But, currently, the Open Interest (the amount of leverage in the system) is quite high.
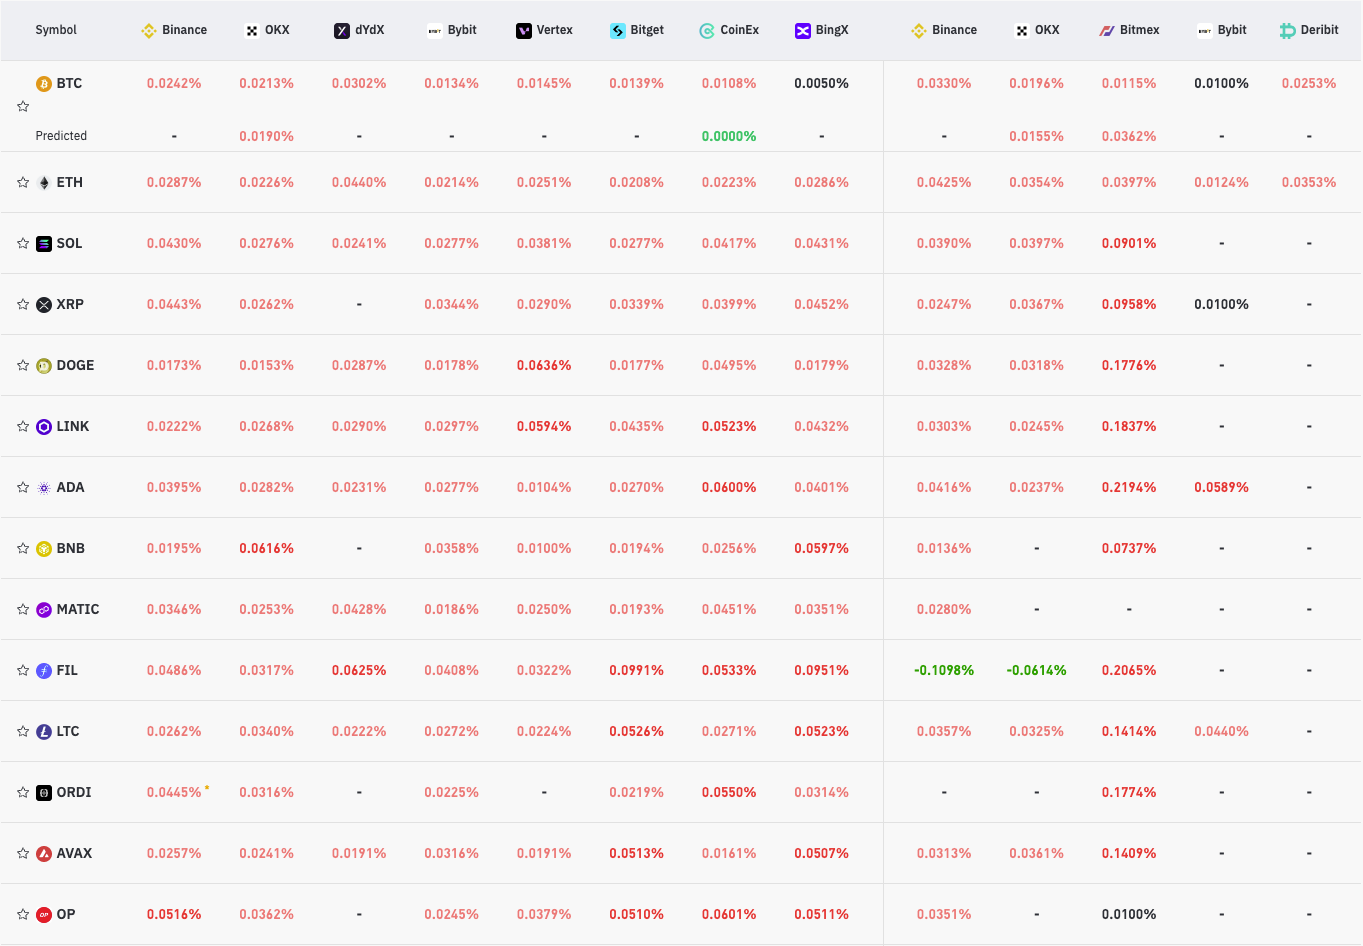
The Funding Rates have also gone meaningfully positive, meaning that the leverage build-up is due to Longs piling in. They are now becoming vulnerable to a more material flush out.
Technical analysis
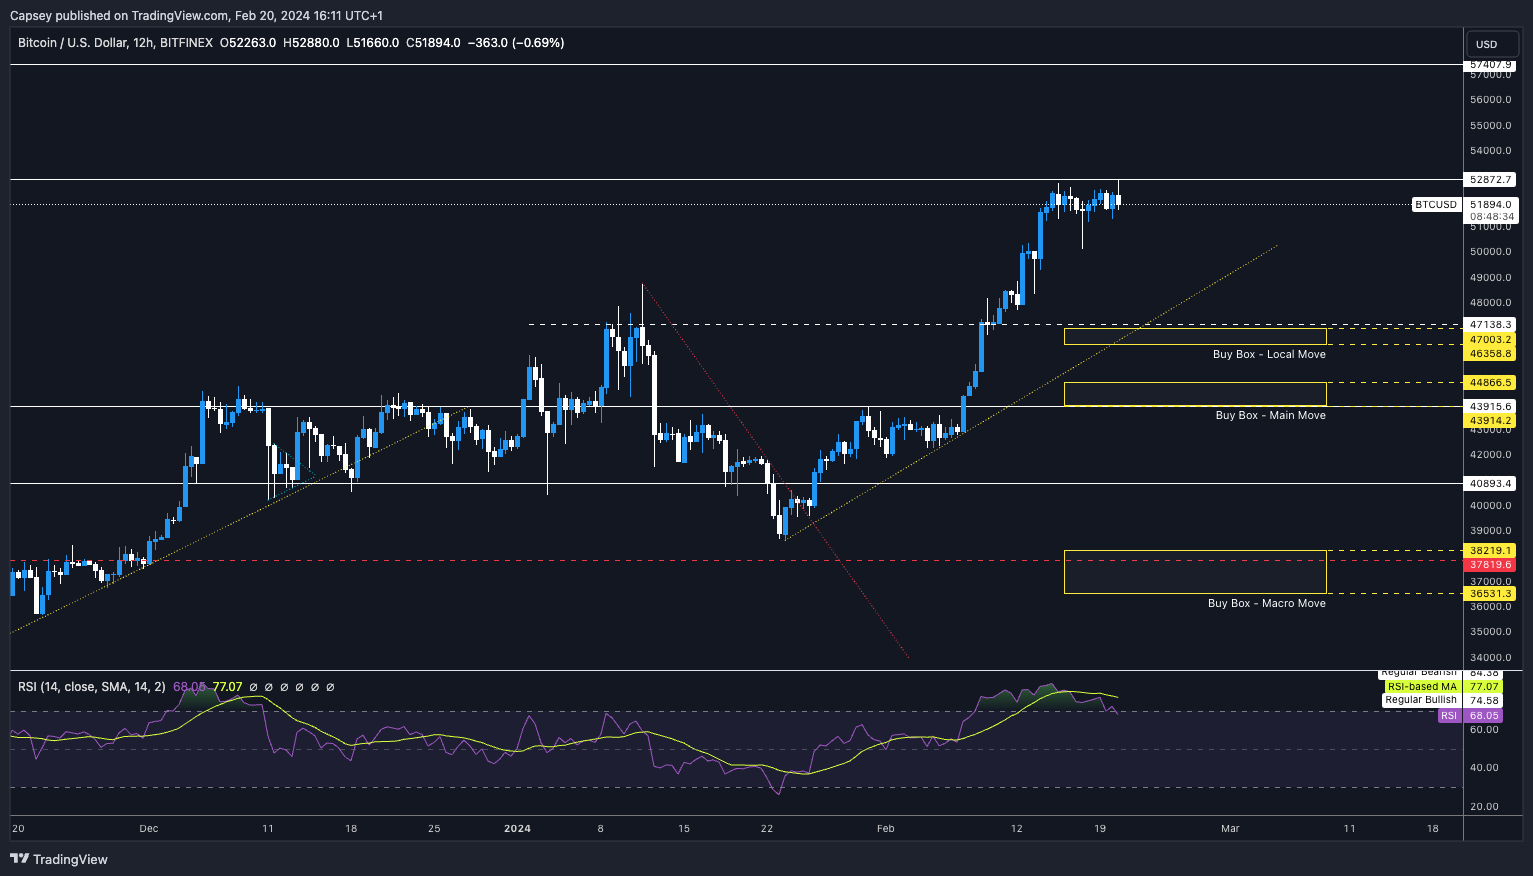
- Bitcoin has now found the $53k level as a horizontal resistance that, for now, price has struggled to overcome.
- If price can break above $53k, then $57k may be achieved. However, it would be too early in the cycle for Bitcoin to get so close to prior all-time highs. It's just something to take note of.
- If Bitcoin does reject from $53k, the next major support is at $47,100, although there is a local support at $49k.
- The RSI is overbought on all major timeframes and has been for some time, so you can expect that there may be a pullback for price or at least a consolidation to reset the RSI slightly.
Cryptonary's take
If price does pull back, we will look to add to our Bitcoin Spot bags at the yellow boxes.We are sceptical of the box between $36,500 and $38,200 filling. However, we do see it is possible that price could pull back to the upper yellow box at $46,300 and $47,000 and even the middle yellow box between $43,900 and $44,800. We would be buyers of Bitcoin in these yellow boxes.
If Bitcoin were to fall below the middle yellow box, we would be strong DCA buyers all the way down to $36k, if that were to happen, although we see it as unlikely.
We're not looking to sell any Spot bags, but we would avoid leverage Longs here, as BTC is at a major resistance at $53k, and the mechanics setup isn't favourable.
ETH update
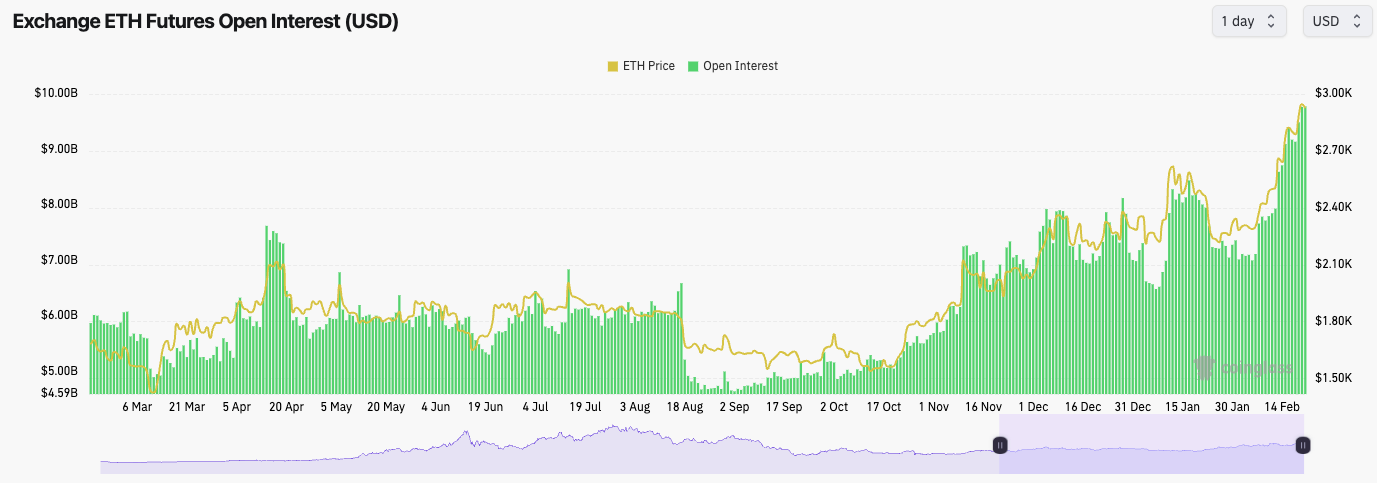
- ETH's Open Interest is also very high, indicating that there is a lot of leverage in the system here.
- ETH's Funding Rate is also at 0.02%. This isn't crazily high, but it is high, indicating a clear bias amongst traders to be Long rather than Short. Longs will be vulnerable to a flush out if this funding rate continues rising.
Technical analysis
- ETH has had a great run the last two weeks, up 29%, and finally catching up considering some of its lack in performance in prior months.
- Just now, ETH has rejected initially at the psychological level of $3,000, and it'll need to recover in the coming hours (of Tuesday, the 20th) or risk closing with an ugly-looking candle that could be the start of a pullback for price.
- If ETH were to break $3,000, then $3,140 would be the likely target in the short term.
- To the downside, the support is around $2,640
- The RSI is very overbought on a number of major timeframes, and therefore, this could be a headwind for the price just continuing to climb.

Cryptonary's take
Considering ETH has performed so well over the past few weeks, rallying from the $2,200's to close to $3,000, a healthy pullback is possible.If we see a pullback, the $2,640 level will be important for price to hold. If it doesn't hold, then we'd expect the upper yellow box to be reached between $2,490 and $2,540.
We would be buyers of ETH at this price with a long-term time horizon. If ETH fell below this level, we would be continued DCA buyers with the low $2,000s as aggressive buying levels, although we're not confident in price moving as low as this level.
We continue to hold Spot bags for now, but we're not looking to take out any leveraged Longs.
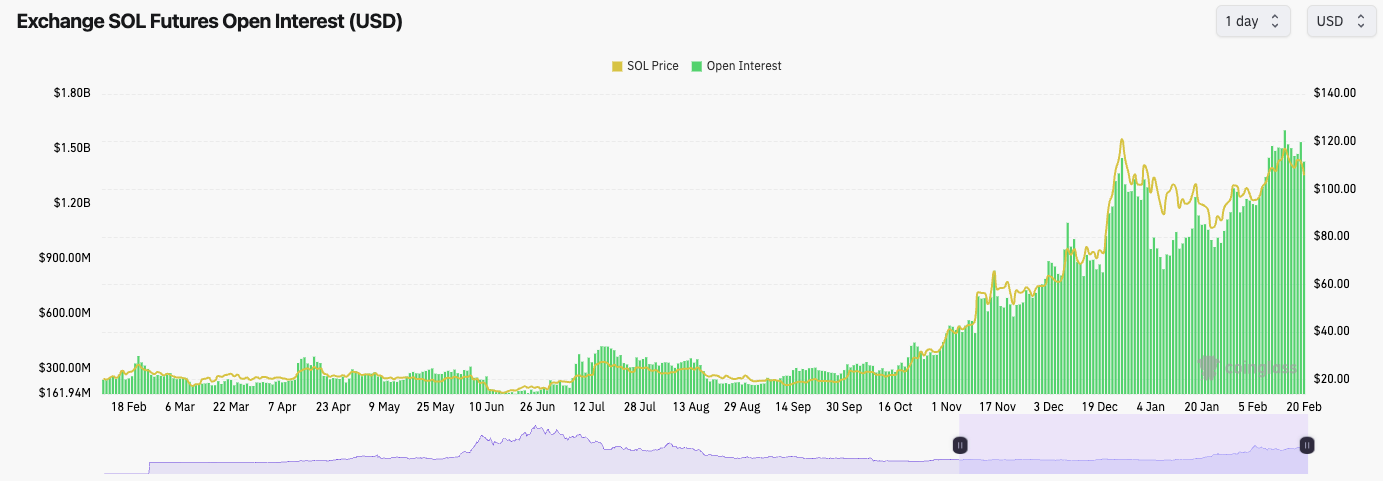
SOL update
The mechanics for SOL are close to overheated.If we begin with Open Interest, we can see that it has soared well above the levels we saw in December during SOL's crazy price run-up. This indicates that there is a lot of leverage in the system.
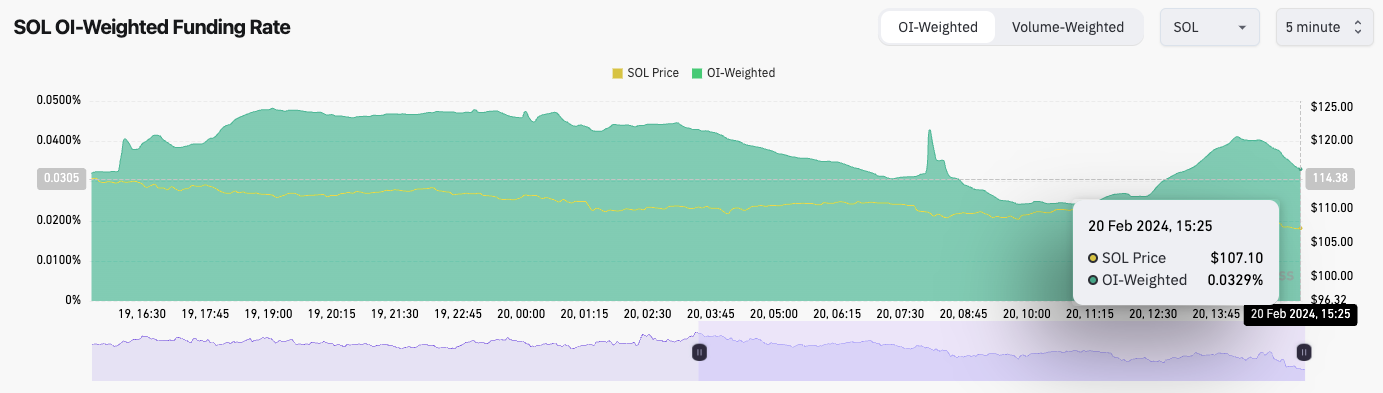
The Funding Rate for SOL is just shy of 0.04%, which is high. This shows there is a bias among traders to be Long. Close to 0.04% is high, meaning Longs may be vulnerable to a flush out, particularly if price falls and takes out certain levels like $100.
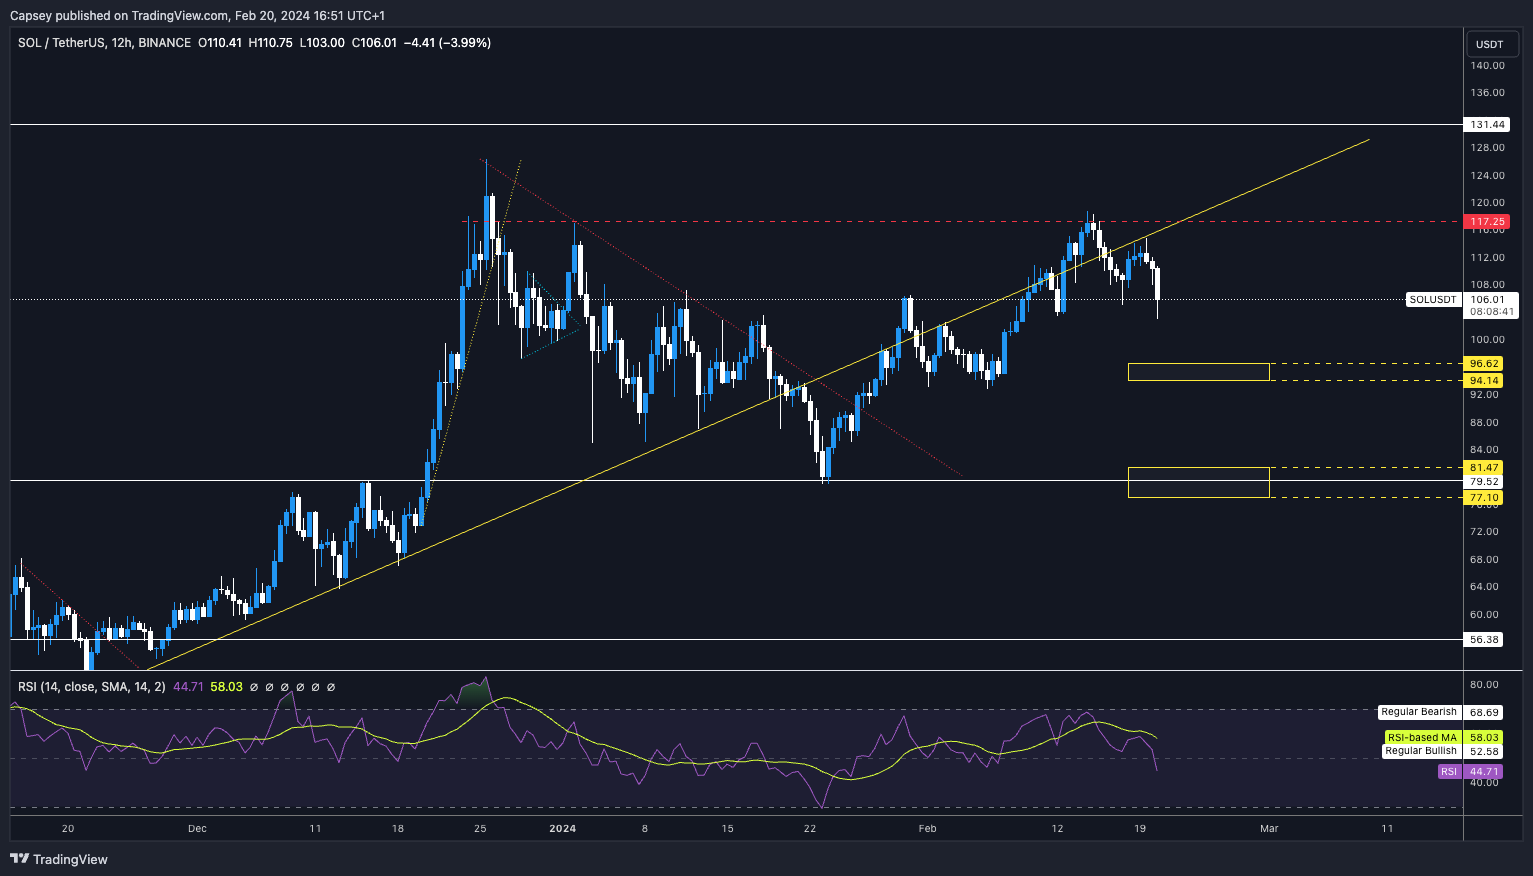
Technical analysis
- SOL is one of the plays that is not overbought on its RSI, having seen more subdued price action recently.
- However, SOL is battling to reclaim above its main uptrend line (yellow line) and to get above the horizontal resistance at $117.
- To the downside, there is local support at $102, but the yellow box for the move is from $94 to $96.60. This would be a buying zone for us.
- The main support now overlaps with the main yellow box at $79, between $77 and $81.50. This would be considered a good area to buy more Spot SOL if this price point is reached with a long-term view to hold it.
Cryptonary's take
It wouldn't be a surprise to see SOL pullback further, particularly if BTC and ETH pullback, and then SOL establishes itself in this higher price range between, say, $90 and $120.Considering the size of the move-up in December, spending some time consolidating and forming key levels between $90 and $120 sets us up better for the long term, riding into what we believe will be a big bull market in 2024 and probably the first half of 2025.
SOL sub $100 is a buy, and light DCA buy orders should be used.
If SOL dips below $90, we’ll become more aggressive with our DCA orders. The bottom yellow box between $77 and $81 would be a gift of a long-term buying zone if price can get that low, although we're sceptical.
WIF update
- Now, we are out of and beneath the main uptrend line, which is usually not bullish for price action in the short term.
- Local support is $0.33, with stronger support at $0.30.
- $0.45 to $0.48 will now be new, and strong resistance for price to break above of.
- Between $0.18 and $0.22 is likely the bottom support and should be bought up if price visits that area.
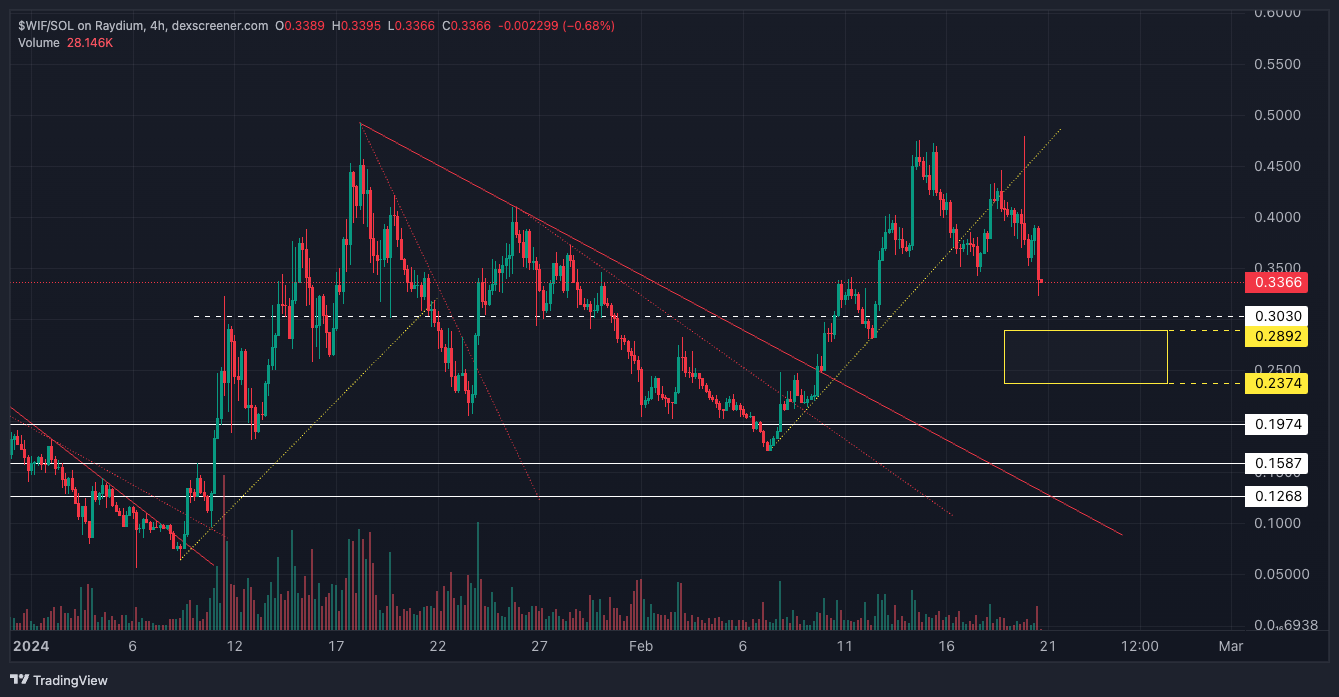
Note: 4hr chart given.
Cryptonary's take
Now that WIF is out of the main uptrend line, and with BTC and ETH potentially eyeing pullbacks for price in the short term, WIF may also pull back.If price moves into our yellow box between $0.23 and $0.28, we would be buyers for the long-term at these price levels.
Beneath $0.23, down to $0.18, we'd be aggressive DCA buyers.
