Save 23% ($351) & Get a Free 1-1 Call with our Team ⏰ : 0d 2h 59m 43s

We will dive into the key things we’re watching this week and how we're playing the recent developments in the market.
Today, we cover:
- Inflation data this week, along with Fed-speak
- Strength of move overall + BTC mechanics here
- The indexes for crypto
Disclaimer: Not financial or investment advice. You are responsible for any capital-related decisions you make, and only you are accountable for the results. "One Glance" by Cryptonary sometimes uses the RR trading tool to help you quickly understand our analysis. They are not signals, and they are not financial advice.
This week's data + Fed-speak
This week's key data is the inflation data out tomorrow (Tuesday 13th).The expectations are for the data to come in lower, with Inflation YoY coming in at 3.1% and Core coming in at 3.7%. If the data comes in at these levels, this would be bullish for markets.
However, if there is an upside surprise, the markets would take that negatively. We also have a lot of Fed speak this week from Fed members. We’ll be looking out for any comments surrounding the data and if they give further comments on a March/May/June rate hike.
Markets will likely move only if the Fed-speak is different (i.e. more hawkish) than what the market is currently pricing.
Strength of the overall move + the current BTC mechanics
If you’ve been reading our market updates for some time, you would have observed that we weren’t confident about Bitcoin getting back above the $45k level in the short term on this most recent rally.If we look at price, we were wrong. This is ok, particularly as we are currently positioned, although we'd rather be right in the wrong.
That being said, the market has shown much strength over the past week to take out the $45k level. It is now pushing up to the yearly highs, where price is now finding some resistance. However, it doesn't seem to be too significant of a resistance, but let's see.
BTC
Despite Bitcoin retesting its yearly highs in the low $48k region, other majors such as ETH and SOL haven't yet.They will likely retest their yearly highs if BTC consolidates for a while, but again, we are sceptical despite having been wrong on this for BTC.
When looking at BTC here, we can see that Open Interest has ramped up massively, so lots of leverage has piled in. Yet, Funding is flat at 0.01%, meaning positioning (between Longs and Shorts) is still even, and therefore, neither side is vulnerable to a flush-out.
However, if price begins to move in a specific direction, then the side on the other end of that may become vulnerable to a flush out.
Alongside this, in the orderbooks, there is a lot of "asks" (sellers) between $48k and $50k, so we imagine that this is a resistance area in the short term.
But, any meaningful dips are likely for buying.
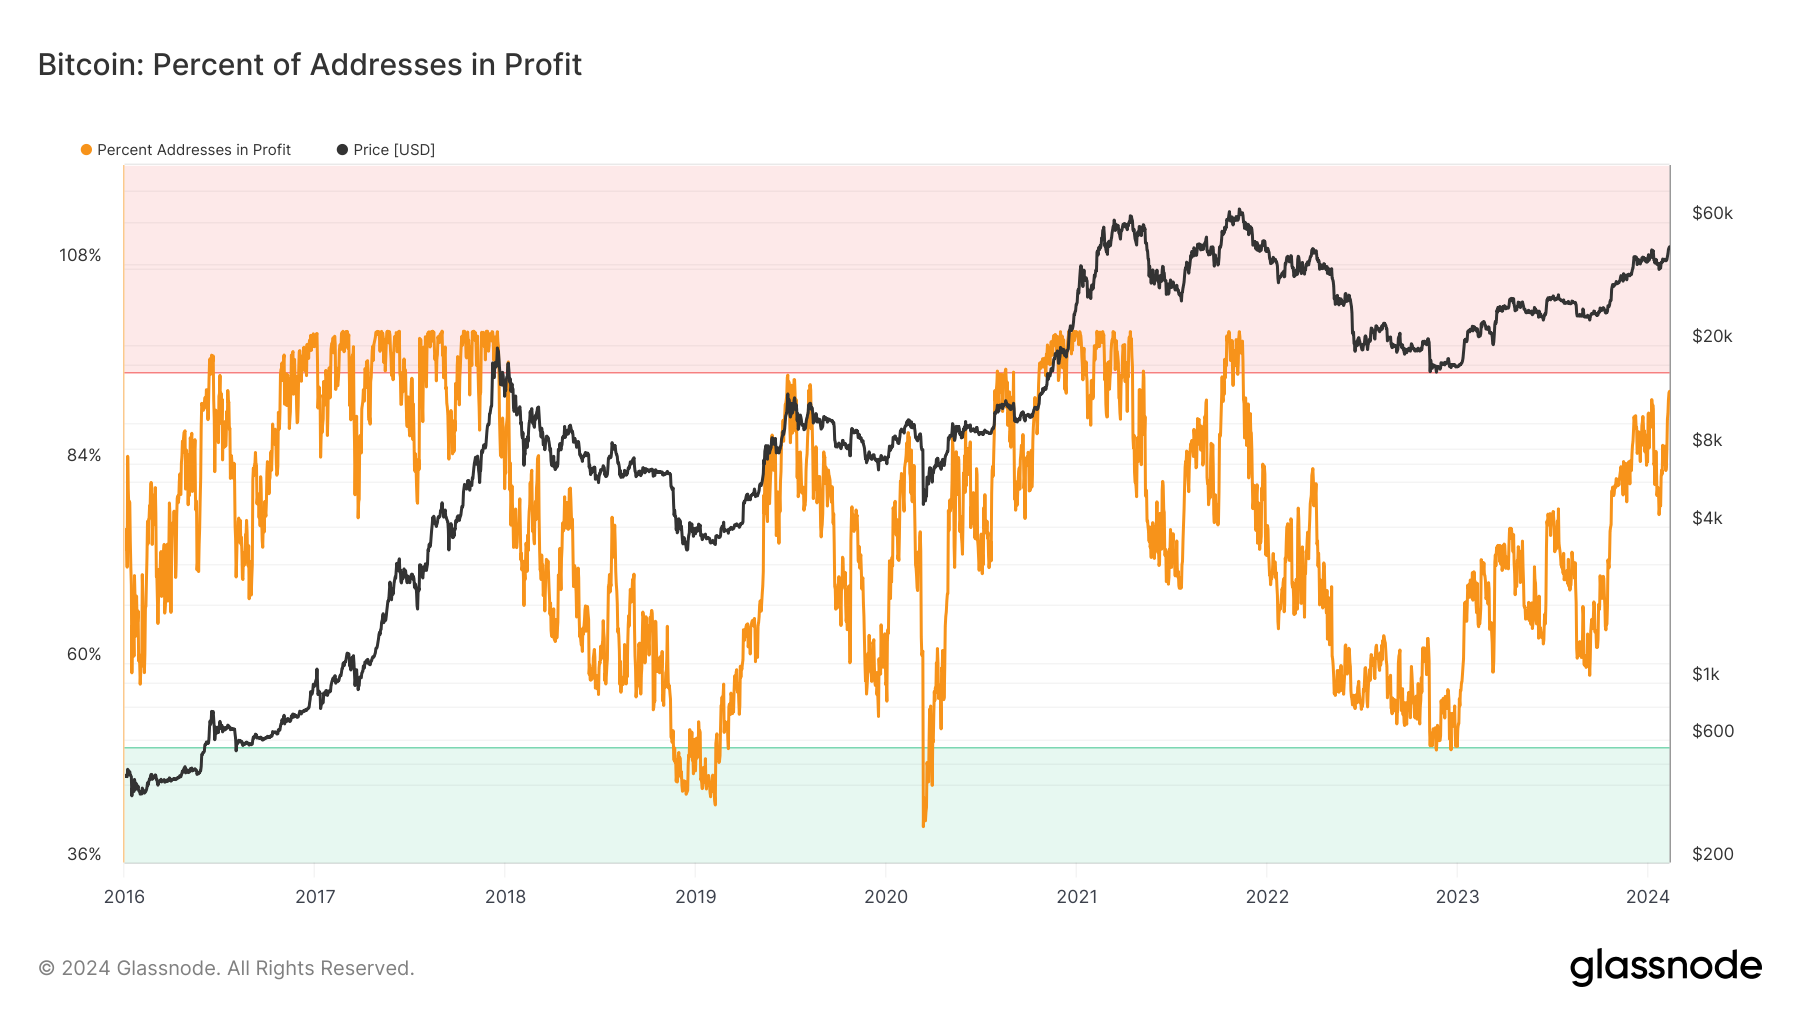
Lastly, for this section, if we look at some of the on-chain data metrics, we can see that 93% of market participants are in profit here. When this metric reaches this level, we usually see a pullback in price that follows it—just something to be wary of.
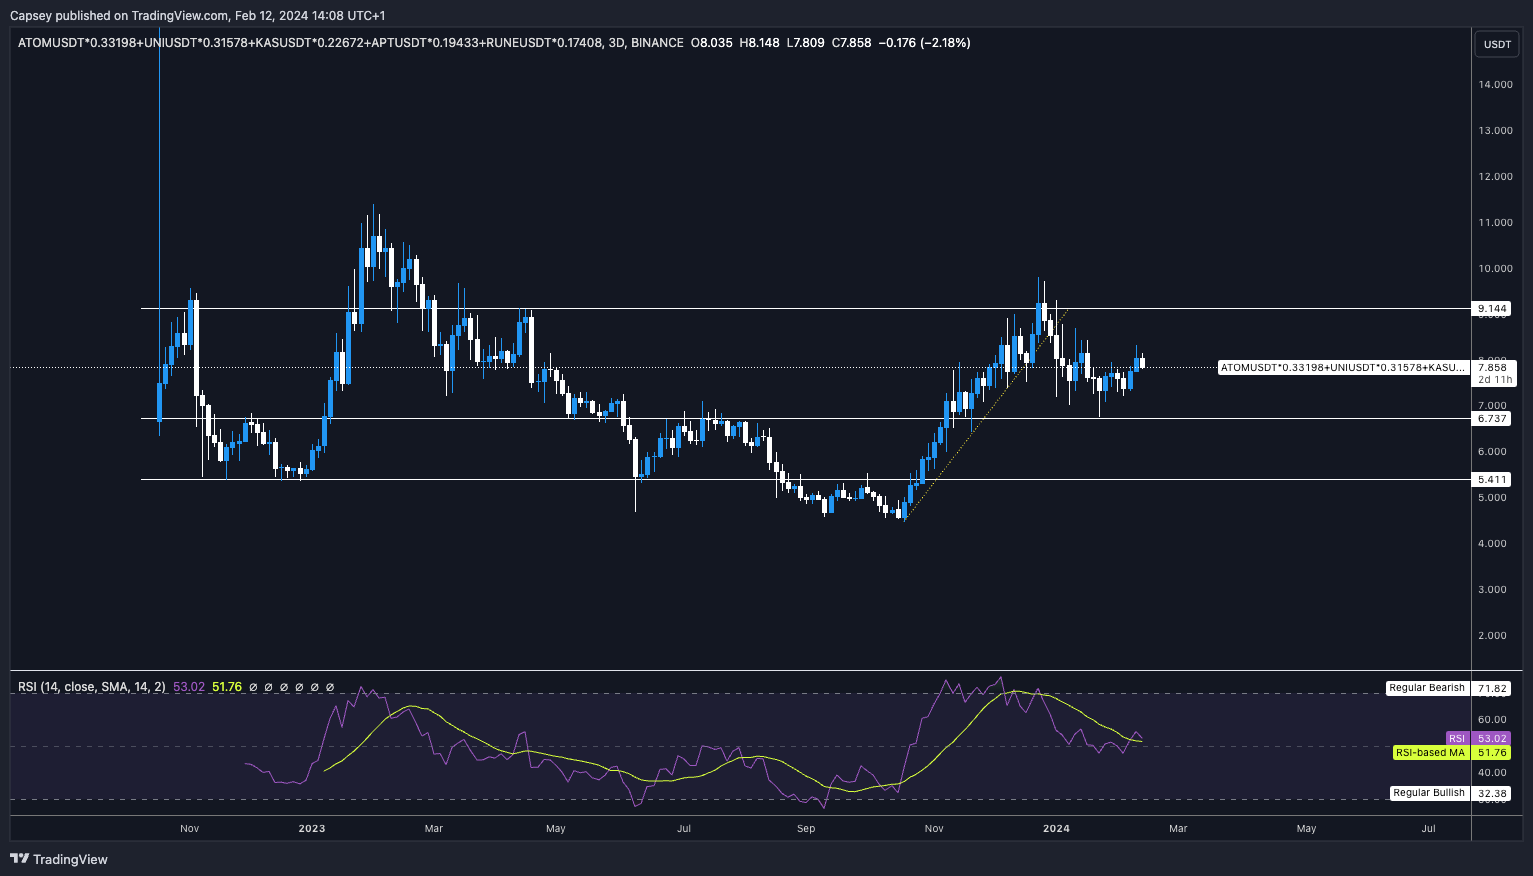
Crypto Indexes
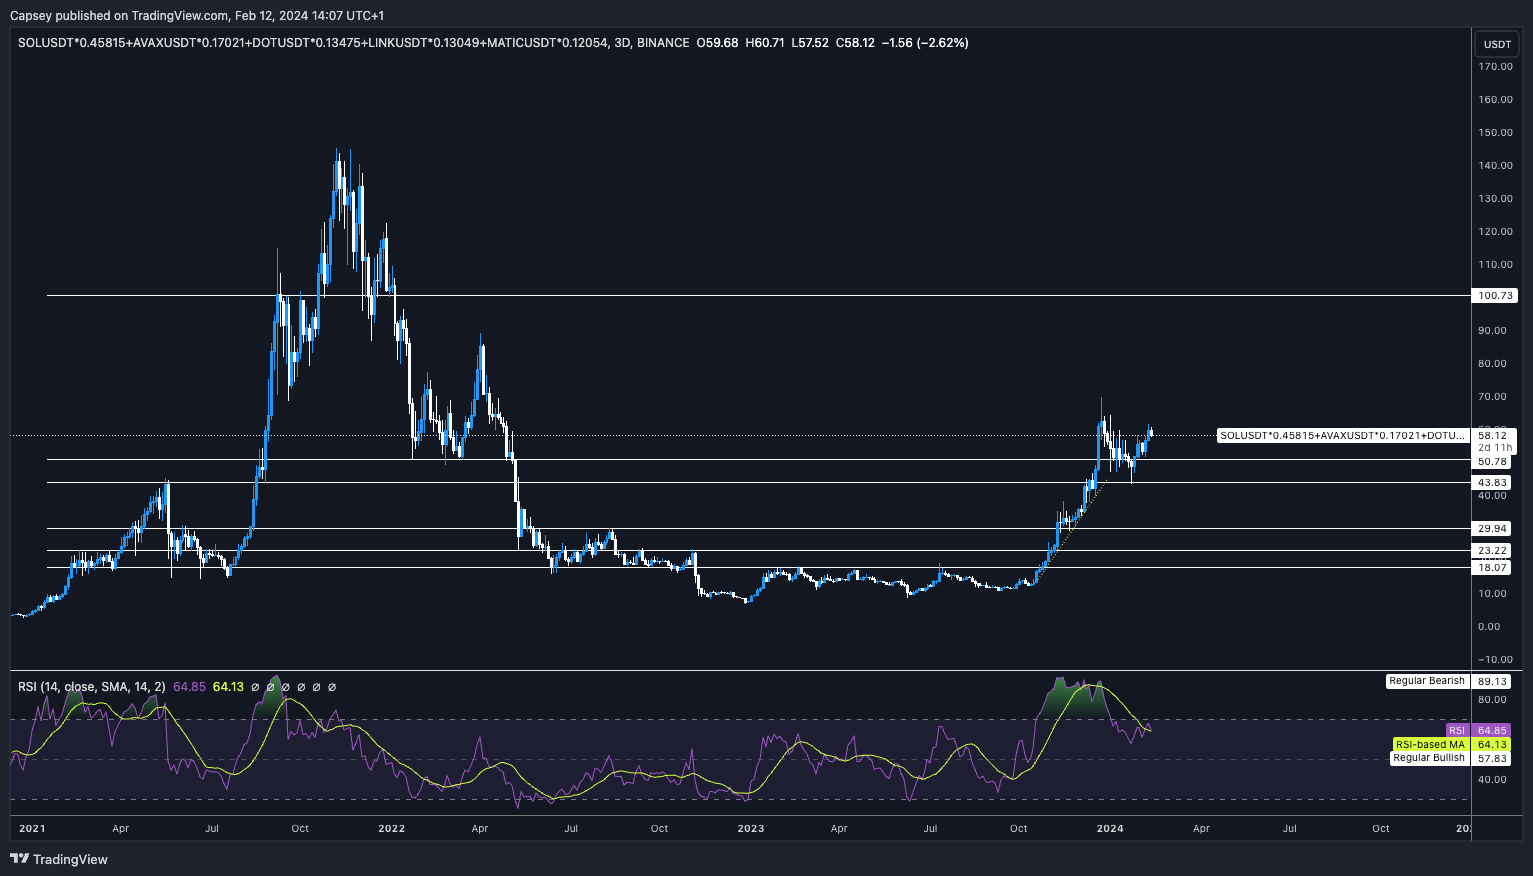
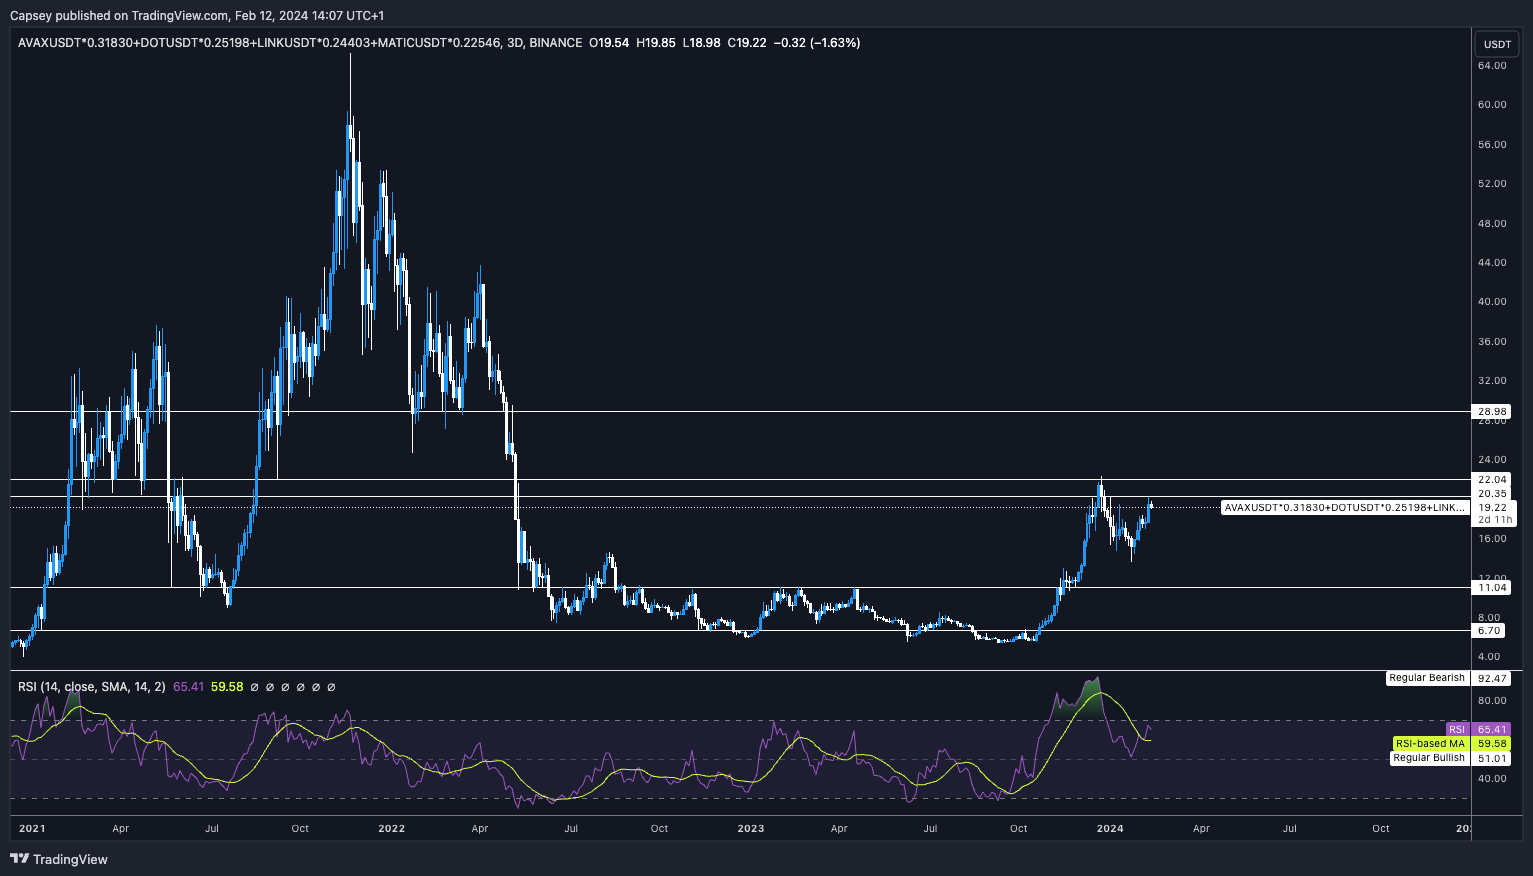
In our December Monthly Report, you may remember that we covered Crypto Indexes, with several of them at key resistances.In that report, we looked at the Major Caps Index (with and without SOL), the Mid Caps Index, and the Small Caps Index.
Major caps with SOL
Major caps without SOL
Mid caps
Small caps
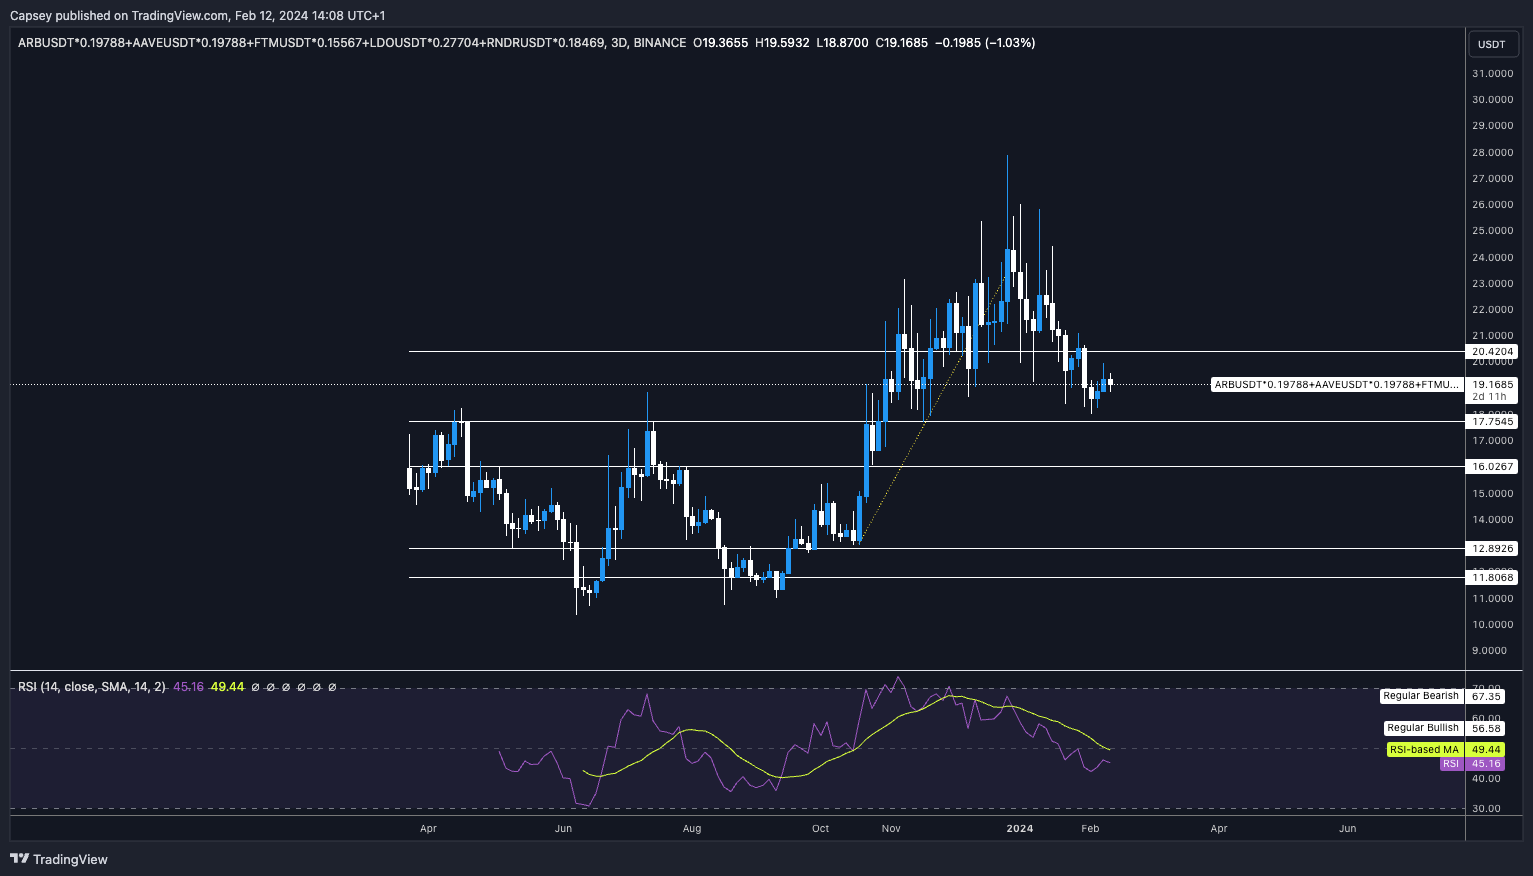
We can see that the Major and Mid Caps haven’t broken out of the main horizontal resistance, but the Major Caps with SOL included have.
This shows us that the real strength has come from SOL. What this tells me is that SOL should be bought on any decent pullbacks, but it also shows how early we likely are in this cycle and that there is likely a huge upside remaining over the next 12-15/18 months.
Cryptonary's take
The last few weeks have taught us that rather than trying to optimise (calling every top and bottom and selling and re-buying bags accordingly), we should sit back and appreciate that we're in a much broader bull market. Any major dips should be bought, particularly those that have shown major strength.The one that stands out here is SOL. It's possible that in the short or even medium term, we may have a slight pullback. The on-chain metrics suggest this whilst there is also a massive sell-side supply of Bitcoin on the order books between $48k and $50k.
Let's see, but in our opinion, major pullbacks are for buying.
