Save 23% ($351) & Get a Free 1-1 Call with our Team ⏰ : 0d 2h 59m 43s

However, we also have important labour market data out this afternoon, so we'll provide another lighter update this afternoon on its release and its potential implications for the market.
It's a big day ahead, and it's possible that the labour market data could help the market rebound.
Disclaimer: This is not financial or investment advice. You are responsible for any capital-related decisions you make, and only you are accountable for the results.
Overnight price action and Bitcoin crash
We've had a drop in prices across the board, with altcoins and memes being hit harder in terms of percent drawdowns.Now, despite the 15.8% drawdown in Bitcoin's price over the past four days feeling heavy, this price drawdown is historically very typical in Bitcoin bull runs.
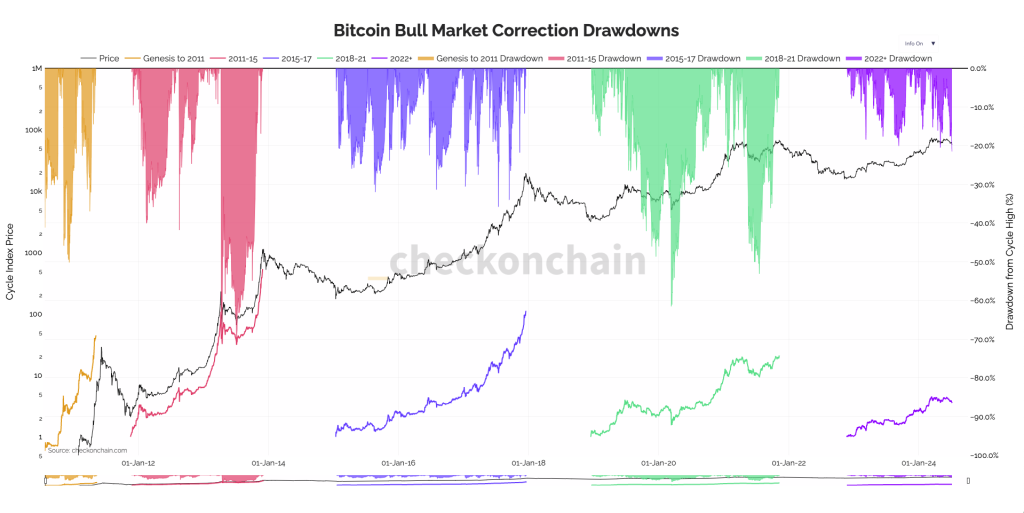
In prior bull runs, 20% to 30% drawdowns were common. This current price drawdown is 27.6% from an all-time high to the low of today at $53,300. The chart below shows Bitcoin's price drawdowns in prior bull runs.
Bitcoin bull market correction drawdowns
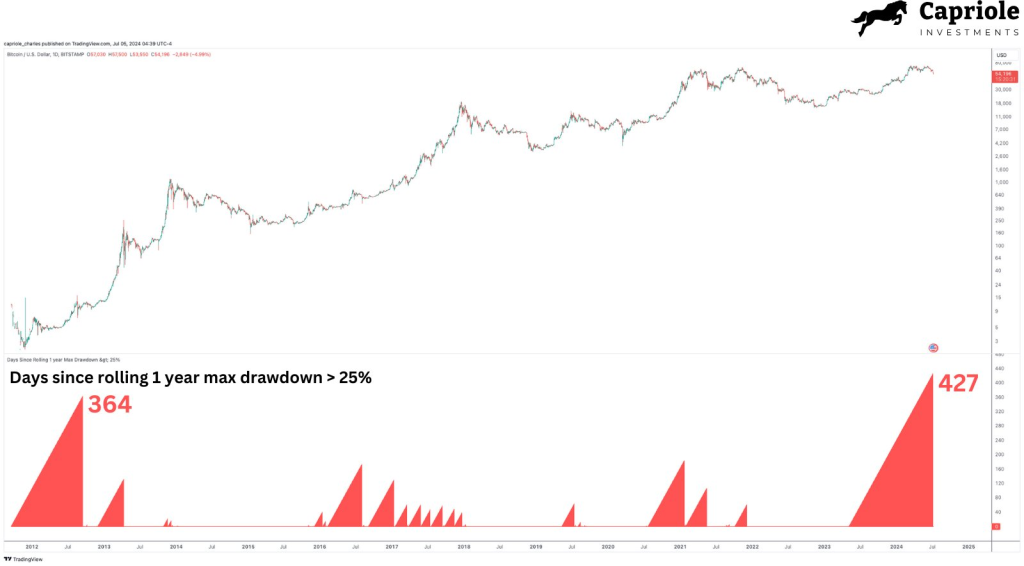
Some of you may have also noticed that the current bull run has not had many meaningful drawdowns for price. So, if we then look at how many days it's been since Bitcoin had a more than 25% drawdown in price, we can see that the most recent run has lasted for 427 days. This is the longest period Bitcoin has gone without seeing a more than 25% drawdown in price.
This would suggest to us that this correction has been long overdue but that the correction in terms of size still remains typical of Bitcoin bull markets. Taking this approach and zooming out should help to reset emotions.
Days since Bitcoin last had a 25% correction
Complete resetting in mechanics
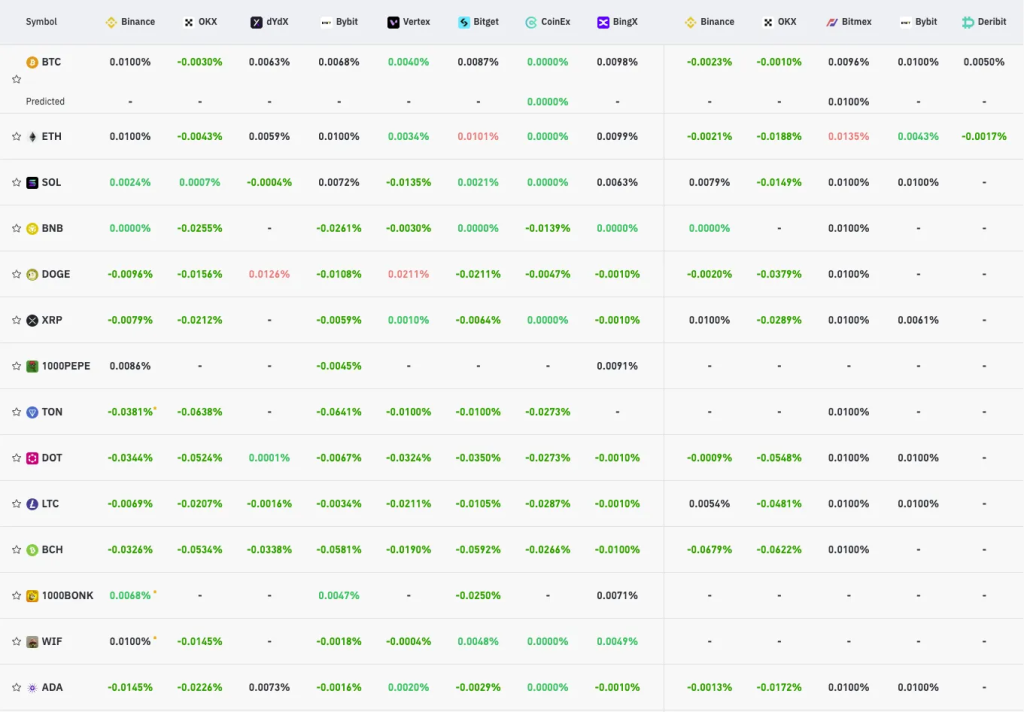
When we look at market mechanics, we want to look at the makeup of the leverage market. This involves looking at Funding Rates (are traders biased to be Long or Short), Open Interest (how much leverage is on/are traders betting with), and positioning (what was the positioning then and what is positioning now).So, starting with Funding Rates. We can see that BTC and ETH still have a positive 0.01% Funding Rate. This is a flat rate and means there is an even balance between Longs and Shorts, as neither side is overweight enough that it's pushing the Funding Rate higher or lower.
However, we can see that many of the altcoins have a very negative Funding Rate here. This is literally looking at the number and seeing it as negative. The more negative it is, the more traders are Short. Negative funding rates across the board open the door for a short squeeze.
Funding rates map
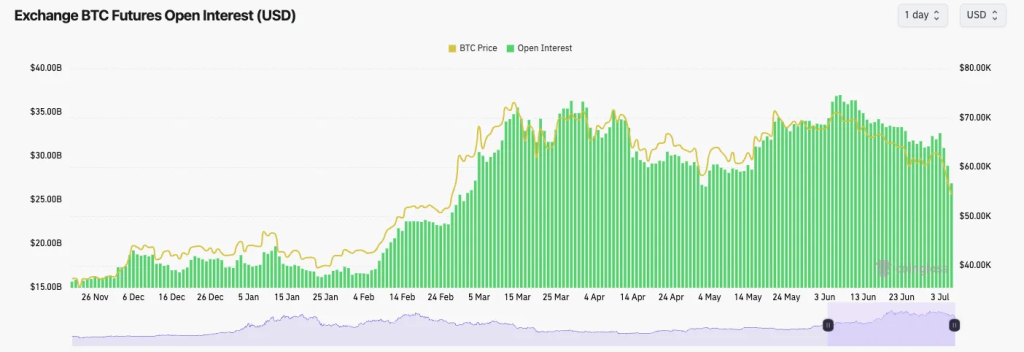
Now, looking at Open Interest and just looking at Bitcoin for this, we can see that Open Interest has dropped substantially over the last few days due to this move lower in Bitcoin.
The Open Interest highs in early June were at $36.99b, and just a few days ago, it was at $32.62b—an 11.81% decrease. However, in the last few days, It has declined to $26.89b, a further 17.56% decrease in just a few days.
This is a substantial wipeout of Open Interest, meaning a lot more of the excess leverage that had built up in the market has been wiped out.
Bitcoin's open interest
The above shows a substantial flushing out of Open Interest, a 27.30% decline, and positioning has now been more substantially reset as the market has seen over $600m in Long liquidations today.
Previously, the market had been looking at opportunities for Longs, but now participants have pivoted to wanting to be net Short. This setup tends to be a turning of the tide on a more zoomed-out view, i.e., we've had a long period where participants have wanted to be Long, and prices have pushed lower.
We're now potentially entering a period when participants want to be Short, which can help price grind higher. These market cleansing events are healthy and are usually needed in a wider bull market.
Macro data today
Today, we also have Labour Market data out, and if we continue to see further moderation in the labour market, that may be a driver of risk assets (crypto) moving up.A weakening labour market will bring the Fed to the Interest Rate-cutting table sooner than if the labour market remains resilient. The expectation is for Jobs to come in at 160k and for the Unemployment Rate to come in at 4.0%.
If the data comes in as expected or we see a slight further weakening, the market can rally as Interest Rate cuts are priced into the September Fed Meeting. If the data is resilient, that pushes rate cuts further out, and therefore, risk assets may sell off as they need the stimulative environment that Interest Rate cuts bring.
- Non-Farm Payrolls: Consensus 190k, Actual 206k
- Unemployment Rate: Consensus 4.0%, Actual 4.1%
Market psychology - educational piece
One key component of trading and managing an investment book is to sieve through the noise and maintain emotions when others are super fearful or greedy.If you believe you're in a secular bull market (we believe we are) and a period comes along when prices have sold off substantially but still remain within the ropes of typical drawdowns in prior bull markets, then as Warren Buffet says, "be fearful when others are greedy and be greedy when others are fearful."
This leads us on to...
Cryptonary's take
Let's simply break down what we have here;- Prices have pulled back substantially, but the magnitude of the pullback remains similar to that seen in prior bull markets.
- Today marks the end of the longest period of time Bitcoin has gone without a 25% correction. Therefore, this current correction has actually been long overdue and arguably needed.
- And yes, it has been needed. We can tell this by how much Open Interest (the amount of leverage) ramped up in early February and hadn't yet been flushed out. But, in the last few days, a substantial portion of this has now been flushed out.
- These leverage flush-outs are needed in a bull market to flush out the excesses/weak hands and reset positioning, which we can now see via the negative Funding Rates. Those Shorts will get flushed. Next, the market will be fully reset, and it can continue on higher from there in a healthier manner.
- Lastly, when we look at psychology, the market is very bearish, and the Twitter timeline is in shambles. We believe we're in a secular bull market, so with this amount of fear out there, Buffet's quote rings again: "Be greedy when others are fearful."
Action points
Today, I (Tom) have been greedy. I have added to bags that I believe are in the best value territory. ETH below $3,000 is one, SOL below $130 is another, and WIF around the $1.50 mark is the next. POPCAT at $0.40 is great, and it's held up brilliantly, but it's not as in "value territory" as the others (just in my opinion), so I haven't chosen to add to that one.BTC
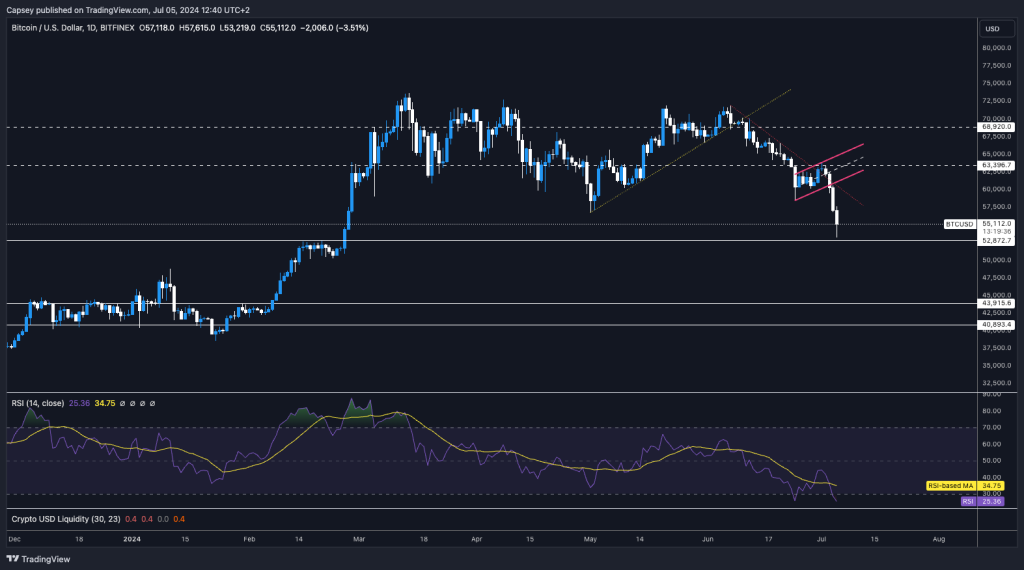
Bitcoin has broken down from the bear flag and shot straight down to the horizontal support around the $53k mark. So far, price has managed to bounce from this area, whilst the RSI is in oversold territory, having put in a bullish divergence yesterday.
If we close today below $54,500 (give or take), that may invalidate the bullish divergence; we'll have to see upon the close. One thing we do note is that with this kind of volatile move to the downside, it can take time for the market to recover.
But, historically, in these types of scenarios, with all the context and signs we have outlined above, being "greedy when others are fearful" is usually the more profitable approach.
Recommended from Cryptonary


