Save 23% ($351) & Get a Free 1-1 Call with our Team ⏰ : 0d 2h 59m 44s

This move wiped out over $500m in Open Interest (leverage positions). This looks like a leverage build-up and flush-out, but what other factors might be at play?
As usual, our market update considers our assessment of the macro, on-chain indicators, and charts. While you are familiar with on-chain indicators and charts from technical analysis, macro analysis is somewhat nuanced. But long story short, macro is any data that is meaningful enough to move the market.
So, what data points could move the market this week?
Let’s find out.
Editor's note: We first shared this update via Discord on September 27, 2023.
TLDR 📃
- FED emphasizing "higher for longer" rates is bad for risk assets like crypto
- Key indicators like oil prices, inflation, and US dollar strength are flashing warning signs
- These mid-term macro trends point to continued turbulence ahead
- For now, it might be better to stay on the sidelines in USDT until conditions improve
Disclaimer: Not financial or investment advice. You are responsible for any capital-related decisions you make, and only you are accountable for the results. “One Glance” by Cryptonary sometimes uses the R:R trading tool to help you quickly understand our analysis. They are not signals, and they are not financial advice. Any capital-related decision you make is your responsibility and yours only.
Mid-term headwinds for risk assets
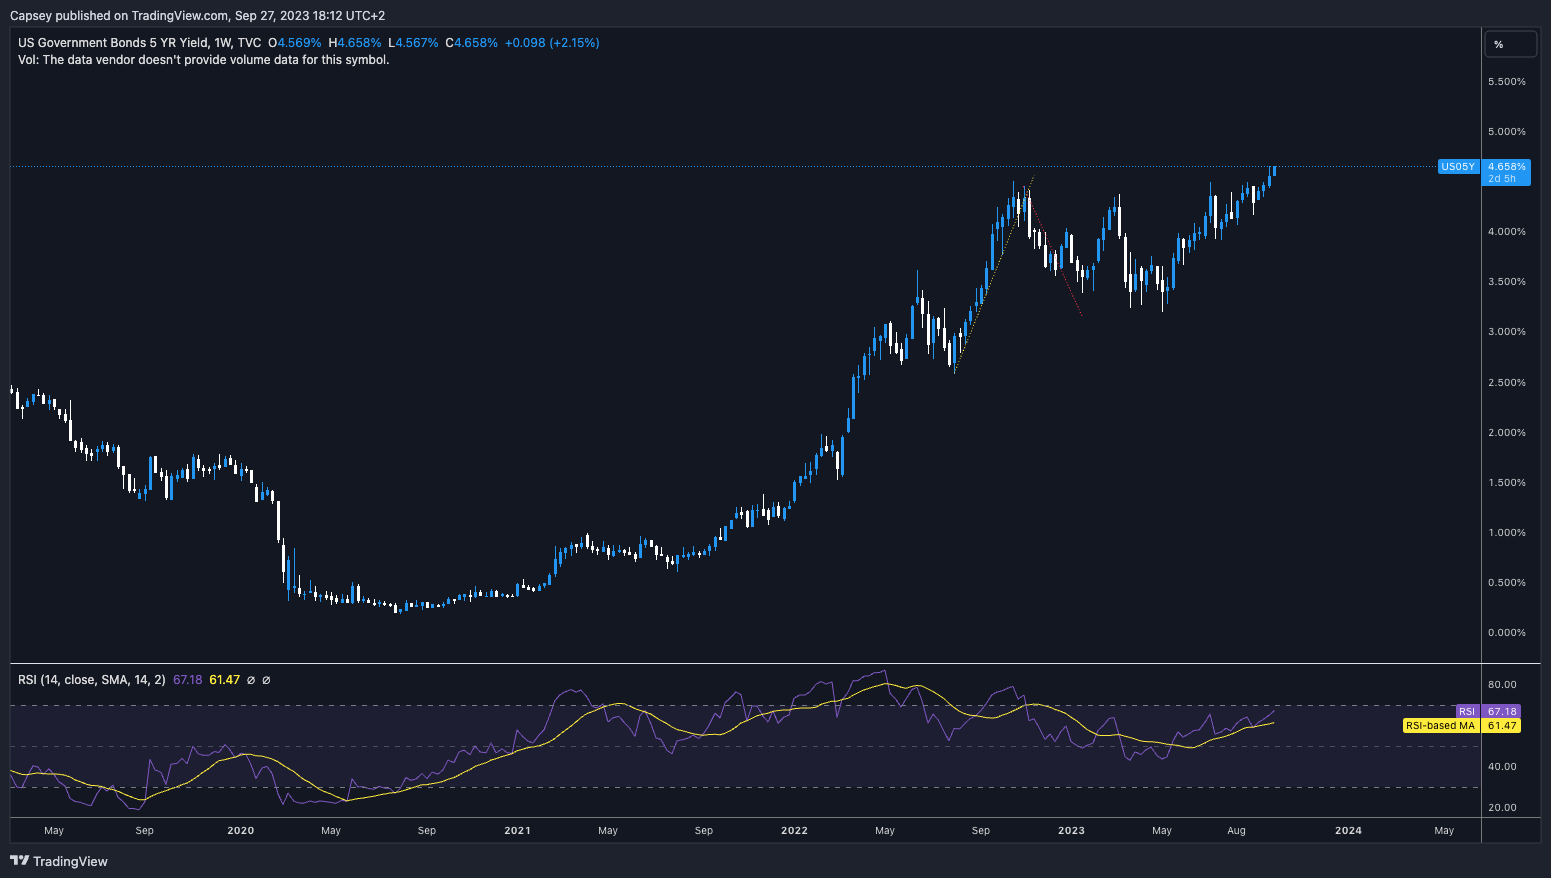
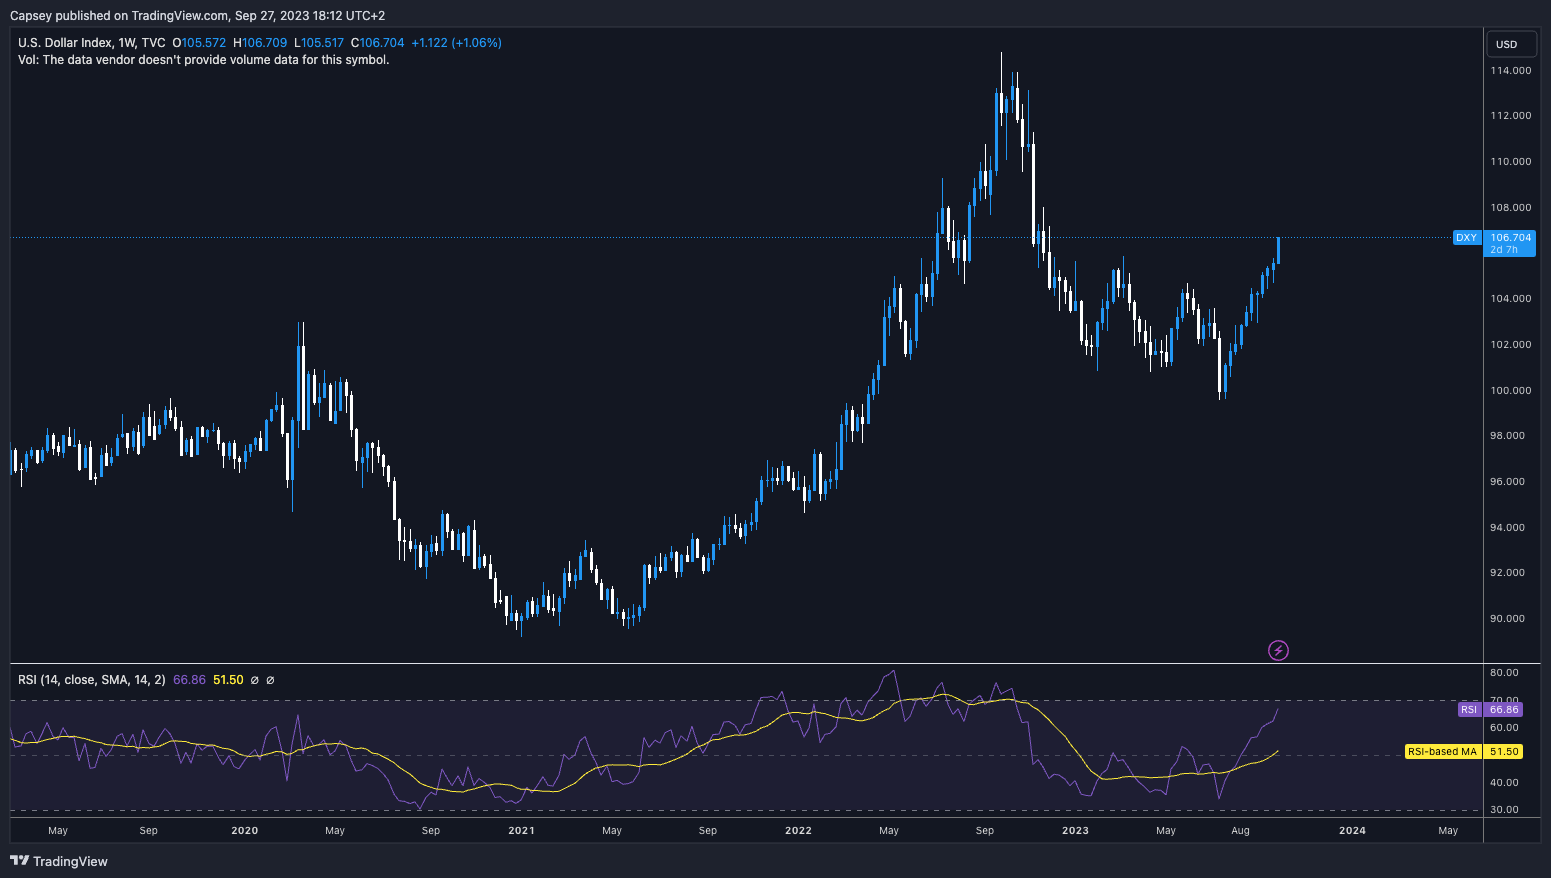
Since Powell spoke last week at the FOMC Press Conference, we've seen next year's rate cuts being priced out and the interest rate narrative of "higher for longer" being priced in.So, what is this higher interest rate narrative pricing in? It is the DXY (Dollar Index) moving higher, and yields also moving higher!
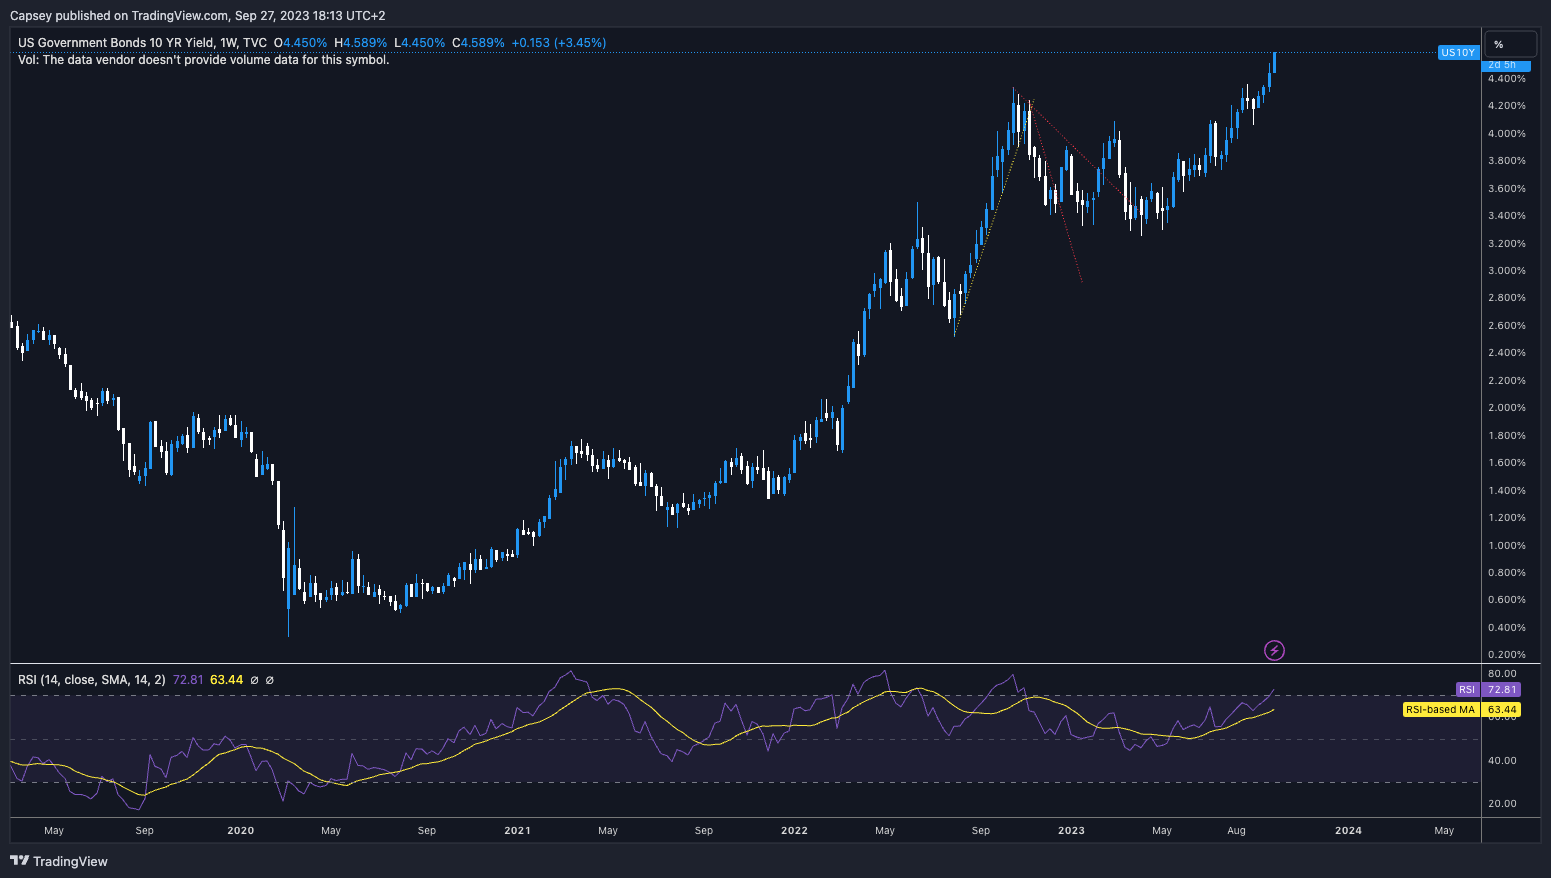
This higher-for-longer narrative is especially interesting as it shapes up the belly and towards the long end of the US 5Y and US 10Y bonds curve.
Weekly charts for DXY US 5Y and US 10Y
We’ve also seen Oil (Crude) on an absolute tear over the past few months, moving from $67 at the end of June to over $93 today. The surge in oil prices is phenomenally inflationary!
A weekly chart for oil
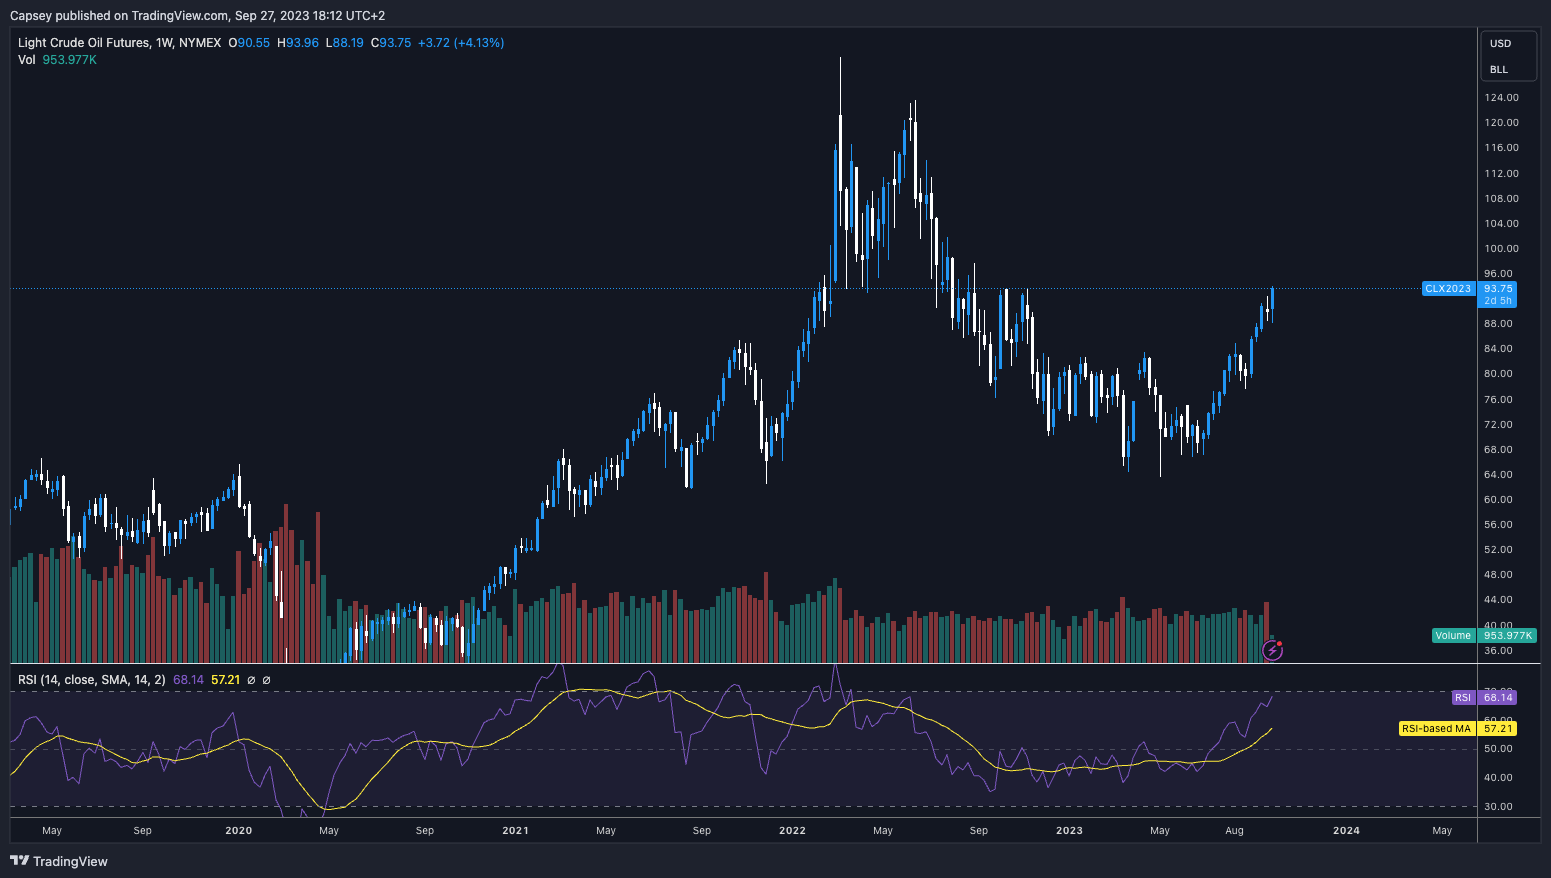
Now, think of just how hard this inflationary trend hits consumers at the petrol pump. So, this development adds to the FED maintaining a more hawkish tone, which will, in turn, see the DXY and yields going higher.
And this is all without Powell's hawkish comments at last week's Press Conference. So, now throw those hawkish comments into the mix also.
Risk assets are at risk
All-in-all, it's a terrible environment for risk assets to outperform. In fact, BTC has performed well amongst this, and we say that knowing it's gone from $30,000 to approximately $26,200 (at the time of writing). But a 12% or so pullback doesn’t seem too bad under these conditions.Over the mid-term, these trends will likely continue, especially if the labour market holds up. That will add more to this thesis of a Fed maintaining a higher and tighter interest rate environment for longer.
However, in the very short term (next week or so), we may see the DXY and yields take a breather, particularly the DXY, which is very over-bought (@76 on the daily RSI).
So, a potential slight move lower to reset some of the indicators might be enough of a breather that BTC can get some upside, potentially getting up to and putting in a more meaningful test of the $27,100 horizontal resistance.
Data to watch this week
The most key data releases this week are on Friday. We have the release of 'Personal Spending MoM (Month-on-Month change)', 'Personal Income MoM' and 'Core PCE Price Index YoY (Year-on-Year change)'.It is expected that Personal Spending will come in lower than last month's reading of 0.8%, with this month's consensus of 0.6%. Personal Income is expected to be slightly higher at 0.3%, more than last month's 0.2%. These changes may seem pointless, but if they are much greater or less than expected, they will be market-moving events. Therefore, we need to be aware of them and pay attention to them on the day.
Lastly, the 'Core PCE Price Index' is expected to come in at 3.8%. Last month, it was 4.2%. So, in our opinion, this is the data point that could move the markets. If this were to come in at 4.2% or north of 4.2%, the market wouldn't take this well and would likely sell down slightly. Link For Data: https://tradingeconomics.com/calendar
Imagine you have a position and are unaware of all these data, and an unexpected print is released. Such a development can chop you out of your position. It's key to be aware of everything that could affect your position... what is on the horizon that could be market-moving?
Cryptonary’s take 🧠
Overall, the FED emphasising "higher for longer", with DXY and yields going higher, is not good for risk assets.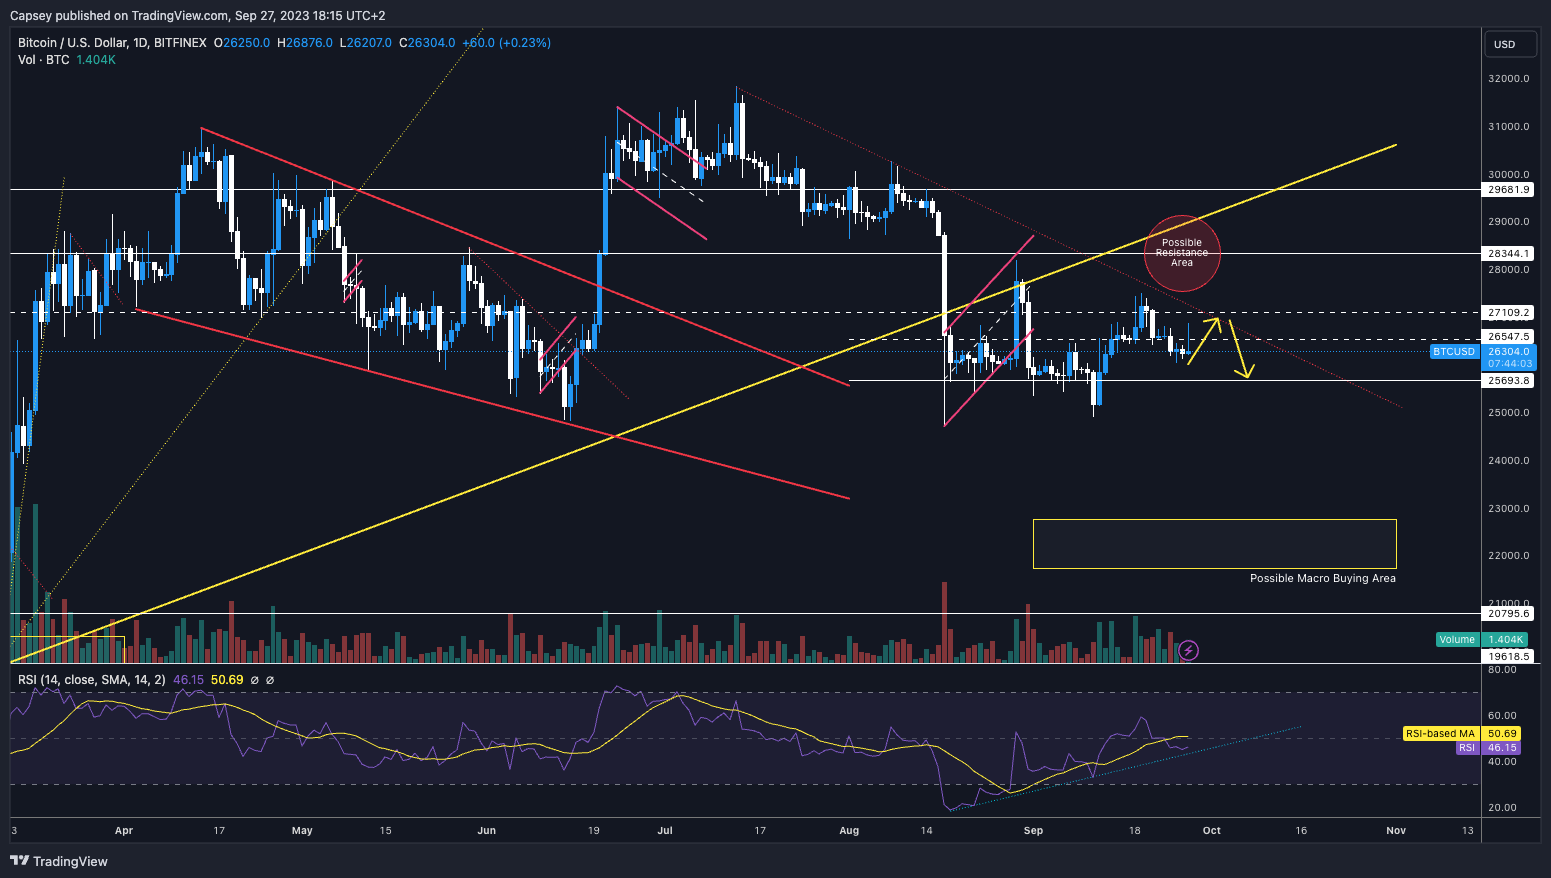
Even though our feeling is that the DXY and yields may take a breather in the short-term, we feel over the mid-term, the trends continue, which again are not good conditions for risk assets to perform well.
For these reasons, along with others (possible recession, for instance), we prefer to remain sitting on the sides and in USDT. We will stay on the sidelines until a potential trading opportunity presents itself where we may use a very small allocation of our USDT to take advantage of it.
For now, risk off and be patient. The time to DCA into the market and DCA aggressively will come; in our opinion, it's just not yet.
Recommended from Cryptonary


