Save 23% ($351) & Get a Free 1-1 Call with our Team ⏰ : 0d 2h 59m 44s
Market Direction

Disclaimer: This is not financial or investment advice. You are responsible for any capital-related decisions you make, and only you are accountable for the results.
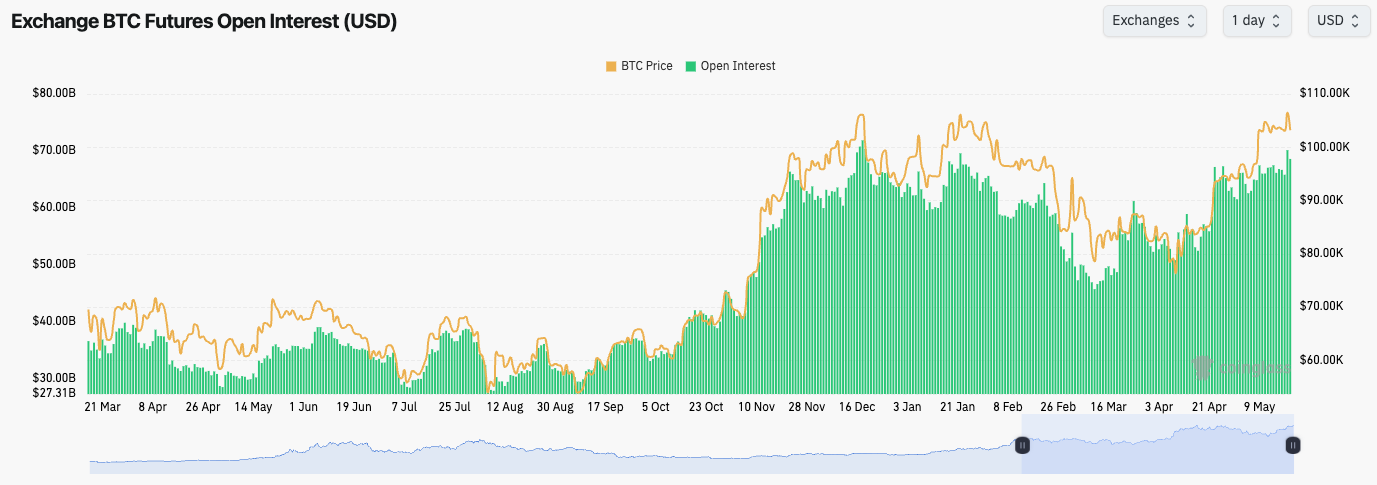
- BTC's OI spiked up over the last few days, and we saw this was mostly Longs, which were then flushed out on the Sunday evening pullback. OI remains high, but not as frothy as it was, whilst Funding Rates are relatively positive.
Technical analysis
- BTC was mostly range-bound between $102,000 and $105,000 when the price broke out higher on Sunday evening. However, price rejected into the main horizontal resistance at $106,900, which also converged with the underside of the uptrend line.
- The key horizontal resistance remains $106,900, and beyond that, the all-time high of $109,000.
- To the downside, $102,000 is the key horizontal support. A break beneath this level and price likely revisits the range between $93,000 and $95,000.
- If $102,000 is tested, then there is another local support at $98,900 that we should be aware of as well.
- As price moved up into $106,900, the RSI moved into overbought territory, whilst it also put in a bearish divergence (higher high in price, and a lower high on the oscillator).
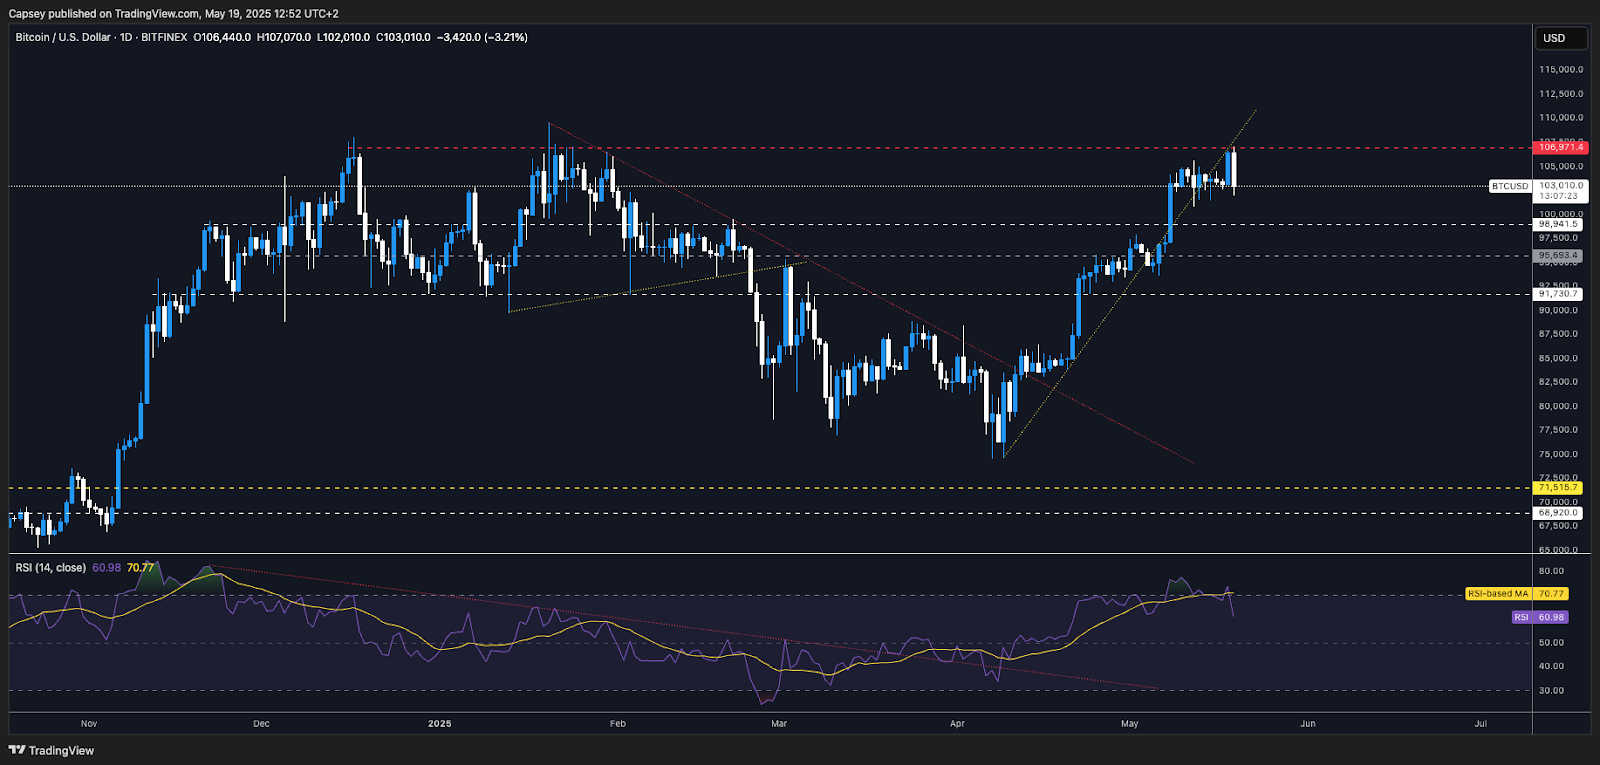
- Next Support: $102,000
- Next Resistance: $106,900
- Direction: Bearish
- Upside Target: $106,900
- Downside Target: $93,000
Cryptonary's take
From a charting perspective, Bitcoin has held the highs well, but it is showing signs of the upside momentum stalling, and therefore, a more substantial pullback may be on the cards. This might be due to trade de-escalation now being priced in and there being a lack of more positive news to continue to help drive prices higher.In terms of a pullback, we expect a more substantial pullback to happen, however, it may be a slow grind down, rather than an 'elevator down' scenario. This, therefore, might take time (a few weeks). Our first area of interest is the $93,000 to $95,000 range.
If price moves down to this level, we will reassess at the time as to whether we begin scaling in with Spot buys. For now, we're staying patient and not chasing strength into resistance.
Recommended from Cryptonary


PRO
Market Direction
13 min read
Mar 17, 2026
PRO
Market Direction
12 min read
Mar 13, 2026

PRO
Market Direction
13 min read
Mar 10, 2026
