Save 23% ($351) & Get a Free 1-1 Call with our Team ⏰ : 0d 2h 59m 43s
Market Direction

Disclaimer: This is not financial or investment advice. You are responsible for any capital-related decisions you make, and only you are accountable for the results.
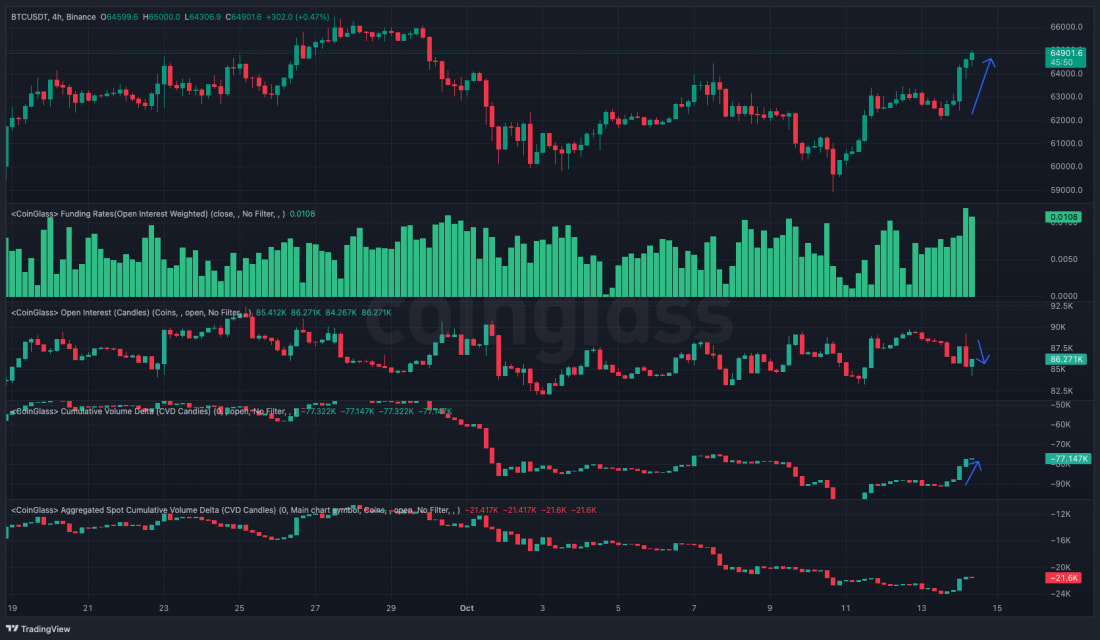
- Price has been pushed up by Spot buying, whilst Open Interest has decreased and Funding Rates are up (so Shorts closing out).
- From a mechanics viewpoint, this is what you want to be seeing.
Technical analysis
- We initially thought BTC might reject at the $63,400 level and pull back further. But, price has broken to the upside, great to see.
- Price has also broken out above the descending wedge, which we expected, but thought we might see that price pull back first.
- The $65k to $66k has previously acted as a resistance zone for price, so this is a key level for Bitcoin to overcome here.
- To the downside, we'd expect the $63,400 level to act as a new local support for price.
- The RSI has broken above the Moving Average and is now heading higher, but not yet close to being overbought.
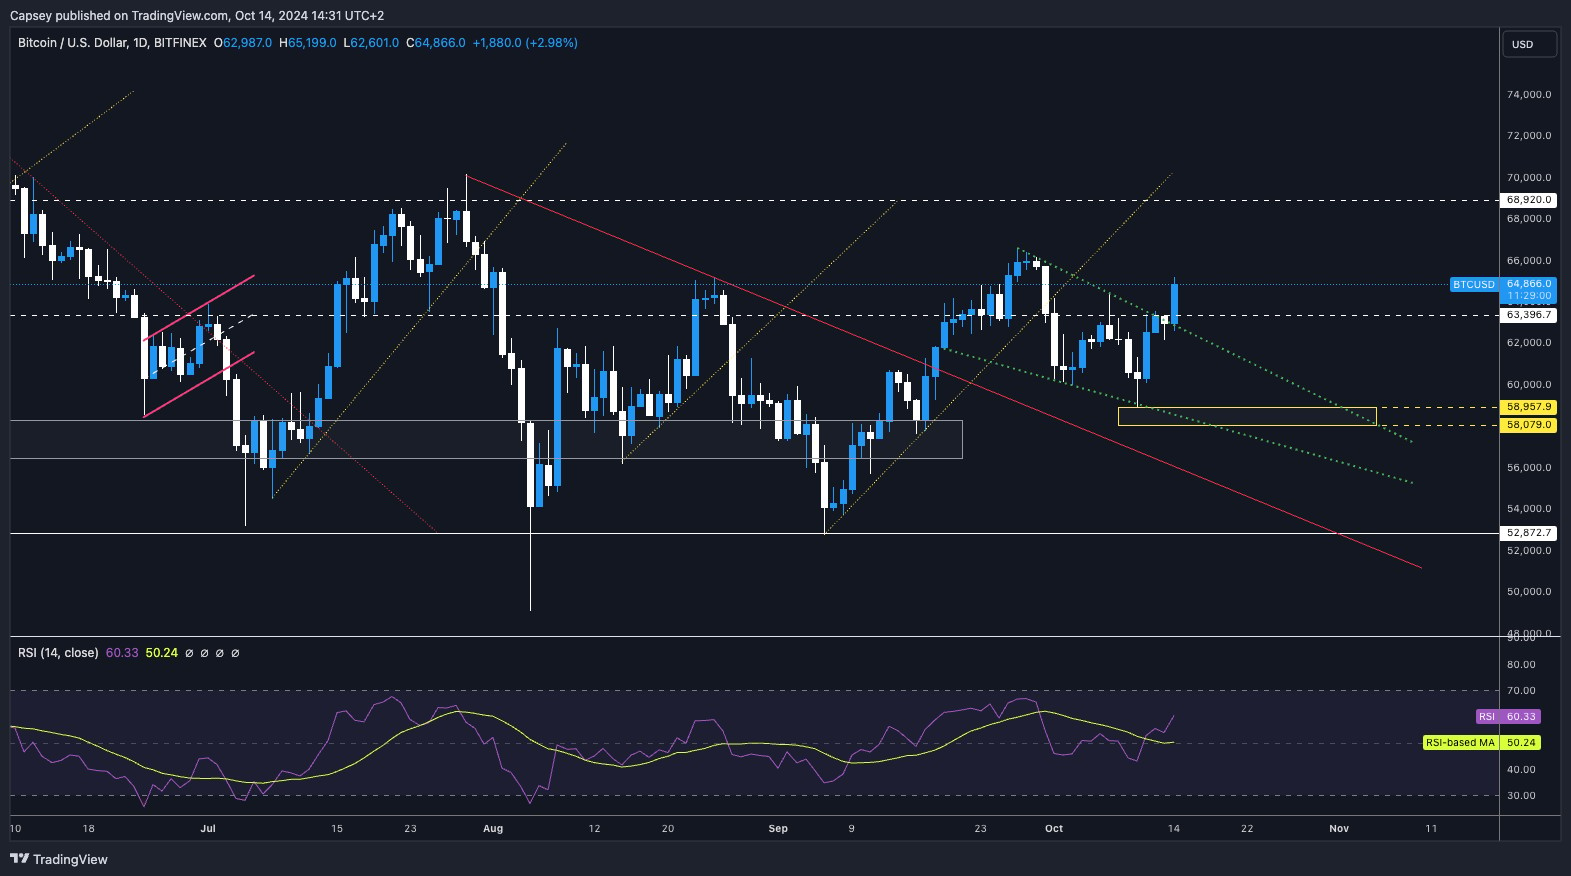
- Next Support: $63,400
- Next Resistance: $66,000
- Direction: Neutral
- Upside Target: $66,000
- Downside Target: $63,400
Cryptonary's take
A really positive move here from Bitcoin, which is perhaps playing some catchup (to MicroStrategy, which has been ripping higher). Now it's possible that full risk-on attitude isn't ready to come back in, just weeks before what looks like a close US Presidential Election. However, chart-wise, BTC looks good, so we're positioned well.In the short term, it's possible that BTC struggles here as we're at a horizontal resistance ($65k to $66k). Therefore, it's possible we will see a slight pullback to potentially $63,400 before we can test higher from there. Very hard to call in the immediate short-term here. A break above $66k would be seen as a huge sign of strength, and we would be at full risk of this.
Recommended from Cryptonary


PRO
Market Direction
13 min read
Mar 17, 2026
PRO
Market Direction
12 min read
Mar 13, 2026

PRO
Market Direction
13 min read
Mar 10, 2026
