Save 23% ($351) & Get a Free 1-1 Call with our Team ⏰ : 0d 2h 59m 44s
Bitcoin's big breakout on hold as macro data clouds the outlook
We have a huge week ahead from a macro lens. On Wednesday, we have the release of new inflation data and a few hours after that, we have a Fed meeting and a new Dot Plot. Wednesday is a huge day and has the potential to be majorly market-moving in the short and mid-term.

Today's market update covers last week's jobs data and its immediate and mid-term impact on the markets. We then dive into this week's inflation data and Fed meeting and how they may move the markets.
We then finish up with what this all means in Cryptonary's take and what the possible price action of BTC could be under the scenario we think is most likely for the markets.
This update is relatively long, but we've tried to cover every aspect of the macro market, simplify it, and then translate that into Bitcoin and its potential price action. If you don't want to read the whole thing, jump down to Cryptonary's take.
But if you want to improve your understanding of the overall market and why specific, individual data points can be pivotal in changing the market setup, we suggest reading the whole update.
Let's go!!!!!
TLDR
- Last week's strong U.S. jobs report (272K jobs added) has markets pricing in fewer and later Fed rate cuts in 2024, pushing out Bitcoin's potential breakout.
- This Wednesday brings crucial inflation data and a Fed meeting that could majorly impact markets in the short/mid-term.
- If inflation comes in hot, markets may sell off ahead of the Fed meeting. Cooler prints could spark a rally, but the market will mostly await Powell's guidance.
- In the Fed's new dot plot, the market is watching if they revise down expected 2024 rate cuts from 2-3 to just 1-2, giving the green light.
- The crypto rally has paused for now, with Bitcoin rejecting the $71.5k breakout. A range-bound summer is likely before a potential end-of-year breakout.
- Stay patient and positioned. This week's big macro drivers will set the tone for Bitcoin's next major move.
Disclaimer: This is not financial or investment advice. You are responsible for any capital-related decisions you make, and only you are accountable for the results.
Last Friday's jobs data and its market impact
Last Friday, Non Farms Payrolls came in at 272k, well above the 180k consensus, while the Unemployment Rate rose from 3.9% to 4.0%. On the surface, this doesn't make too much sense. How can you add what's considered a large number of jobs (272k), yet the Unemployment Rate goes up?Well, it's essentially due to immigration. The U.S. has benefitted from a large increase in immigration, which has led to an expanding labour force. The result is that the U.S. can add a substantial amount of jobs, but the Unemployment Rate still rises at the same time.
The Fed currently seems biased toward beginning to cut rates. However, with the U.S. still adding a strong number of jobs (272k in May), the argument for cutting interest rates becomes more difficult despite the Unemployment Rate increasing to 4.0%.
Alongside this, the Average Hourly Earnings MoM came in at 0.4%, well above last month's 0.2% read. Increasing Wages is inflationary, and therefore, again, this supports the argument for no interest rate cuts in the immediate short term. The Fed can't be seen to be cutting interest rates (a moderation in policy) when there are still inflationary pressures from wages.
Friday's market reaction
Following the data, the market began to price rate cuts back out/push them back.Before the data, the market was pricing for two interest rate cuts in 2024, with them potentially beginning in July but more than likely beginning in September.
Following the data, the market has now priced for just 1.5 interest rate cuts in 2024, with them beginning in September or November, pushing them back out.
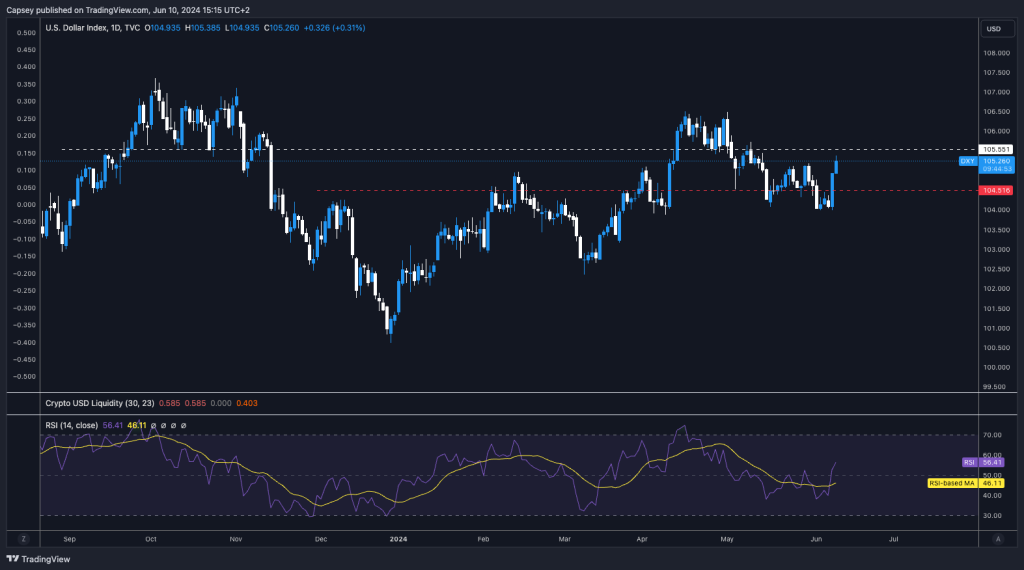
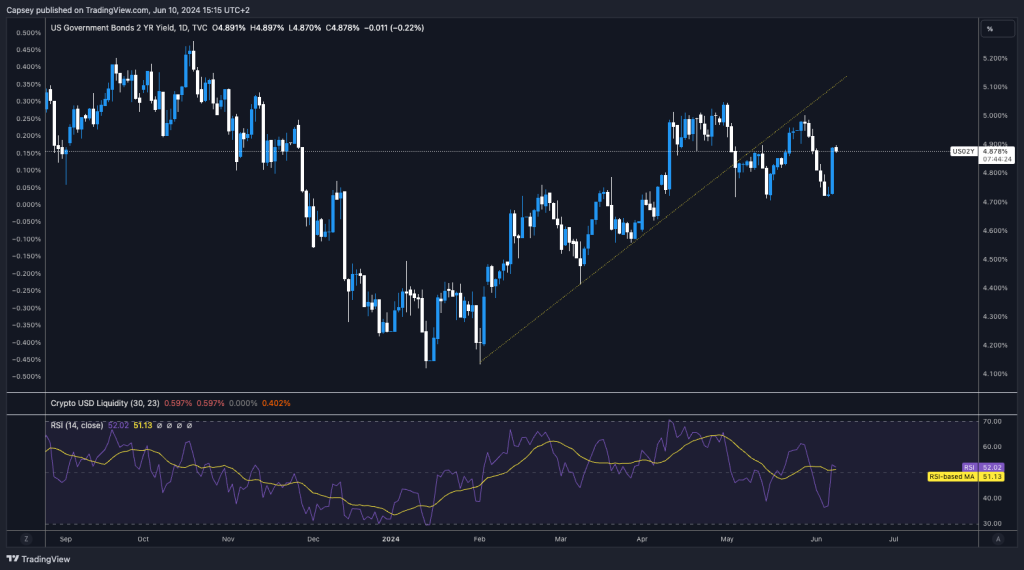
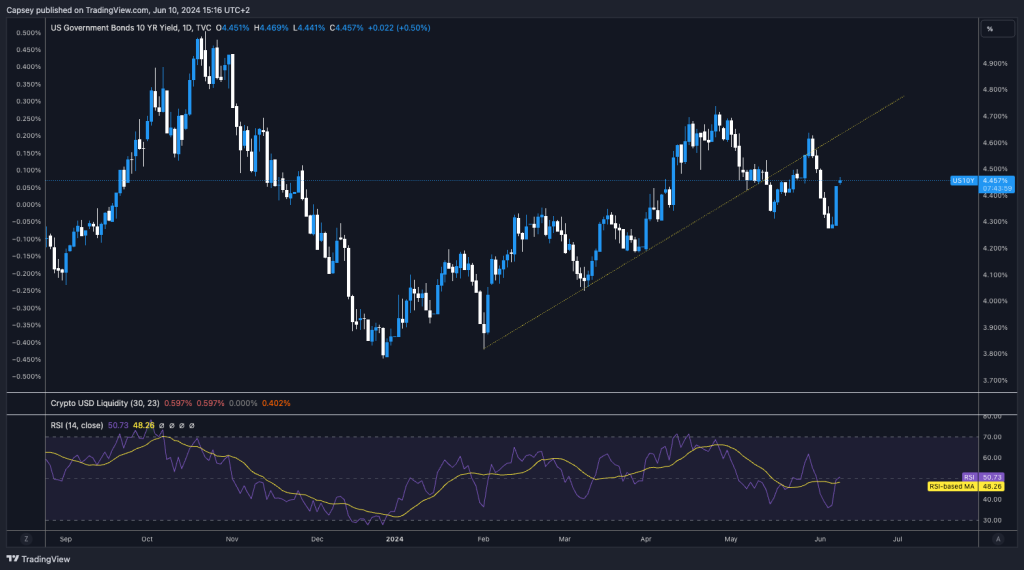
This caused Bond Yields and the Dollar Index to spike dramatically higher. Over the last two weeks, we've seen a number of Central Banks begin to cut interest rates, yet with a stronger labour market, this pushes out U.S. interest rate cuts, strengthening the Dollar Index (against other currencies).
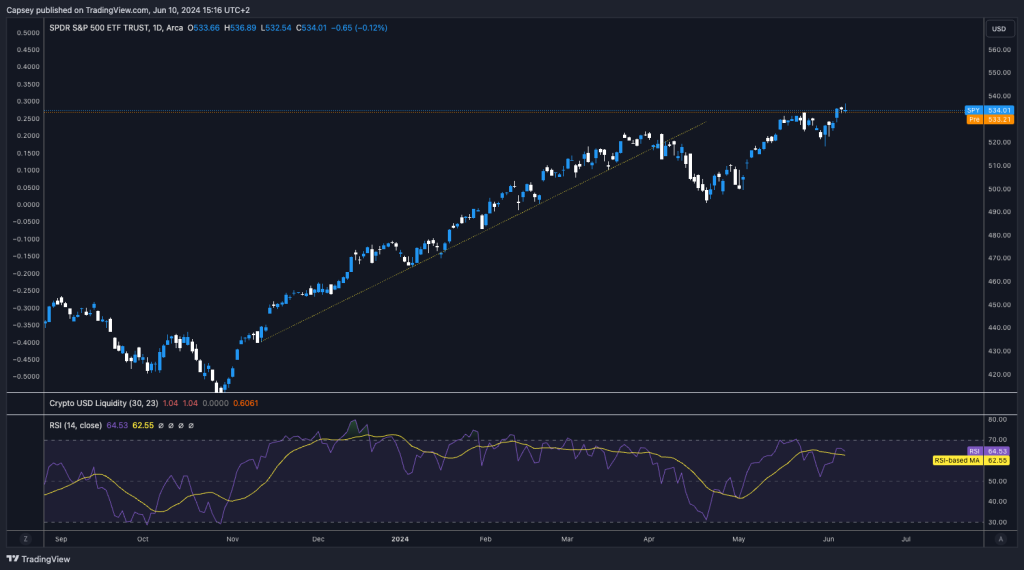
A higher DXY and higher Bond Yields would usually be bearish for risk assets like the S&P and crypto, yet the S&P has managed to hold at its highs. This is partly due to a strong economy and a strong labour market (as seen by the 272k jobs added in the U.S. in May). A strong economy means that consumer spending should continue, and therefore, positive corporate earnings can also continue, which is positive for the stock market.
$DXY 1D Chart
$US 2Y Yield 1D Chart
$US 10Y Yield 1D Chart
$SPX 1D Chart
Wednesday's inflation data
This Wednesday (12th June), we have the inflation data. The expectation is for Core Inflation YoY to come in at 3.5%, a slight downtick from the prior reading of 3.6%. The expectation for Core Inflation MoM is 0.3%, the same as the prior reading.The markets will have already priced in the expectations, so essentially, if the data comes in hotter (higher), the market will potentially sell off going into the Fed Meeting. But if the prints come in softer (lower), especially if the MoM figure were to come in at 0.2%, then markets would potentially rally.
However, it is also possible that, relatively regardless of the print, the market may remain flat as it may be apprehensive ahead of the Fed Meeting and the Powell Press Conference. But, following Powell and the Fed, that's when the market may make a more meaningful move.
This Wednesday's Fed meeting
The expectation is that the rate of interest will not change. The focus will be on the Fed's newly issued Dot Plot and then the Powell Press Conference.In the Dot Plot, the market will be watching whether the Fed revises down the number of interest rate cuts for this year. In the last Dot Plot, the Fed suggested that they'll make 2 to 3 interest rate cuts this year.
The market will be watching to see if the Fed revises that down to 1 to 2 interest rate cuts. The less the Fed revises this down, the more bullish it is; the more they revise it down, the more bearish it is.
Note: the market has already priced in for the Fed to reduce the amount of interest rate cuts to just 1 to 2 this year. So, if the Dot Plot shows that revision also, that won't be bearish – but probably actually bullish, as it'll mean the Fed is thinking the same as the market. This suggests that the Fed is almost giving the market a little bit of a green light for 1 to 2 interest rate cuts this year, i.e., "Don't worry, we're still planning to ease policy".
What might be interesting is if the Fed takes a similar stance to the European Central Bank (ECB), where they potentially still look to keep an ample amount of rate cuts on the table, but at the same time, they revise up their inflation target for the year.
Lastly, the market will then turn to the Powell Press Conference to see what forward guidance is given.
The most bearish outcomes will be if the new Dot Plot shows 0 interest rate cuts for 2024. Or, if, in the forward guidance from Powell, he re-introduces rate hikes back onto the table as an option, risk assets would potentially puke out on this news. However, we do not expect this at all and put it at really low odds of happening.Cryptonary's take
Risk assets, particularly crypto, were seemingly looking for a more material breakout higher, as the S&P had already made new highs.This was spurred by data showing a moderating in inflation and the labour market, meaning that the market was beginning to price in Fed interest rate cuts for the upcoming months.
However, Friday's hotter-than-expected labour market data has really put a 'spanner in the works' to that theory, with the market now pricing in fewer rate cuts and pushing them back out closer towards the end of the year.
The result of this has been that crypto as a whole has had the 'wind taken out of its sail' slightly, with Bitcoin rejecting its possible horizontal breakout level of $71,500.
Alongside this, altcoins have pulled back more substantially, especially considering that many had already gone through more meaningful retracement from their cycle highs. The result of all the above may be that Powell and the Fed remain more cautious. They still keep 1 to 2 interest rate cuts, but they don't come until closer to the end of the year. This may also mean that crypto, in general, remains range-bound for longer, likely more of the summer months.
This would set up a potential breakout at the end of the summer with a Bitcoin chart that looks like the one below.
$BTC 3D Chart
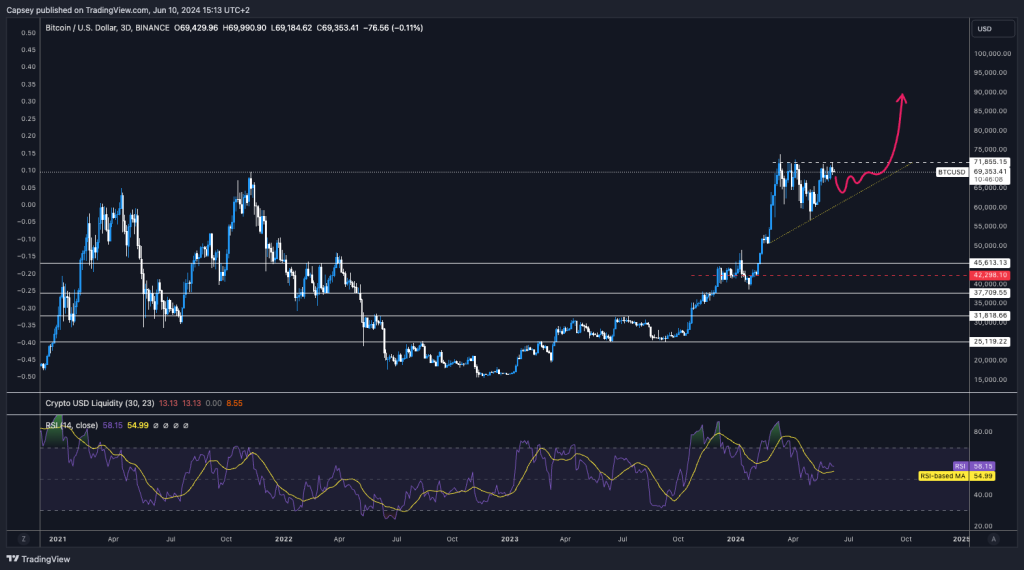
Potential price action for the next few months.
This is the theory for now.
Stay positioned and patient.
Cryptonary, Out!
Recommended from Cryptonary

