Log in

Save 23% ($351) & Get a Free 1-1 Call with our Team ⏰ : 0d 2h 59m 43s

Home
Research
Analysis
Community
  1. Cryptonary
  2. Market Analysis
  3. BNB and SUI lead amid market consolidation
Technical Analysis

BNB and SUI lead amid market consolidation

Published: Jan 6, 2025
0
Share:

BNB eyes a $730 breakout for bullish momentum, while SUI holds steady at $4 support. Both assets remain strong, offering key opportunities in a volatile market.

Post Feature Image

Disclaimer: This is not financial or investment advice. You are responsible for any capital-related decisions you make, and only you are accountable for the results.


BNB:

Market context

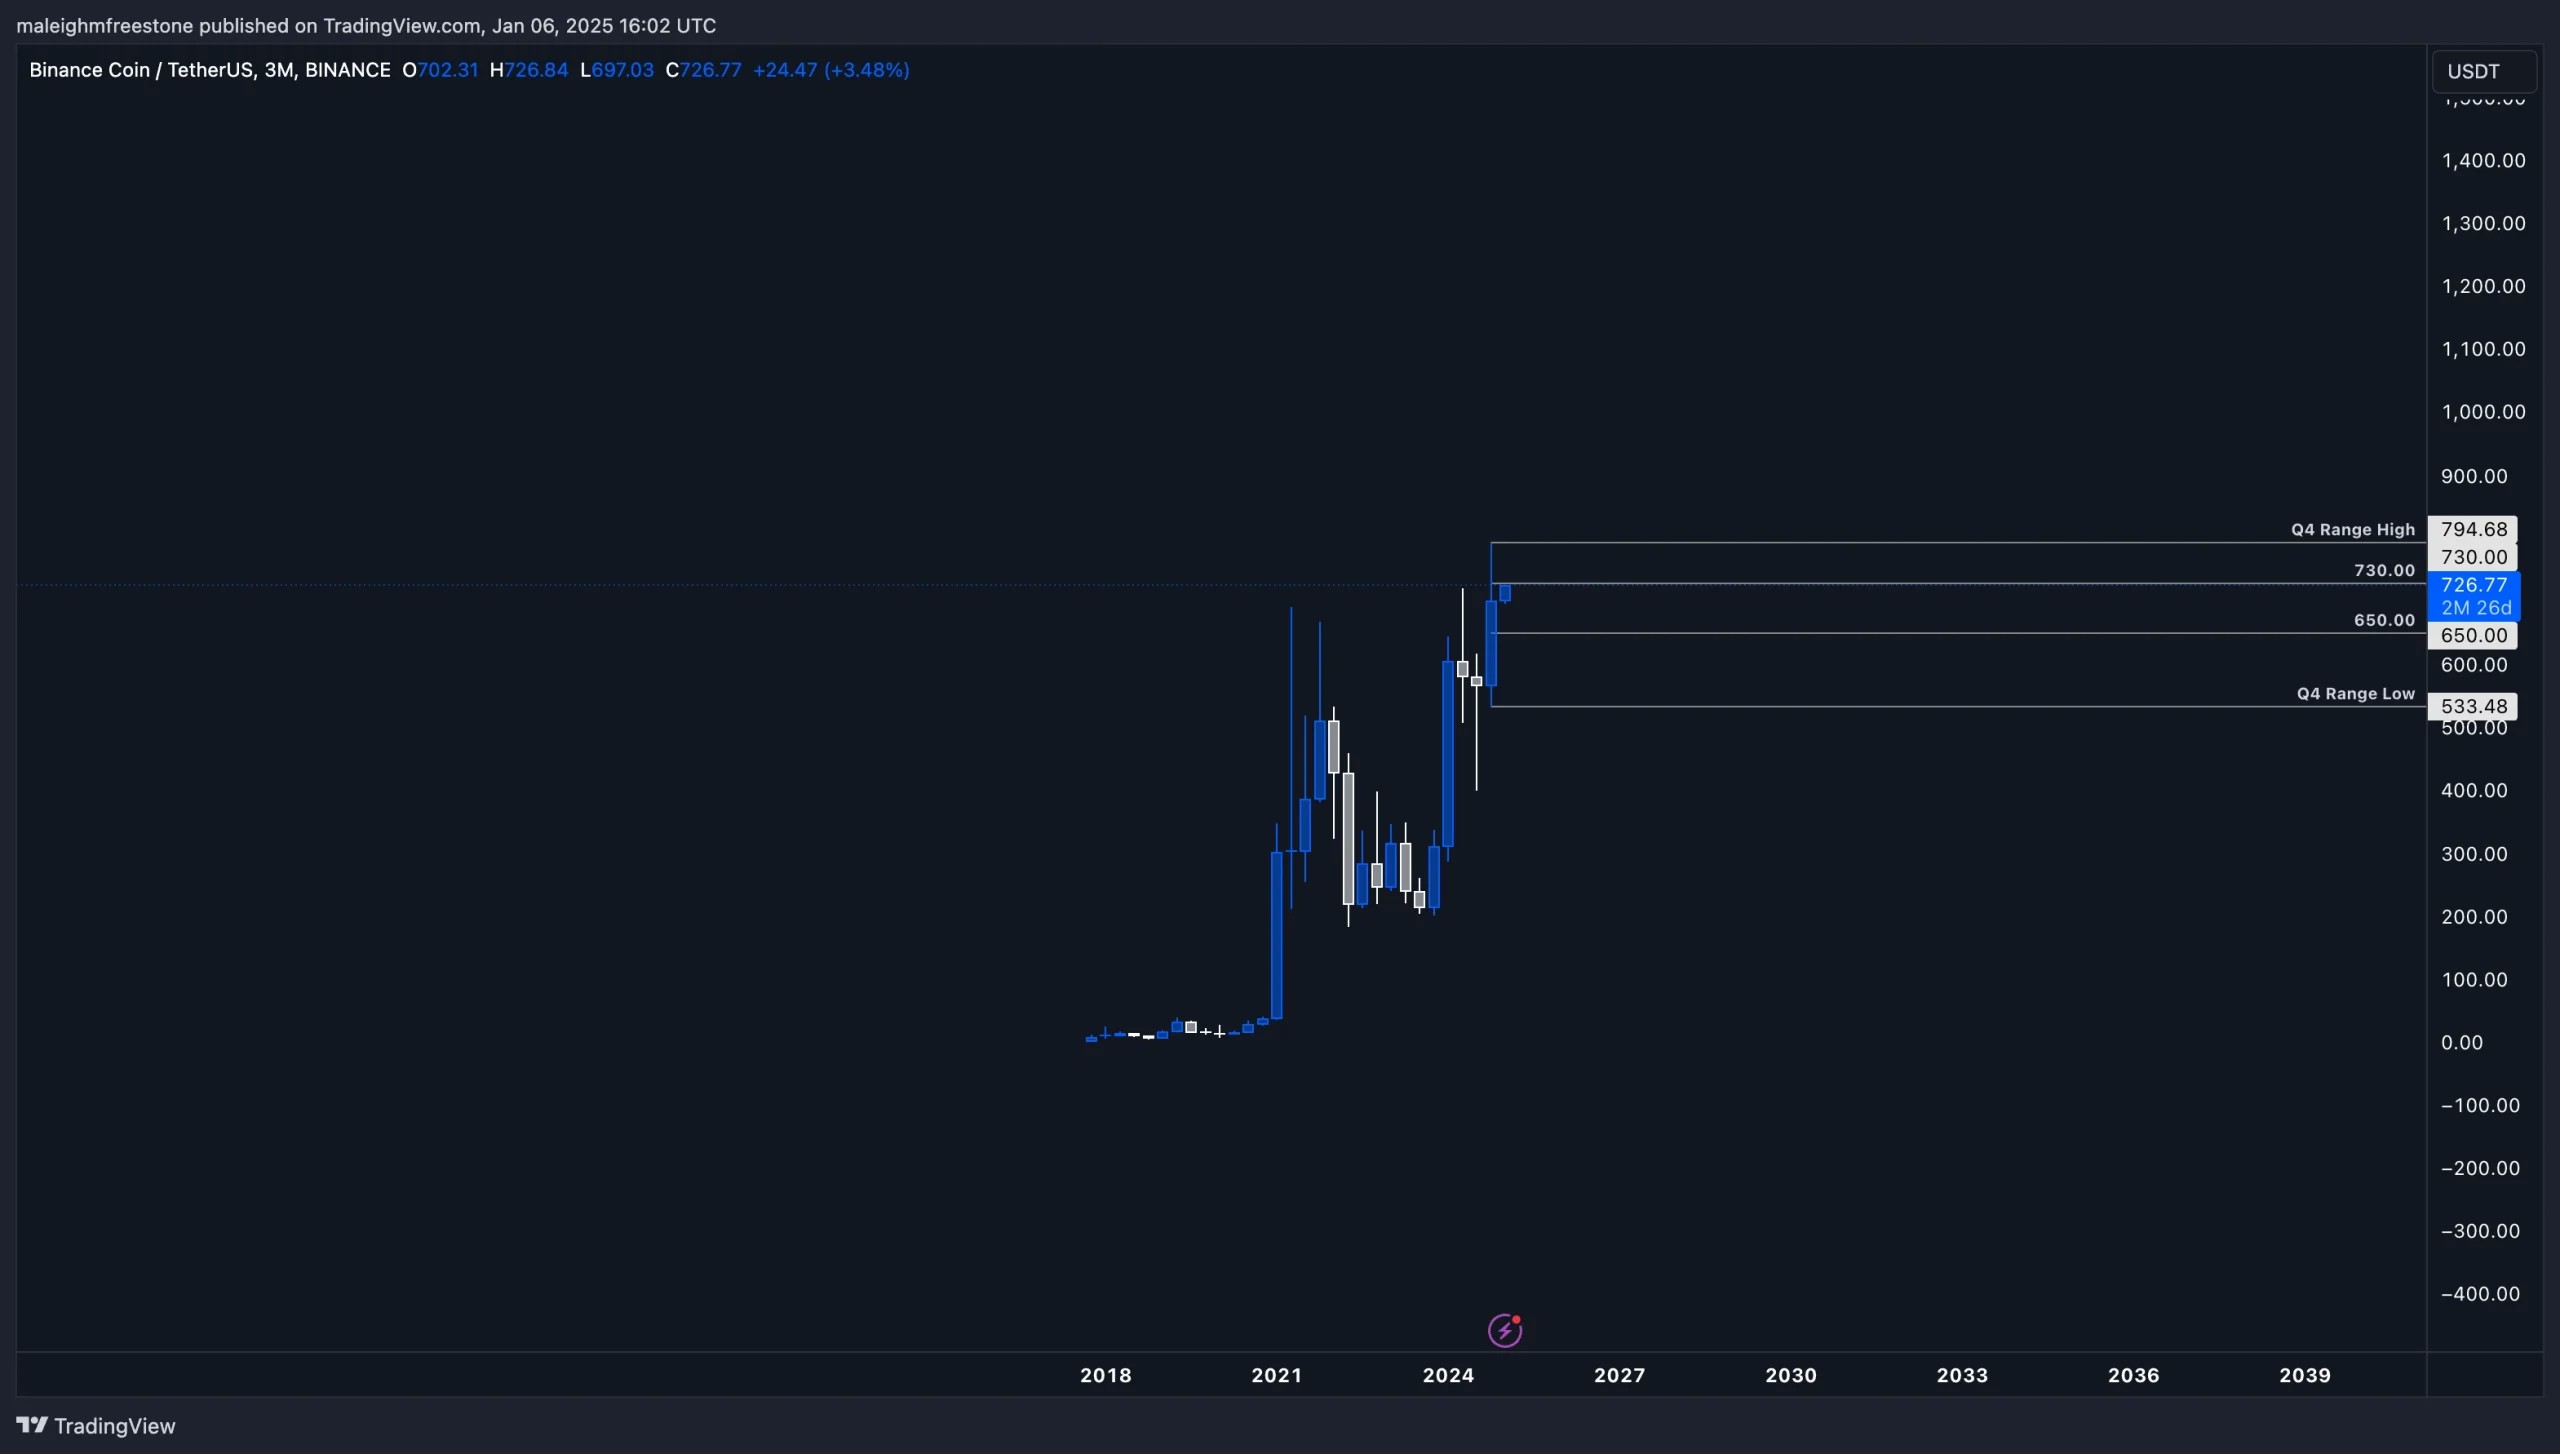
Starting on the three-month chart, we’re looking at fresh Q4 closures to guide our analysis for the year ahead. BNB’s Q4 range is clear: the range low sits around $533, and the range high is near $794, which is essentially its all-time high.

BNB continues to be a standout performer, both relative to the market and in terms of its market cap. The Q4 range gives us immediate context for potential price movements, highlighting areas to watch for upside and downside moves.

We don’t dismiss the possibility of retracements—this is the market we’re in, after all. The Q4 range low represents the extreme downside potential for now, but along the way, there are key supports on the daily timeframes that we’ll focus on.

1. BNBUSDT three-month chart showing Q4 range between 533 and 794, highlighting key support and resistance levels.

Price action

Resistance:

Near-term resistance sits at $730, a region that has consistently seen selling pressure. Breaking out above this level would be key to sending prices back toward the Q4 range high at $794.

Support:

Immediate support is at $650, which is historically significant. This level acted as key support throughout December and has captured plenty of price action in the past. It’s also the “scene of the crime” for a lot of BNB’s recent moves.
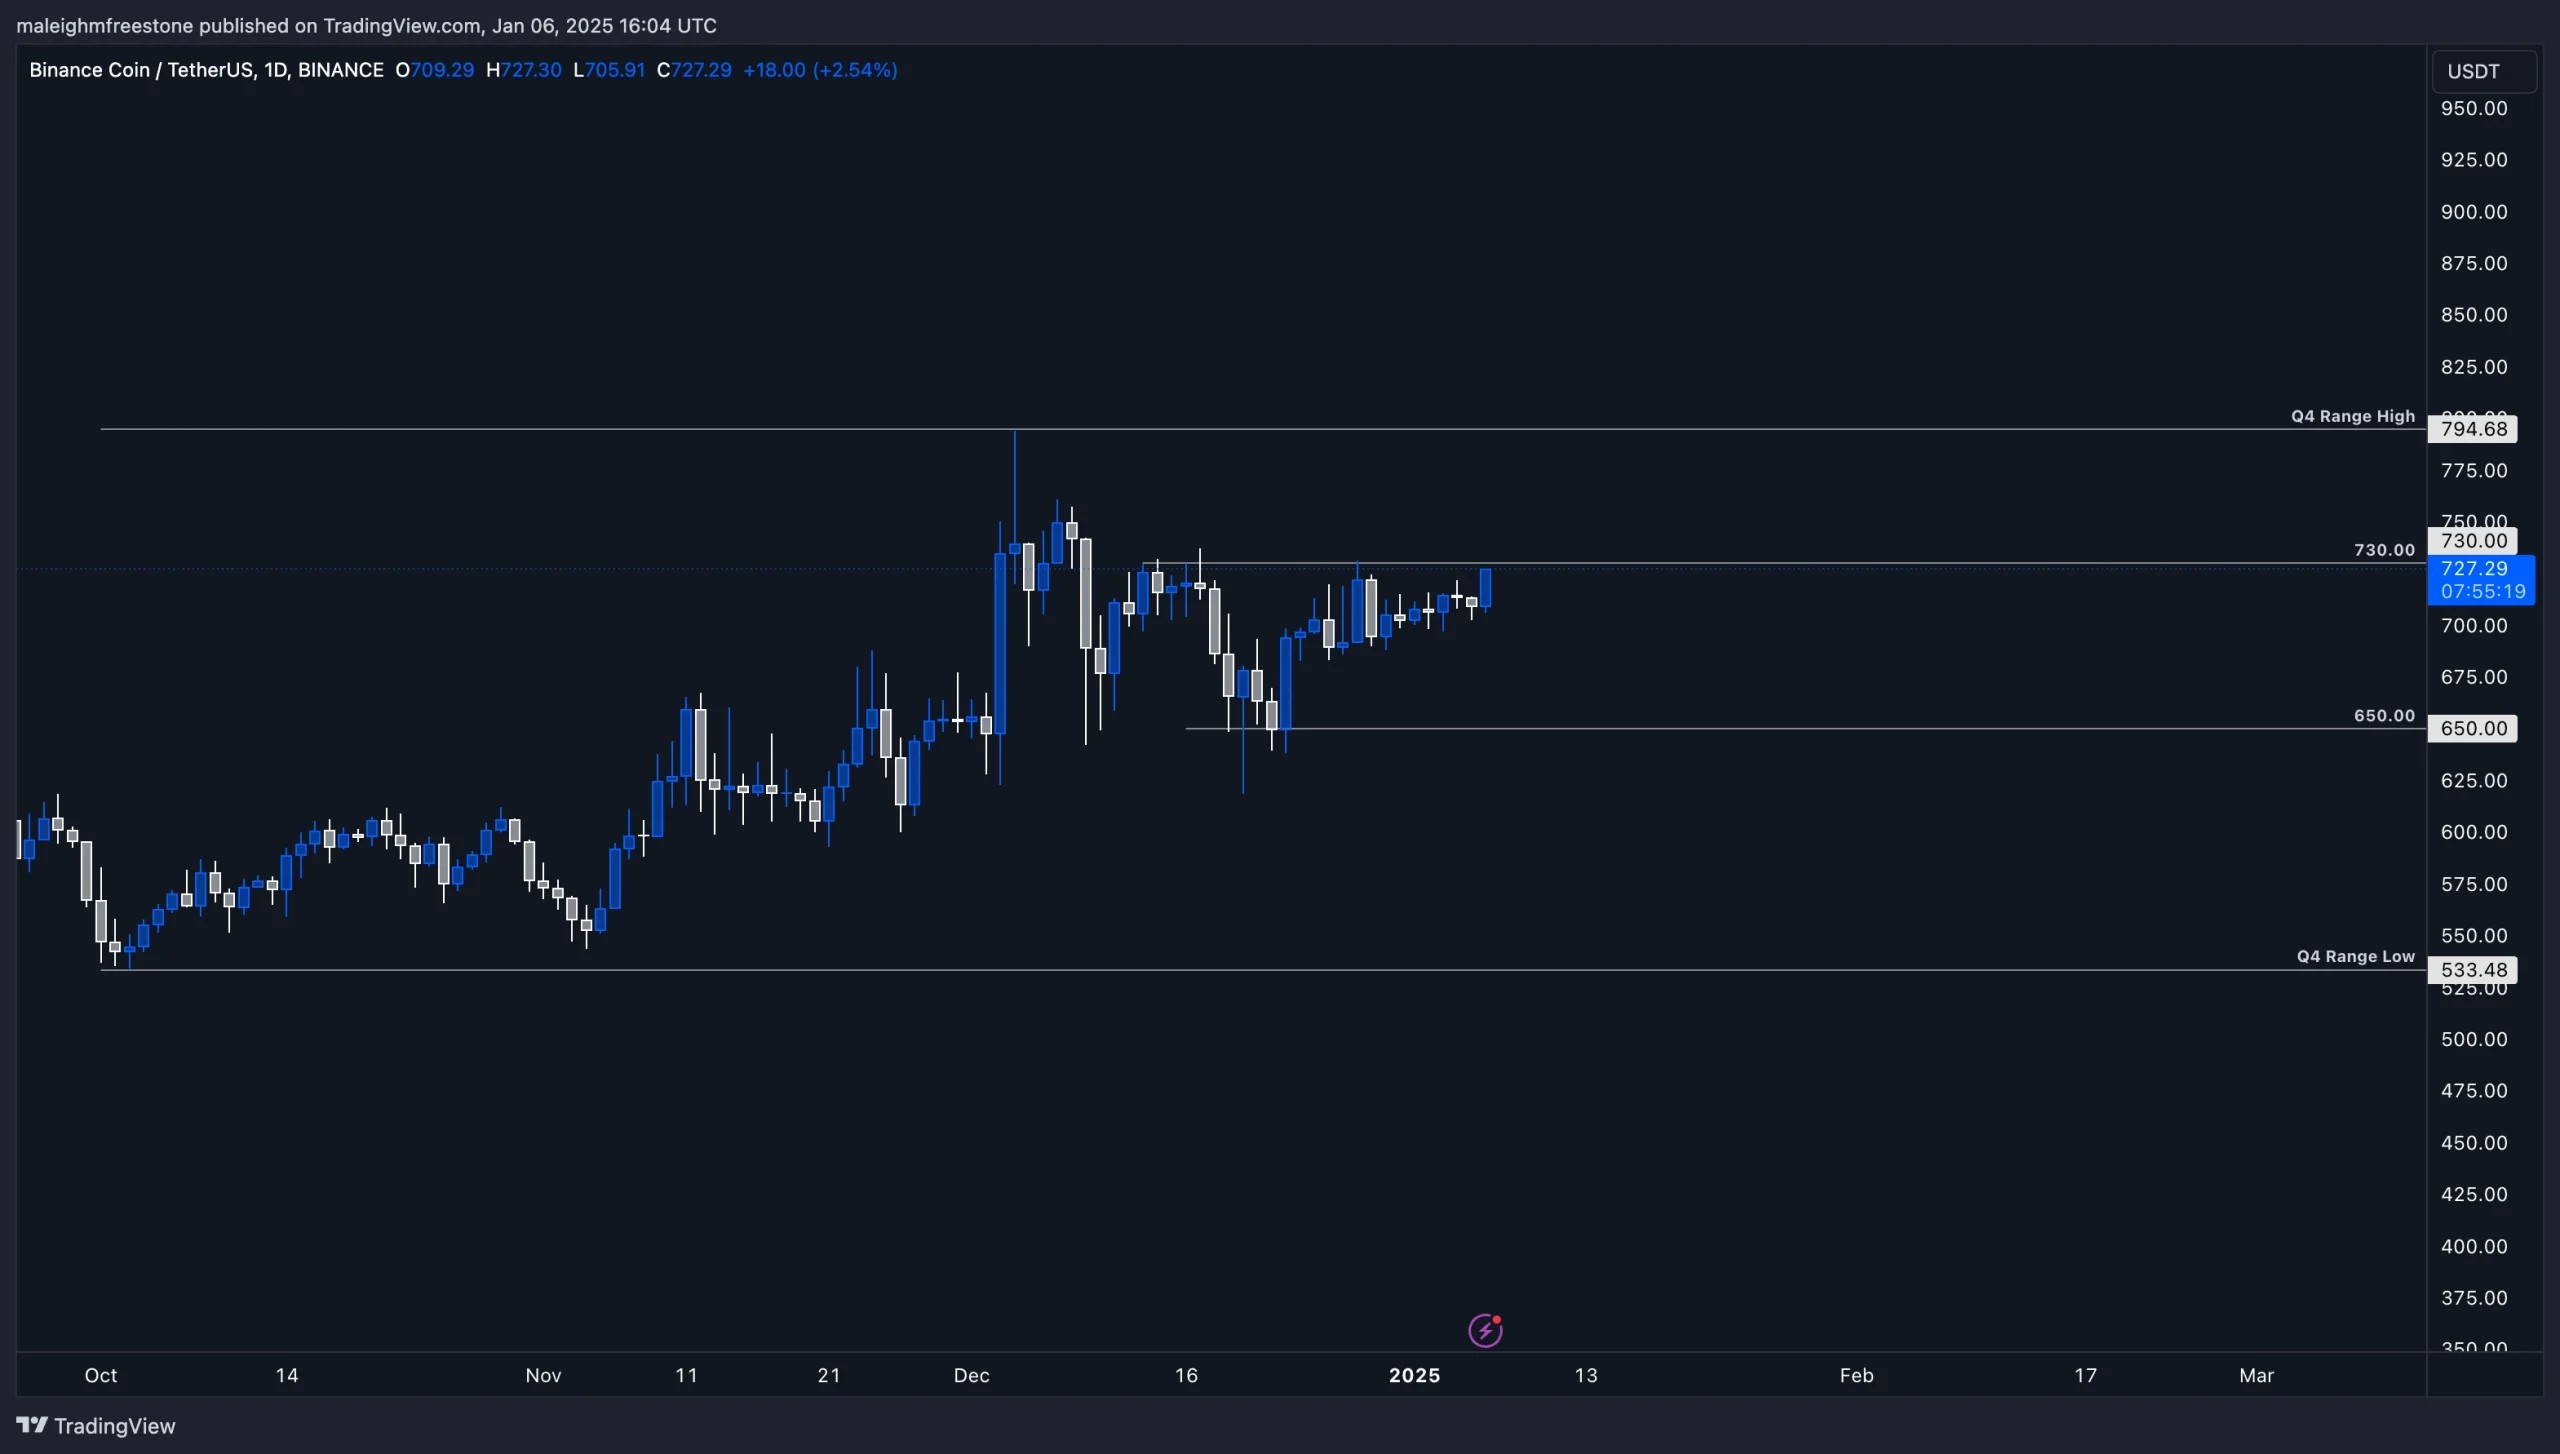
2. BNBUSDT daily chart illustrating resistance at 730 and support at 650, reflecting recent price consolidation patterns.

Playbook

Upside potential:

  • If BNB can break out above $730, we could see the price head back toward the Q4 range high at $794, which also marks an all-time high.

Downside potential:

  • A breakdown to $650 would represent a ~10% pullback, which isn’t massive but could provide a solid buying opportunity for the near term.

Range play:

  • For now, BNB is essentially trapped within this Q4 range, with price action looking choppy, consolidated, and undecided.

Higher timeframe context

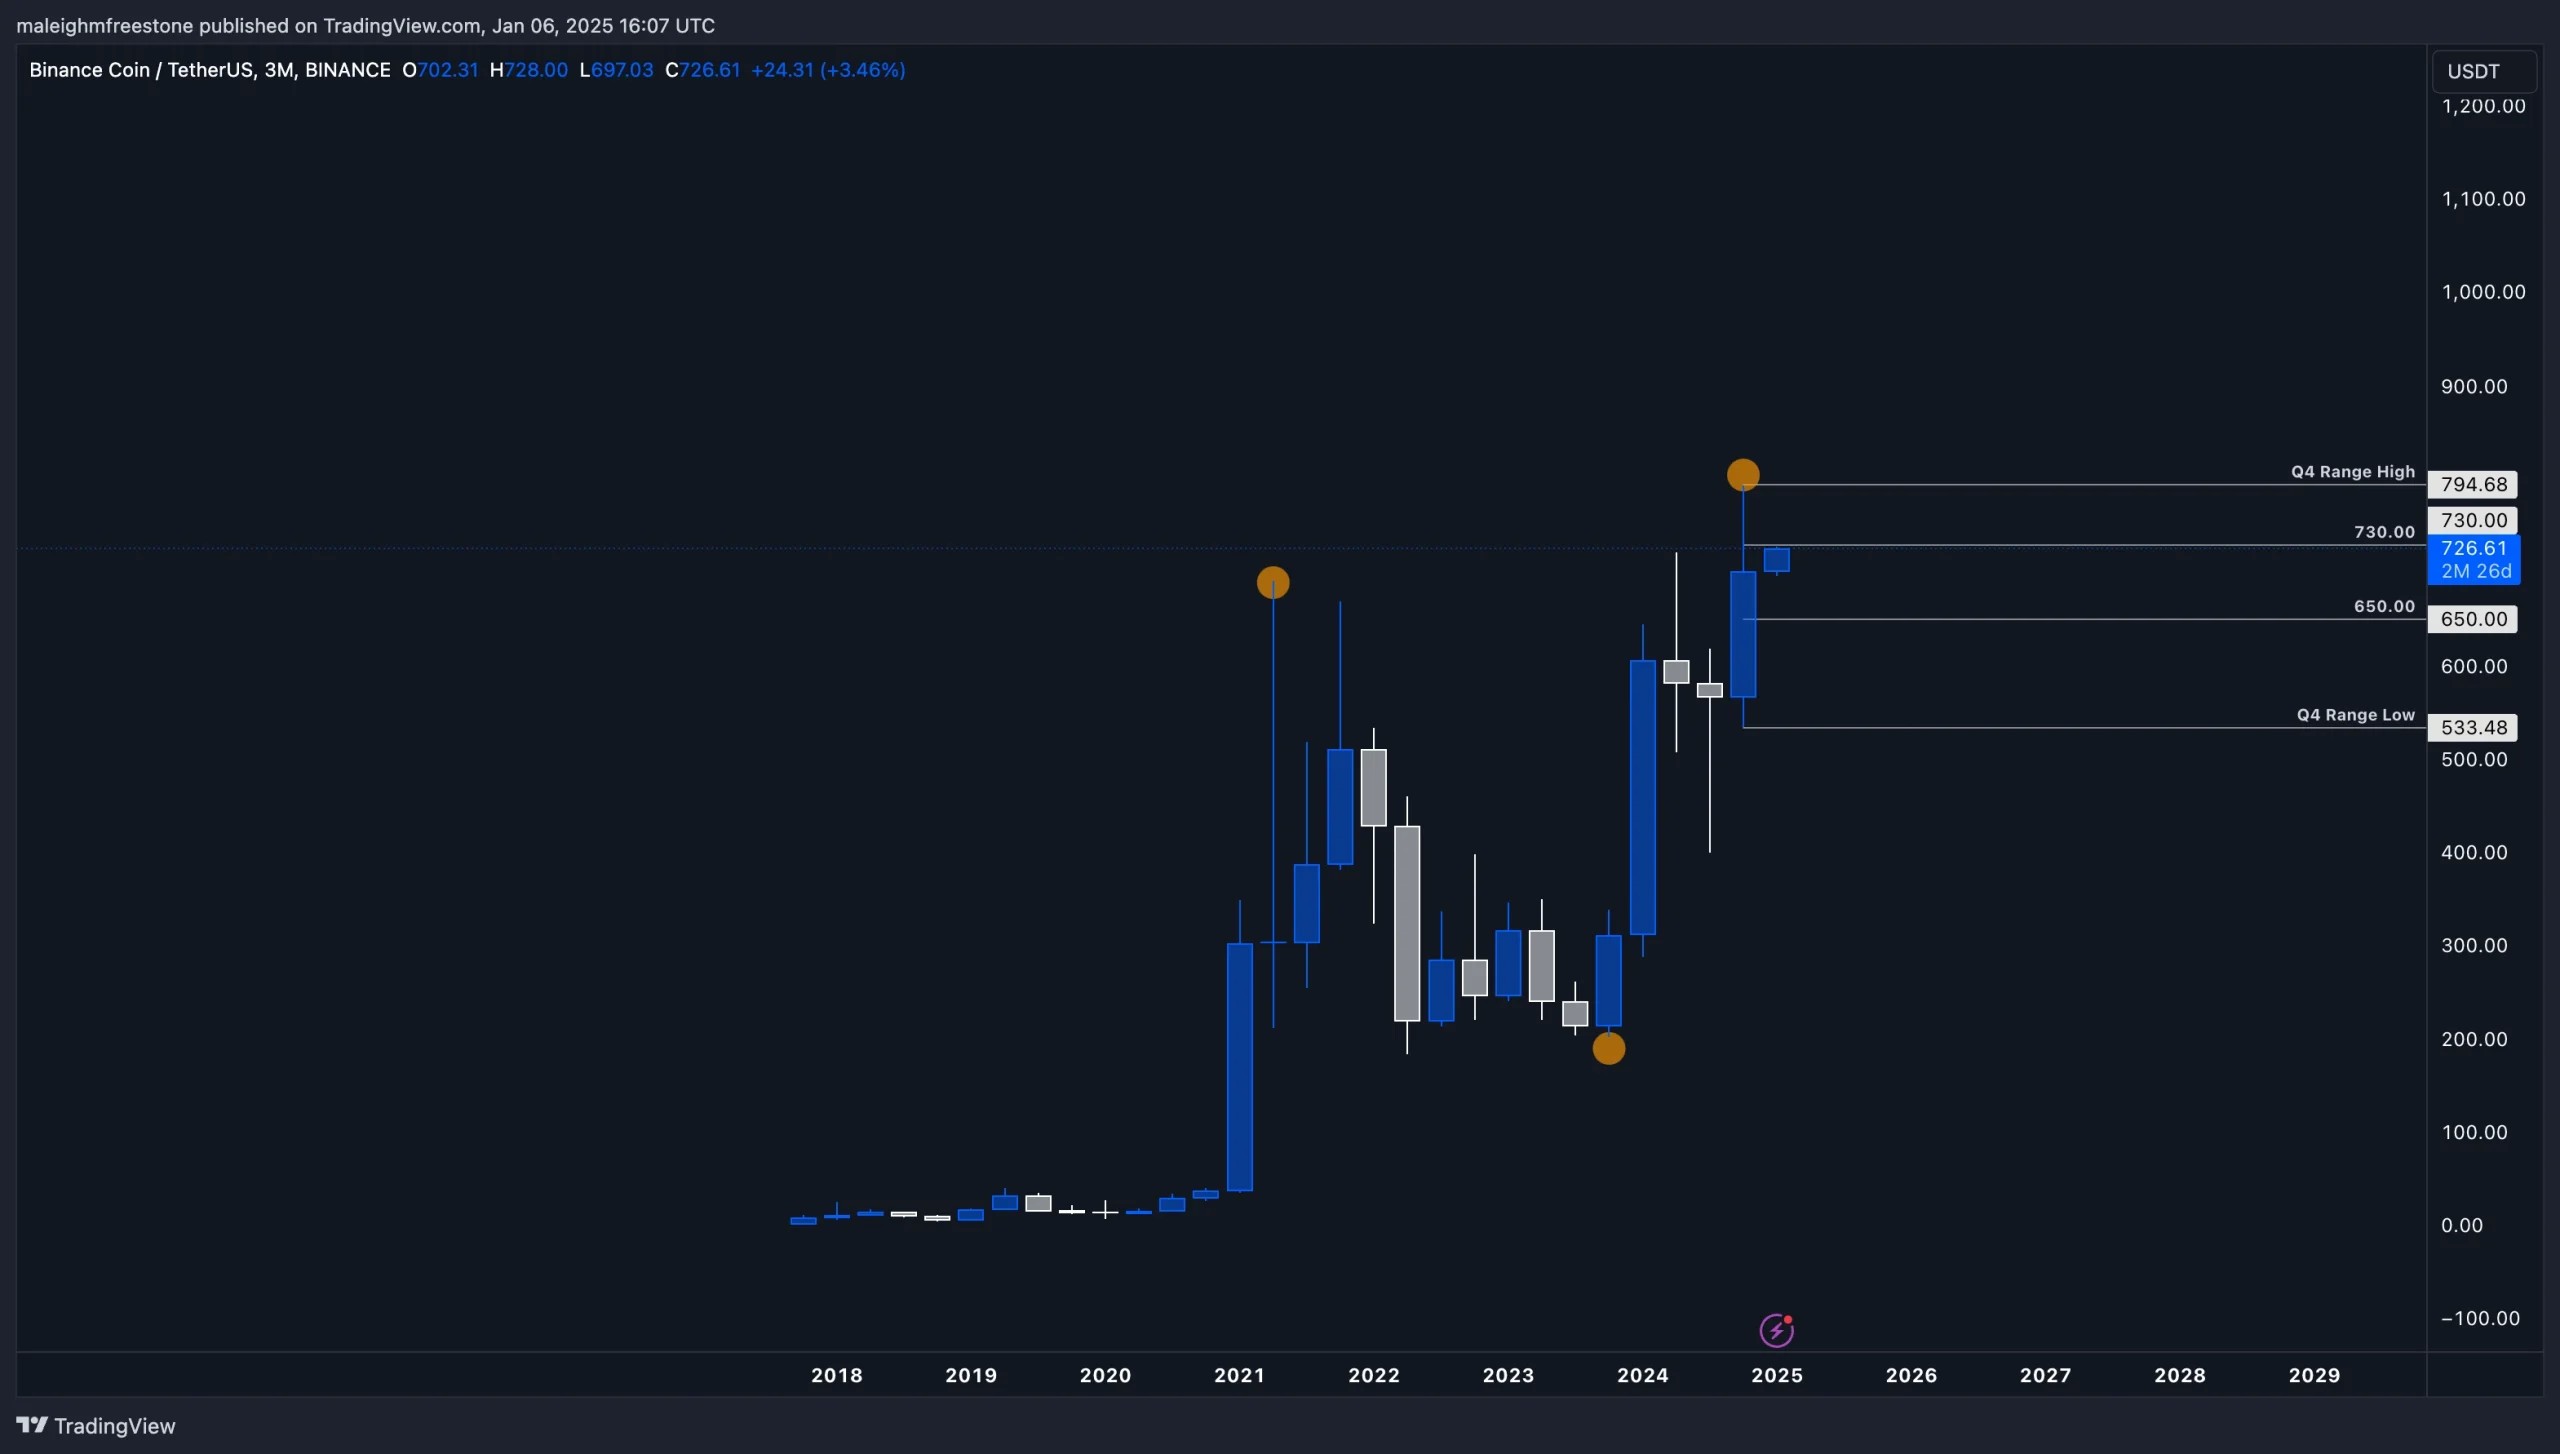
Zooming out, BNB’s chart remains incredibly strong and bullish:
  • April 2021 Markes the swing high
  • October 2023 marked a lower swing.
  • October 2024 set a new high swing, continuing the bullish structure.
This sets a solid precedent for further upside and reflects broader bullish sentiment in the cryptocurrency market. While the recent price action feels stuck within the Q4 range, the higher timeframe shows a well-structured chart that suggests continued strength.

3. BNBUSDT three-month chart with historical swing highs and lows, demonstrating bullish structure and Q4 range analysis.

Cryptonary’s take

BNB’s higher timeframe chart is one of the cleanest in the market right now, showcasing strength and resilience. In the short term, we’re stuck in a choppy Q4 range, but the levels are clear: $730 to the upside and $650 to the downside.

A breakout above $730 could bring new momentum to target the Q4 range high and all-time highs, while a pullback to $650 would provide a good opportunity to accumulate. Either way, BNB remains one of the standout charts in the space, reflecting a solid bullish structure heading into the new year.


SUI:

Market context

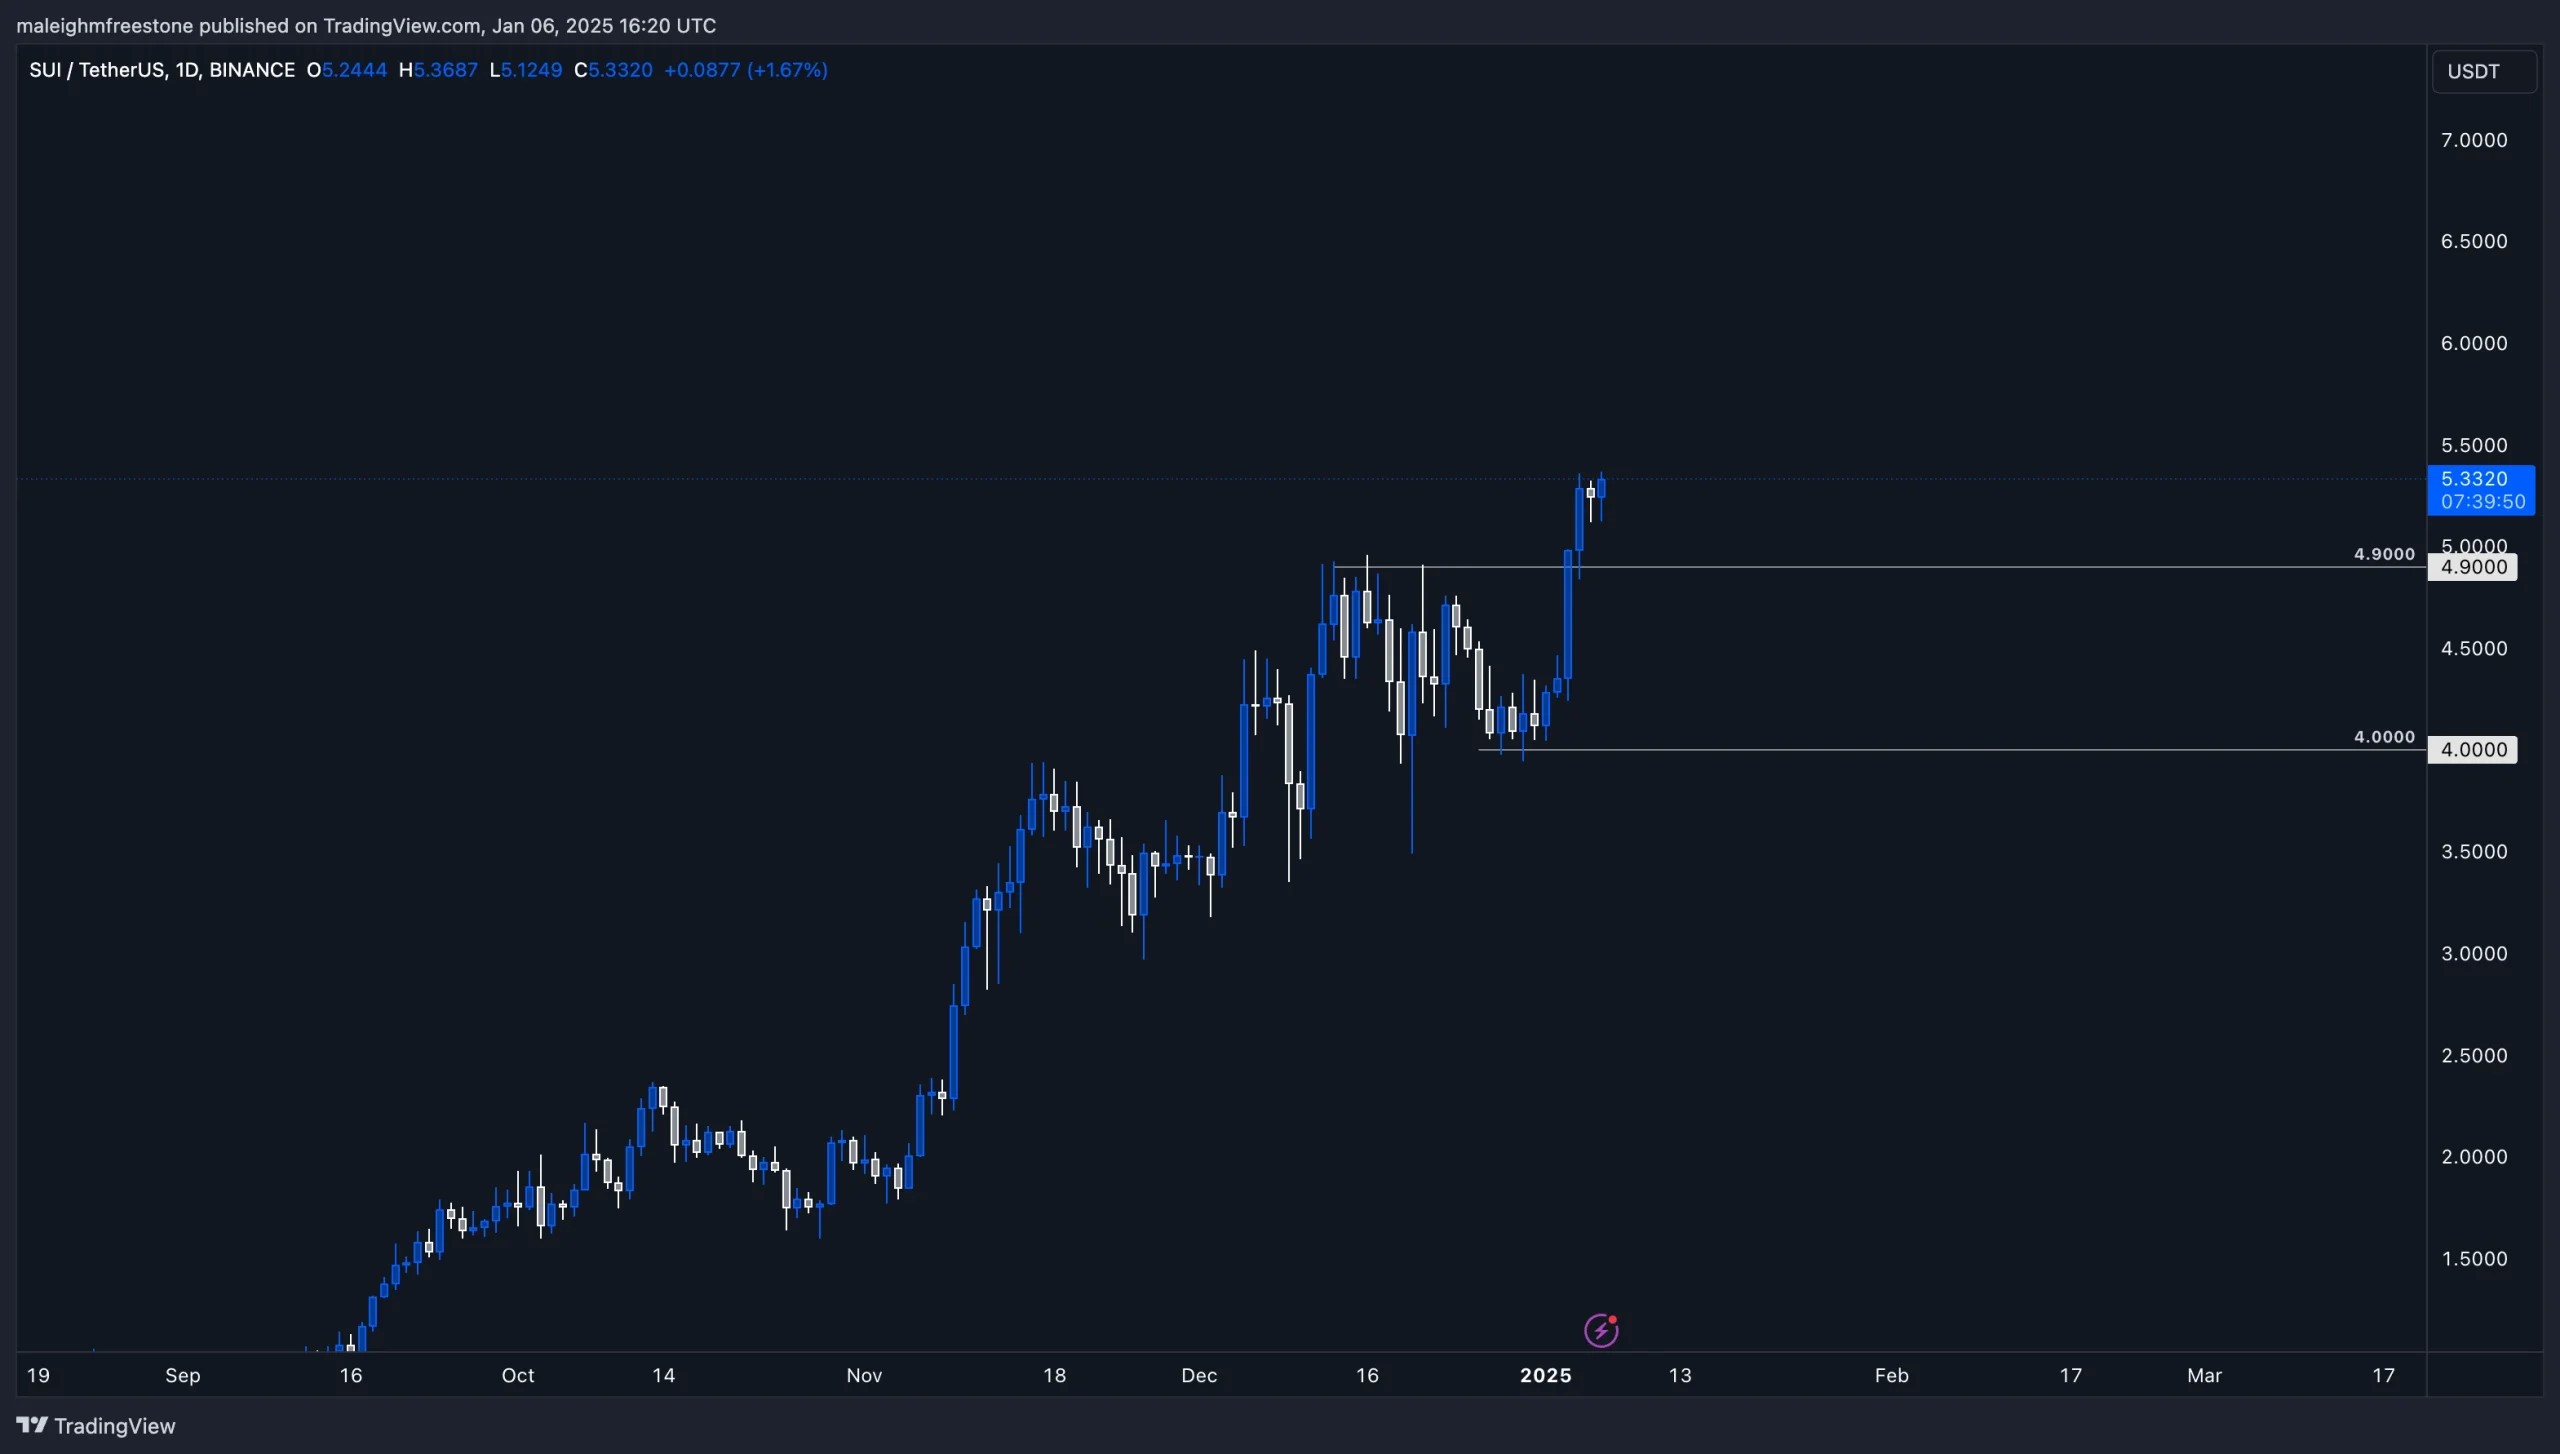
Since December 25th, SUI has established $4 as a key support level, showing strong respect and holding well during the recent price action. This level has acted as a clear pivot point, giving us a base to work with for further analysis.

SUI remains a standout performer this cycle, consistently showing resilience and strength regardless of broader market conditions. It has delivered exceptional returns and continues to hold significant mindshare within the market.

While we don’t hold SUI, and this is not an investment recommendation, it’s clear that SUI has been an incredible asset to date. Its position in the market cycle and consistent performance make it a project worth monitoring closely.

4. SUIUSDT daily chart showcasing 4 key support and current price action near 5.33, indicating recent bullish momentum.

Price action

Support:

  • $4 has been tested and respected multiple times since late December, solidifying it as a key support level.

Resistance:

  • Price action remains undecided in the mid-term, with further upside contingent on momentum returning to the market.
  • SUI’s performance continues to outpace many assets, and its broader structure remains bullish, even with a slight pullback.

Playbook

DCA opportunity

  • For those holding SUI or considering entries, the $4 level provides a logical area to accumulate based on its historical price action and positioning within the market cycle.

Watch for breakouts

  • Keep an eye on how SUI reacts at resistance zones. If buying momentum builds again, it could set up for another leg higher.

Cryptonary’s take

SUI has been one of the most impressive assets this cycle, showing consistent strength and resilience. While we are not holders, its performance speaks for itself.

The $4 support zone has proven to be solid, and the overall structure of the asset suggests continued bullish potential. For those holding SUI, this is a project worth watching closely, especially at current levels, as it aligns well with broader market conditions and its cycle position.


Get started for free

Create your free account or log in to read the full article.

​

Germany

By signing up, you agree to our Terms & Conditions
Recommended from Cryptonary
Market Update: Macro Risks Signal Further Downside
PRO
Market Updates
Market Update: Macro Risks Signal F...Earlier in the week, we had a lot of questions about whether we still see the $50k-$60k level being ...
11 min read
Mar 27, 2026
BTC, ETH and More: Crypto Structure Diverges, Bitcoin Remains Fragile
PRO
Market Direction
BTC, ETH and More: Crypto Structure...Over the past week, downside played out where expected, but follow-through has been inconsistent, wi...
11 min read
Mar 24, 2026
Market Update: Risk Assets Rebound Amid Tightening Conditions
PRO
Market Updates
Market Update: Risk Assets Rebound ...The market just gave us a perfect example of how fragile this environment is. Escalation over the we...
8 min read
Mar 23, 2026
Market Update: Trump Threats Escalate, Risk Assets Dive
PRO
Market Updates
Market Update: Trump Threats Escala...After a week of escalating rhetoric and no clear path to de-escalation, the Middle East conflict has...
7 min read
Apr 2, 2026
BTC, ETH and More: Short-Term Upside Liquidity in Play
PRO
Market Direction
BTC, ETH and More: Short-Term Upsid...Markets are pausing at key levels, and the next move is starting to take shape. After completing the...
13 min read
Mar 31, 2026
Market Update: Fed in a Bind & Bitcoin at a Breaking Point
PRO
Market Updates
Market Update: Fed in a Bind & Bitc...Markets are turning fragile as escalating Middle East tensions drive a clear risk-off shift, tighten...
8 min read
Mar 30, 2026
Market Update: Macro Risks Signal Further Downside
PRO
Market Updates
Market Update: Macro Risks Signal F...Earlier in the week, we had a lot of questions about whether we still see the $50k-$60k level being ...
11 min read
Mar 27, 2026
BTC, ETH and More: Crypto Structure Diverges, Bitcoin Remains Fragile
PRO
Market Direction
BTC, ETH and More: Crypto Structure...Over the past week, downside played out where expected, but follow-through has been inconsistent, wi...
11 min read
Mar 24, 2026
Market Update: Risk Assets Rebound Amid Tightening Conditions
PRO
Market Updates
Market Update: Risk Assets Rebound ...The market just gave us a perfect example of how fragile this environment is. Escalation over the we...
8 min read
Mar 23, 2026
Research
Top PicksDeep DivesPassive IncomeAirdrop ReportsMemecoins
Analysis
Market UpdatesMarket DirectionMarket PulseLivestreams
Tools
Market DirectionAssets & PicksAirdropsPortfolio Tracker
Cryptonary
Affiliate programEducationPrivacy PolicyTerms & ConditionsContact UsWrite for usTeam
Stay connected
Disclaimer: The information provided on this website is for educational and informational purposes only and does not constitute financial, investment, legal, or tax advice. Cryptonary is not a licensed financial advisor. All content is shared without any guarantee of accuracy or completeness. You are solely responsible for your investment decisions. Always do your own research and consult with a licensed professional before making financial choices. Past performance is not indicative of future results.

×
popupimage
Our Latest Utility Token Research ReportPreviously locked for Pro members, now available to read in full.
  • tickThe utility token we're tracking closely
  • tickWhy we believe it's still early in the cycle
  • tickWhat we're watching to confirm a structural shift
​
Germany

No spam. No hype. Just the research.