Save 23% ($351) & Get a Free 1-1 Call with our Team ⏰ : 0d 2h 59m 44s
BNB, TON, and SUI present key trading opportunities
BNB continues to trade between $500 and $622, offering traders solid opportunities. Meanwhile, TON's accumulation at $4.750 hints at a potential upside, while SUI's strong performance eyes a retest of $2. Let's explore the setup.
Disclaimer: This is not financial or investment advice. You are responsible for any capital-related decisions you make, and only you are accountable for the results.
BNB:
Market context
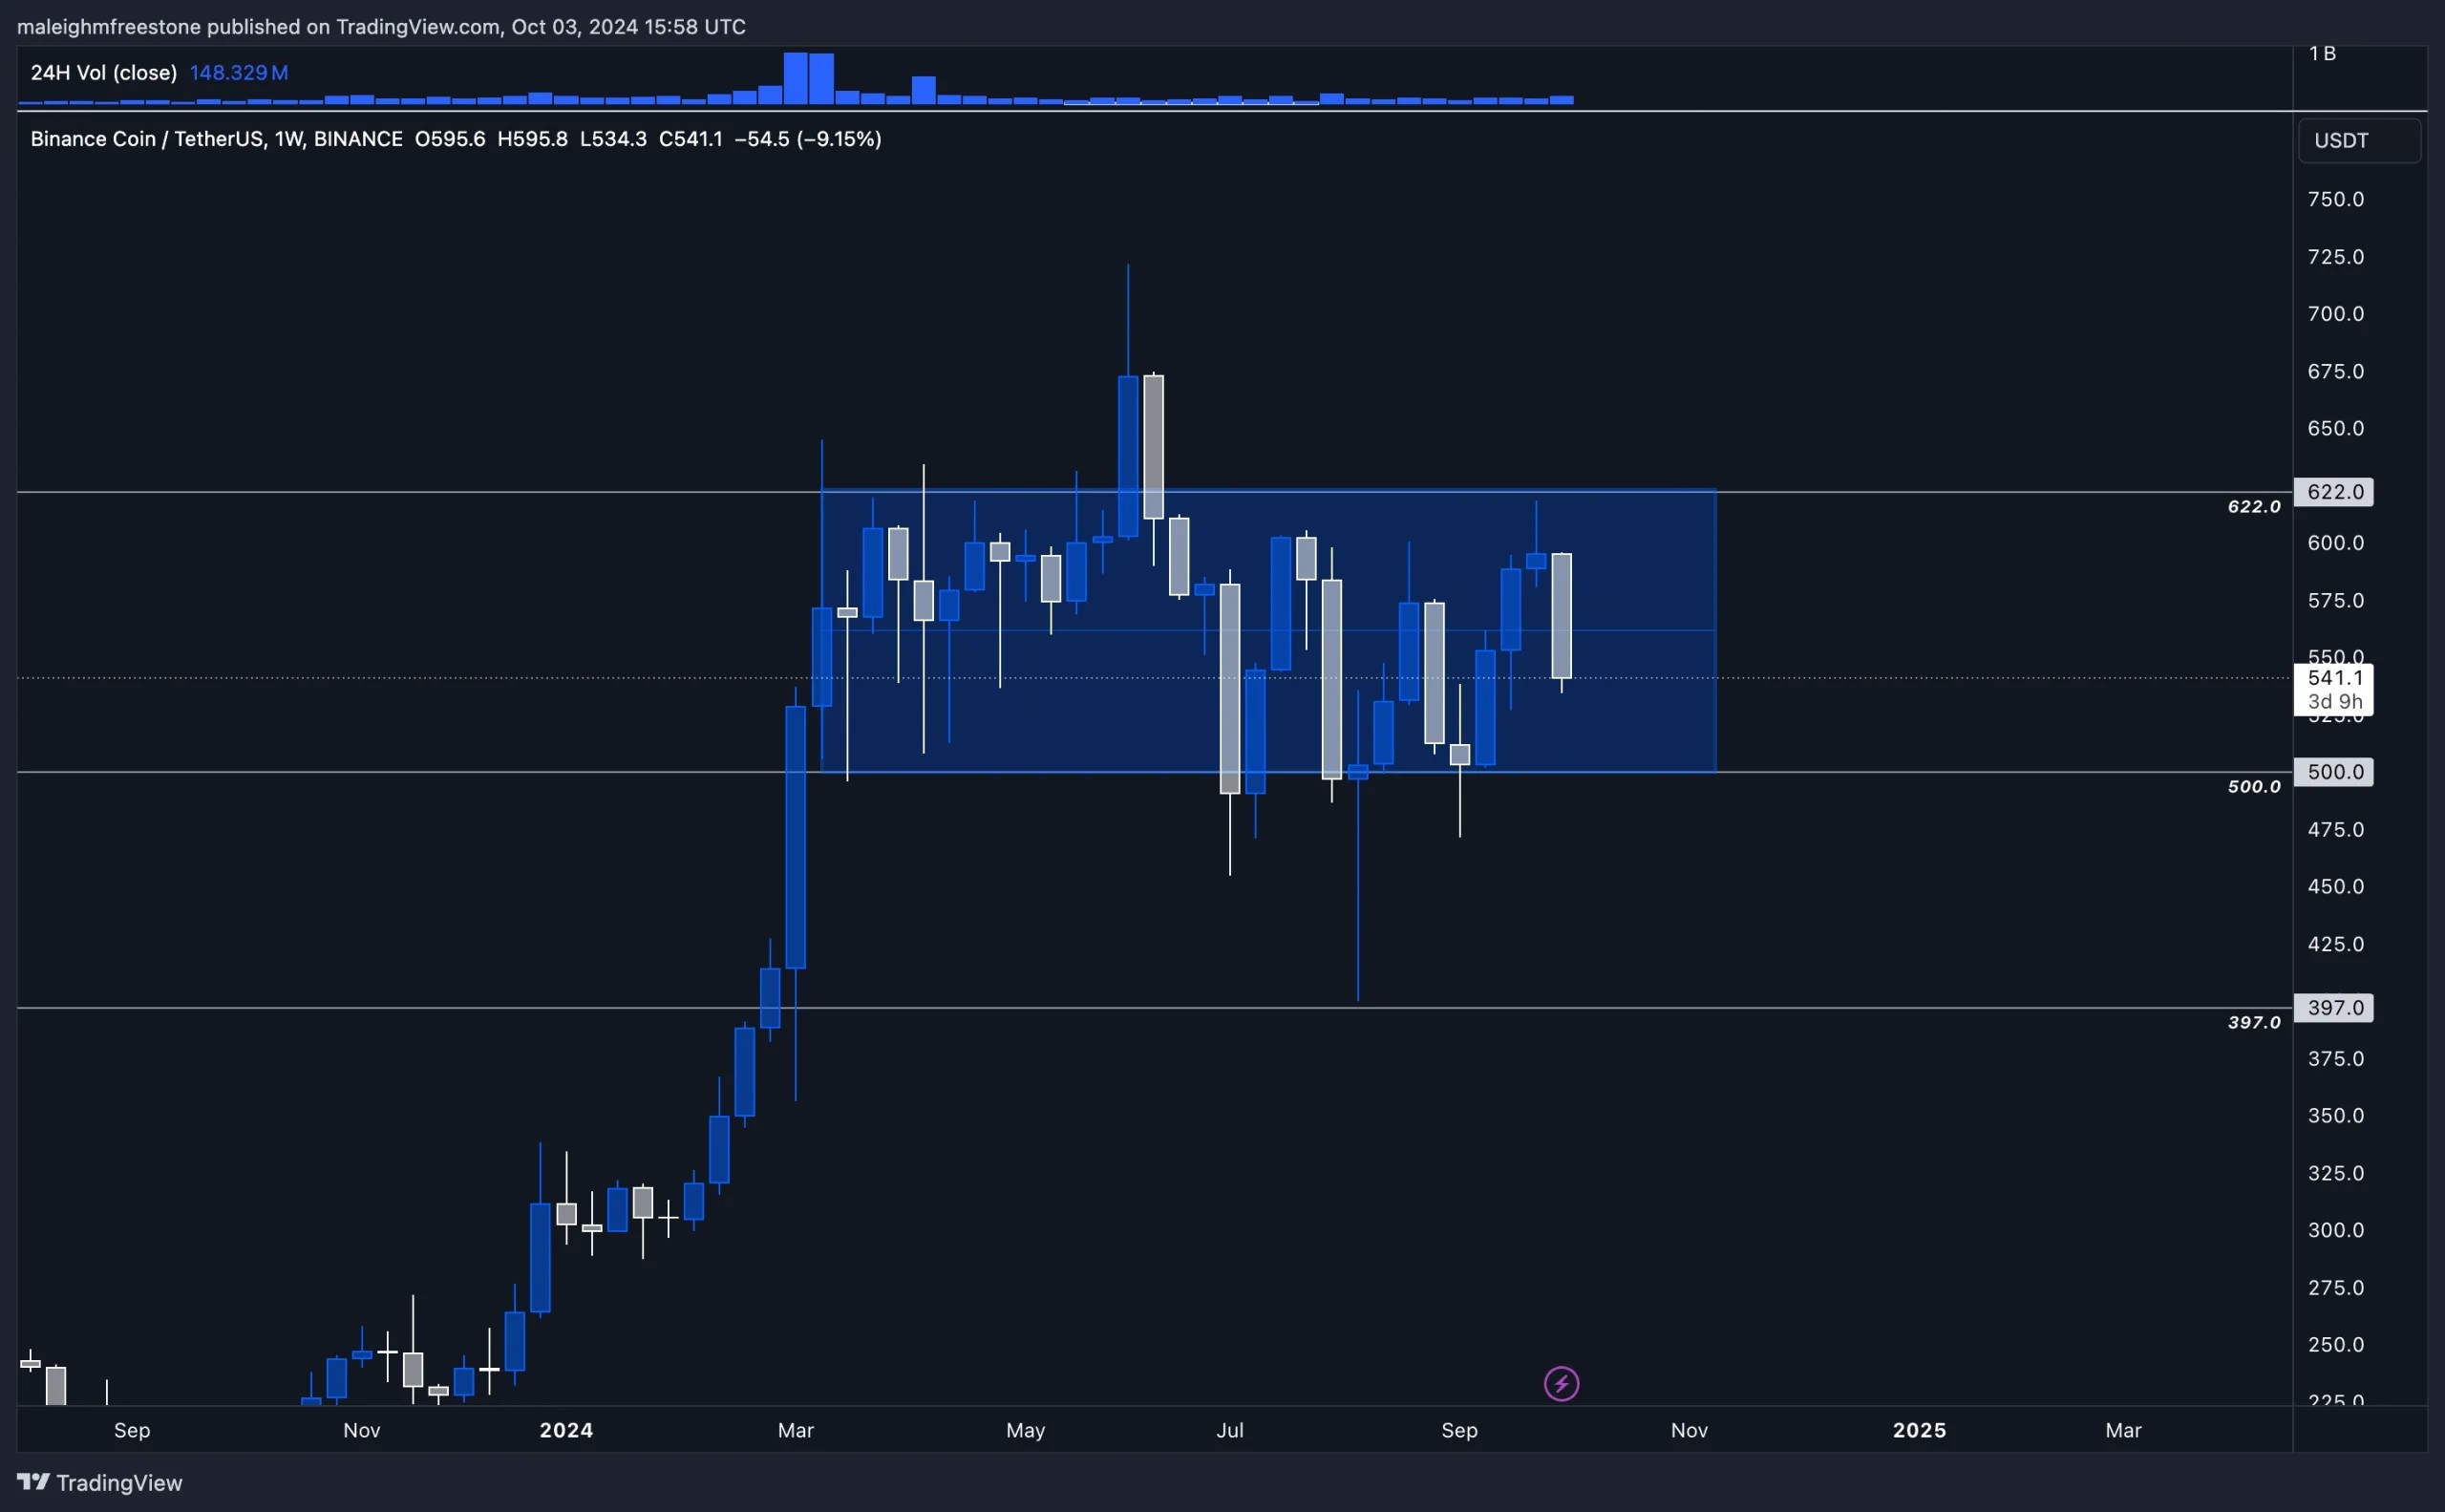
When zoomed out on the monthly timeframe, BNB appears to be trading within a massive range, with the highs around $622 and the lows near $200. This large range has held over time, and on the weekly timeframe, we can see another range forming within that broader context.What stands out is that BNB is trading near its all-time highs, sitting in the upper part of this range, much like Bitcoin or Solana. However, unlike Solana, BNB has managed to trade near its all-time highs of $622 consistently since December 2023.
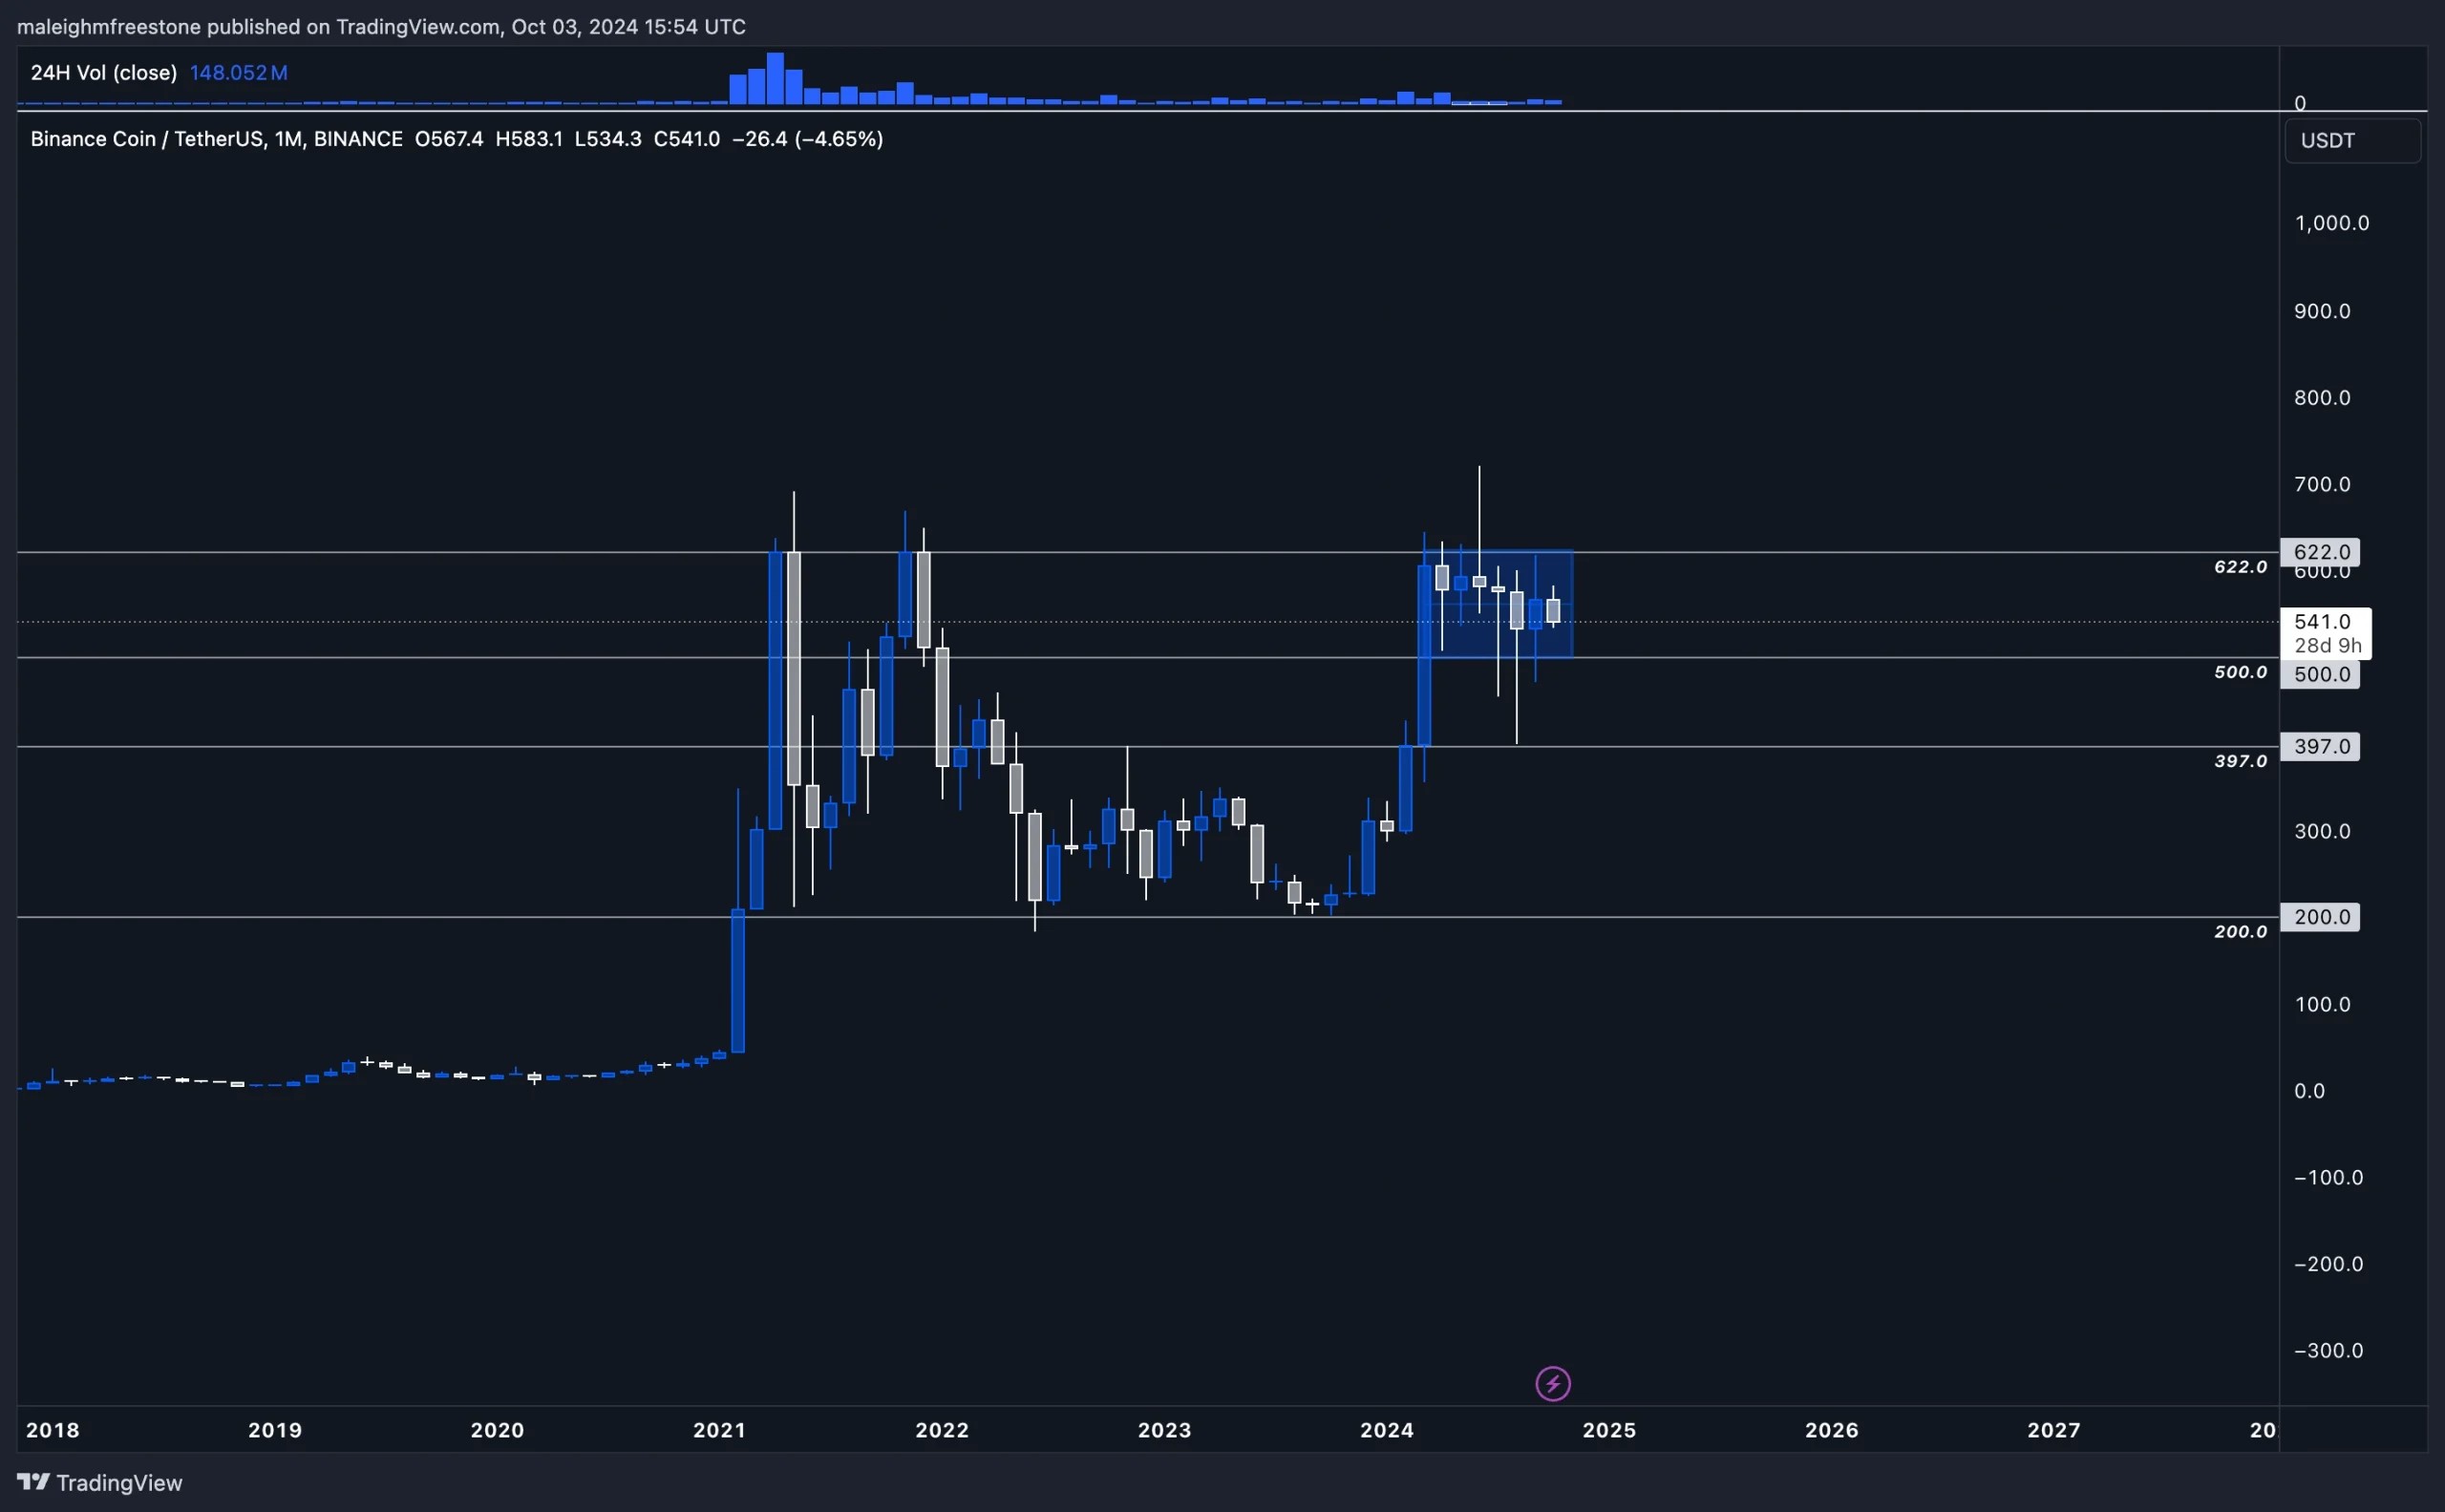
On August 5th, BNB briefly went down to around the $400 region but has largely maintained a range between $500 and $622. This highlights strong range-bound behaviour. With recent geopolitical sell-offs, BNB reached that $622 level but swung back within the range as it failed to break out.
Market mechanics
Funding rates
Funding rates for BNB are relatively flat with no significant bias to either side, although there was a slight spike on September 24th, that still wouldn't suggest there was to much bias to longs either. Funding has been flat for awhile which could speak to this range bound price action.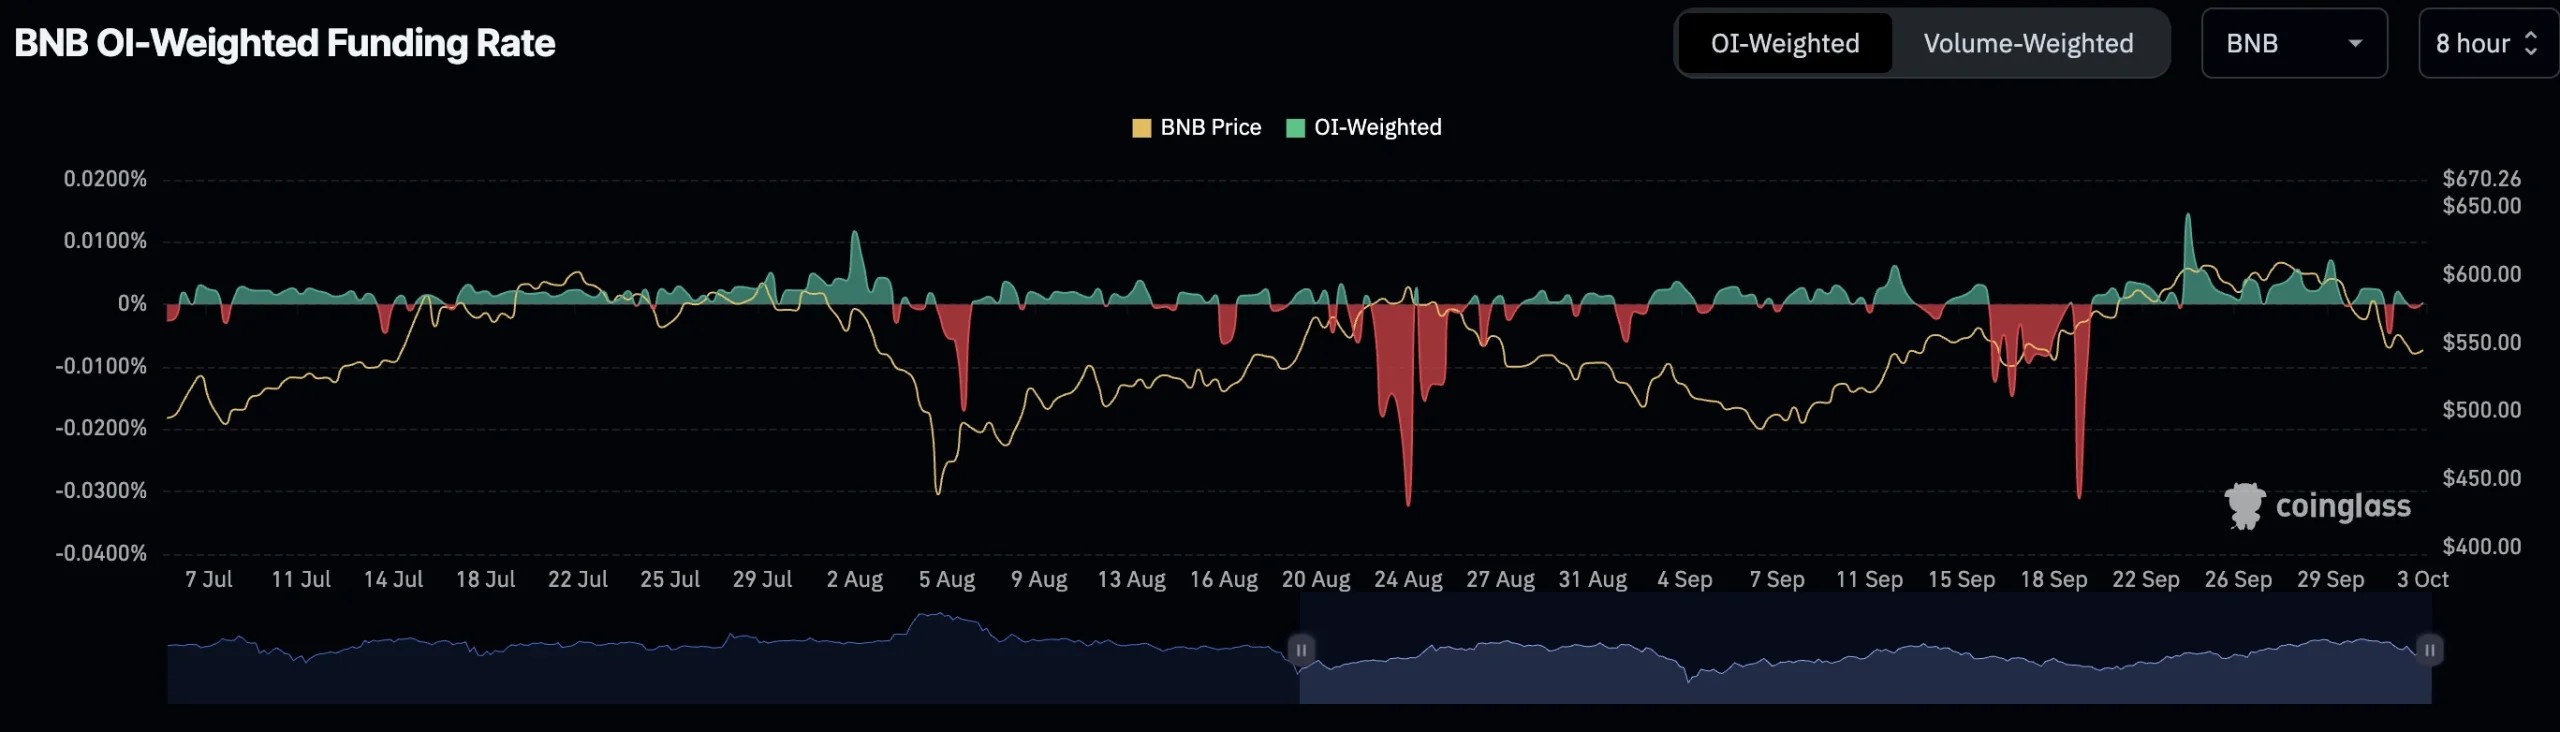
Open interest
Open interest has dropped from 658M to around 513M over the course of 10 days. This isn't a drastic drop, but it does suggest that some leverage has left the system, which could offer less resistance for price movement within the range.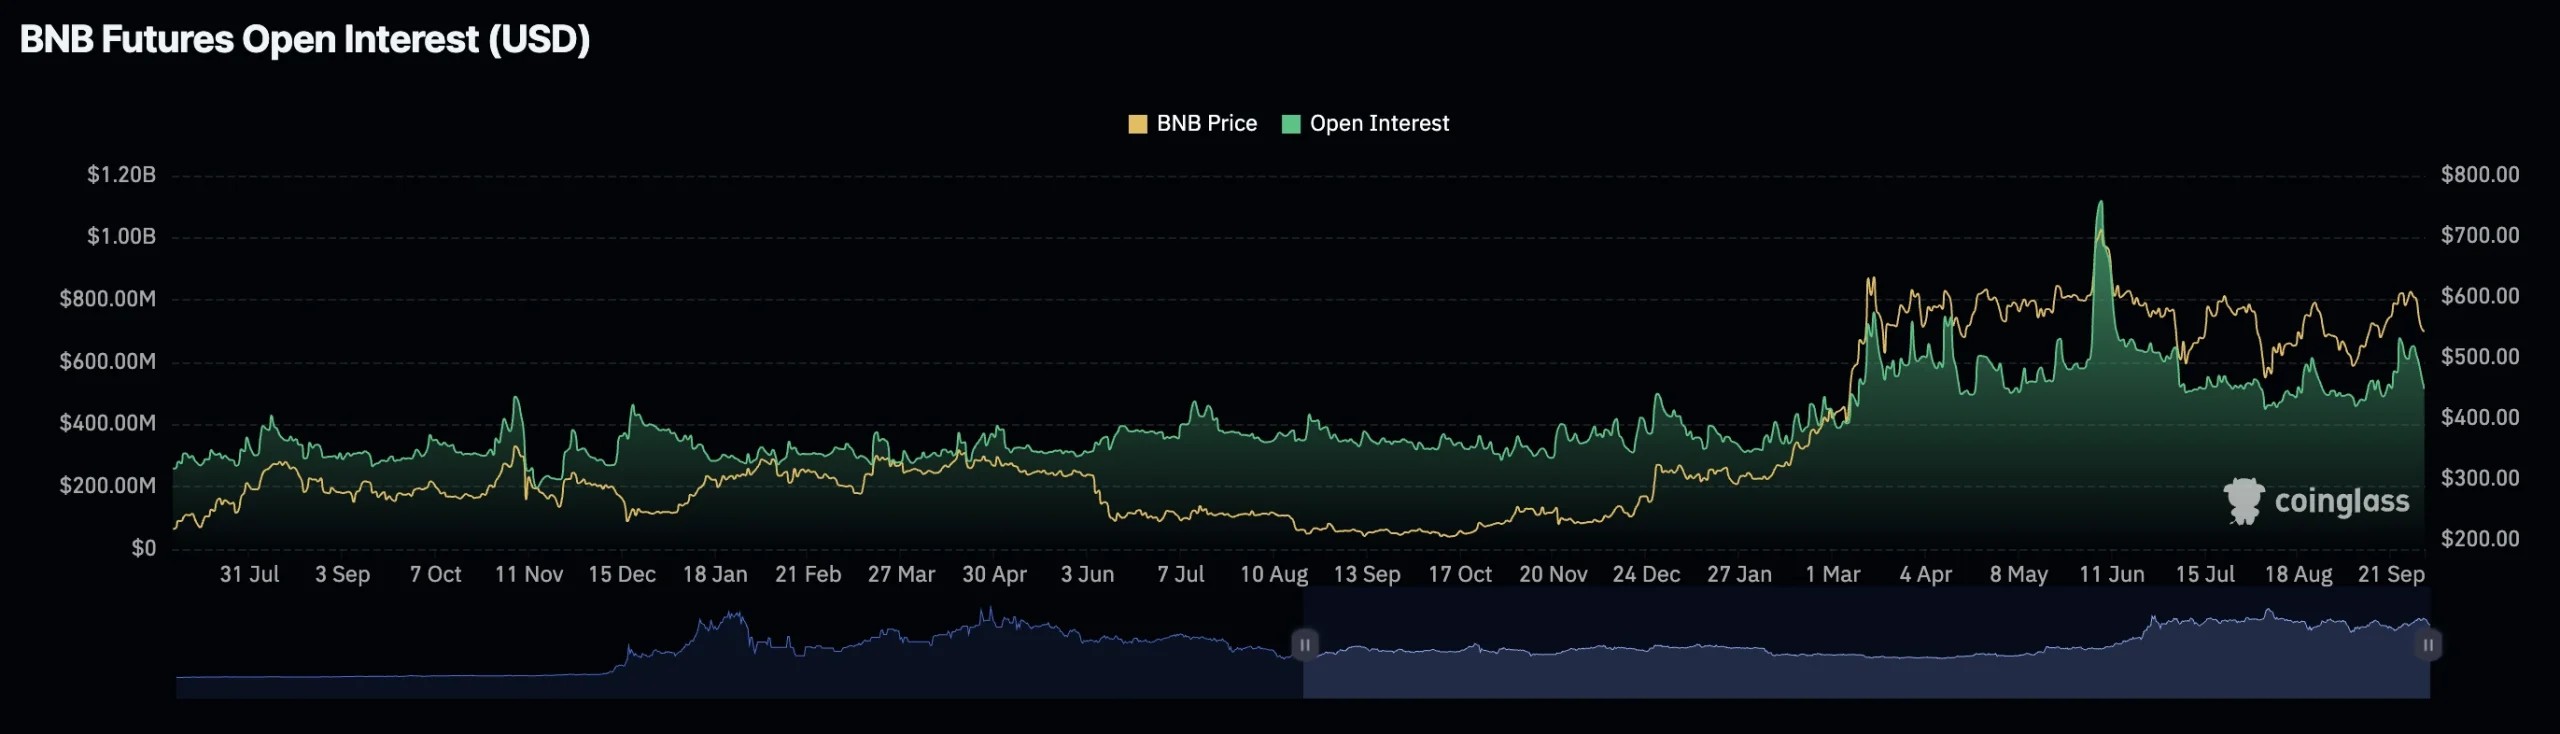
Liquidation levels
Significant liquidation levels sit around the $620-$622 range, which reinforces the upper boundary of our range and the likelihood of price action returning to this level. The heatmap shows heavy buildup around $622, making this a key resistance level.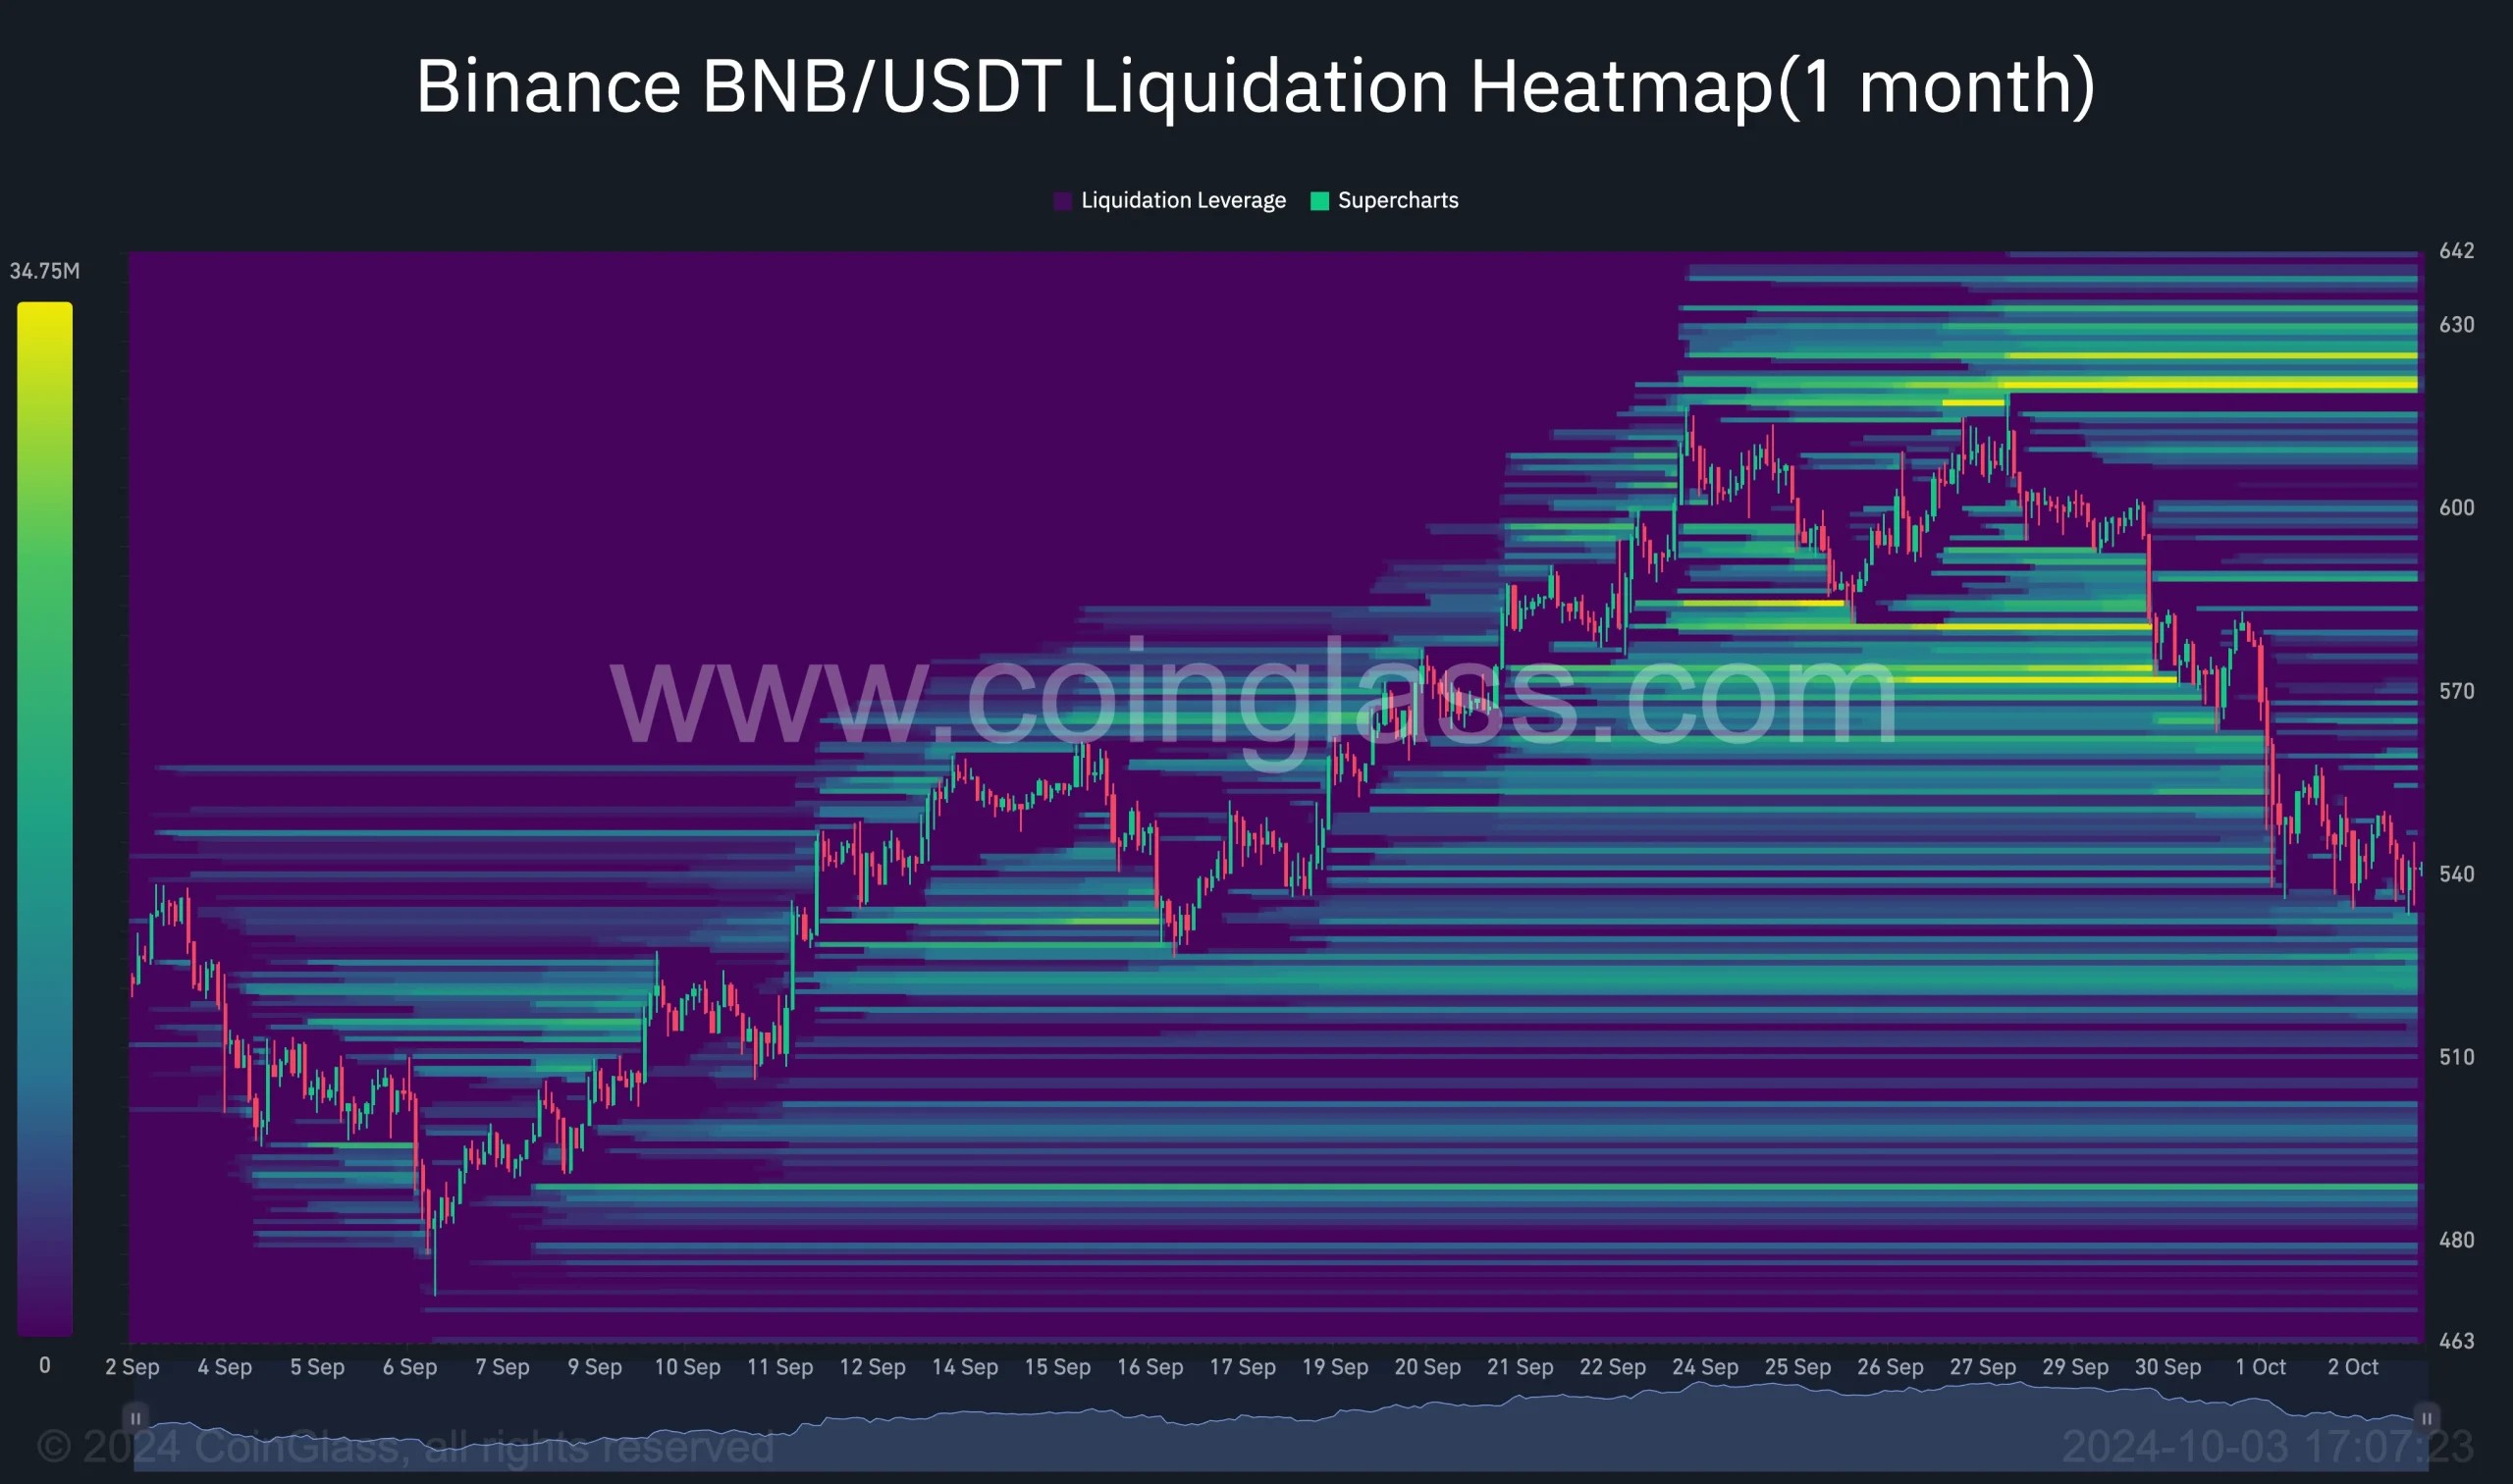
Risk management strategy ( If you are a holder and looking to take advantage )
- Spot Accumulation: Accumulate around $500, the range low, with a stop just below $490 in case the price breaks down further.
- Aim: Aim for a swing up to $622, giving you a healthy risk-to-reward setup.
- Leverage: If leveraging, scale in around $500 with a tight stop just below $490. This would allow you to ride the price back to the top of the range while managing risk effectively.
Cryptonary's take
BNB remains a strong asset this cycle, holding up well and consistently trading near its all-time highs. The range between $500 and $622 has been reliable, making accumulation at the lower end of this range a favourable strategy for both spot and leveraged traders. With heavy liquidation levels at $622, it's likely that we'll see this level tested again, especially as BNB has continuously respected this range over the past months.BNB stands out as one of the top performers within its cycle, and this range-bound opportunity offers a clear, defined play for traders. We don't have a financial interest in this asset. This is an analysis purely for educational purposes.
TON:
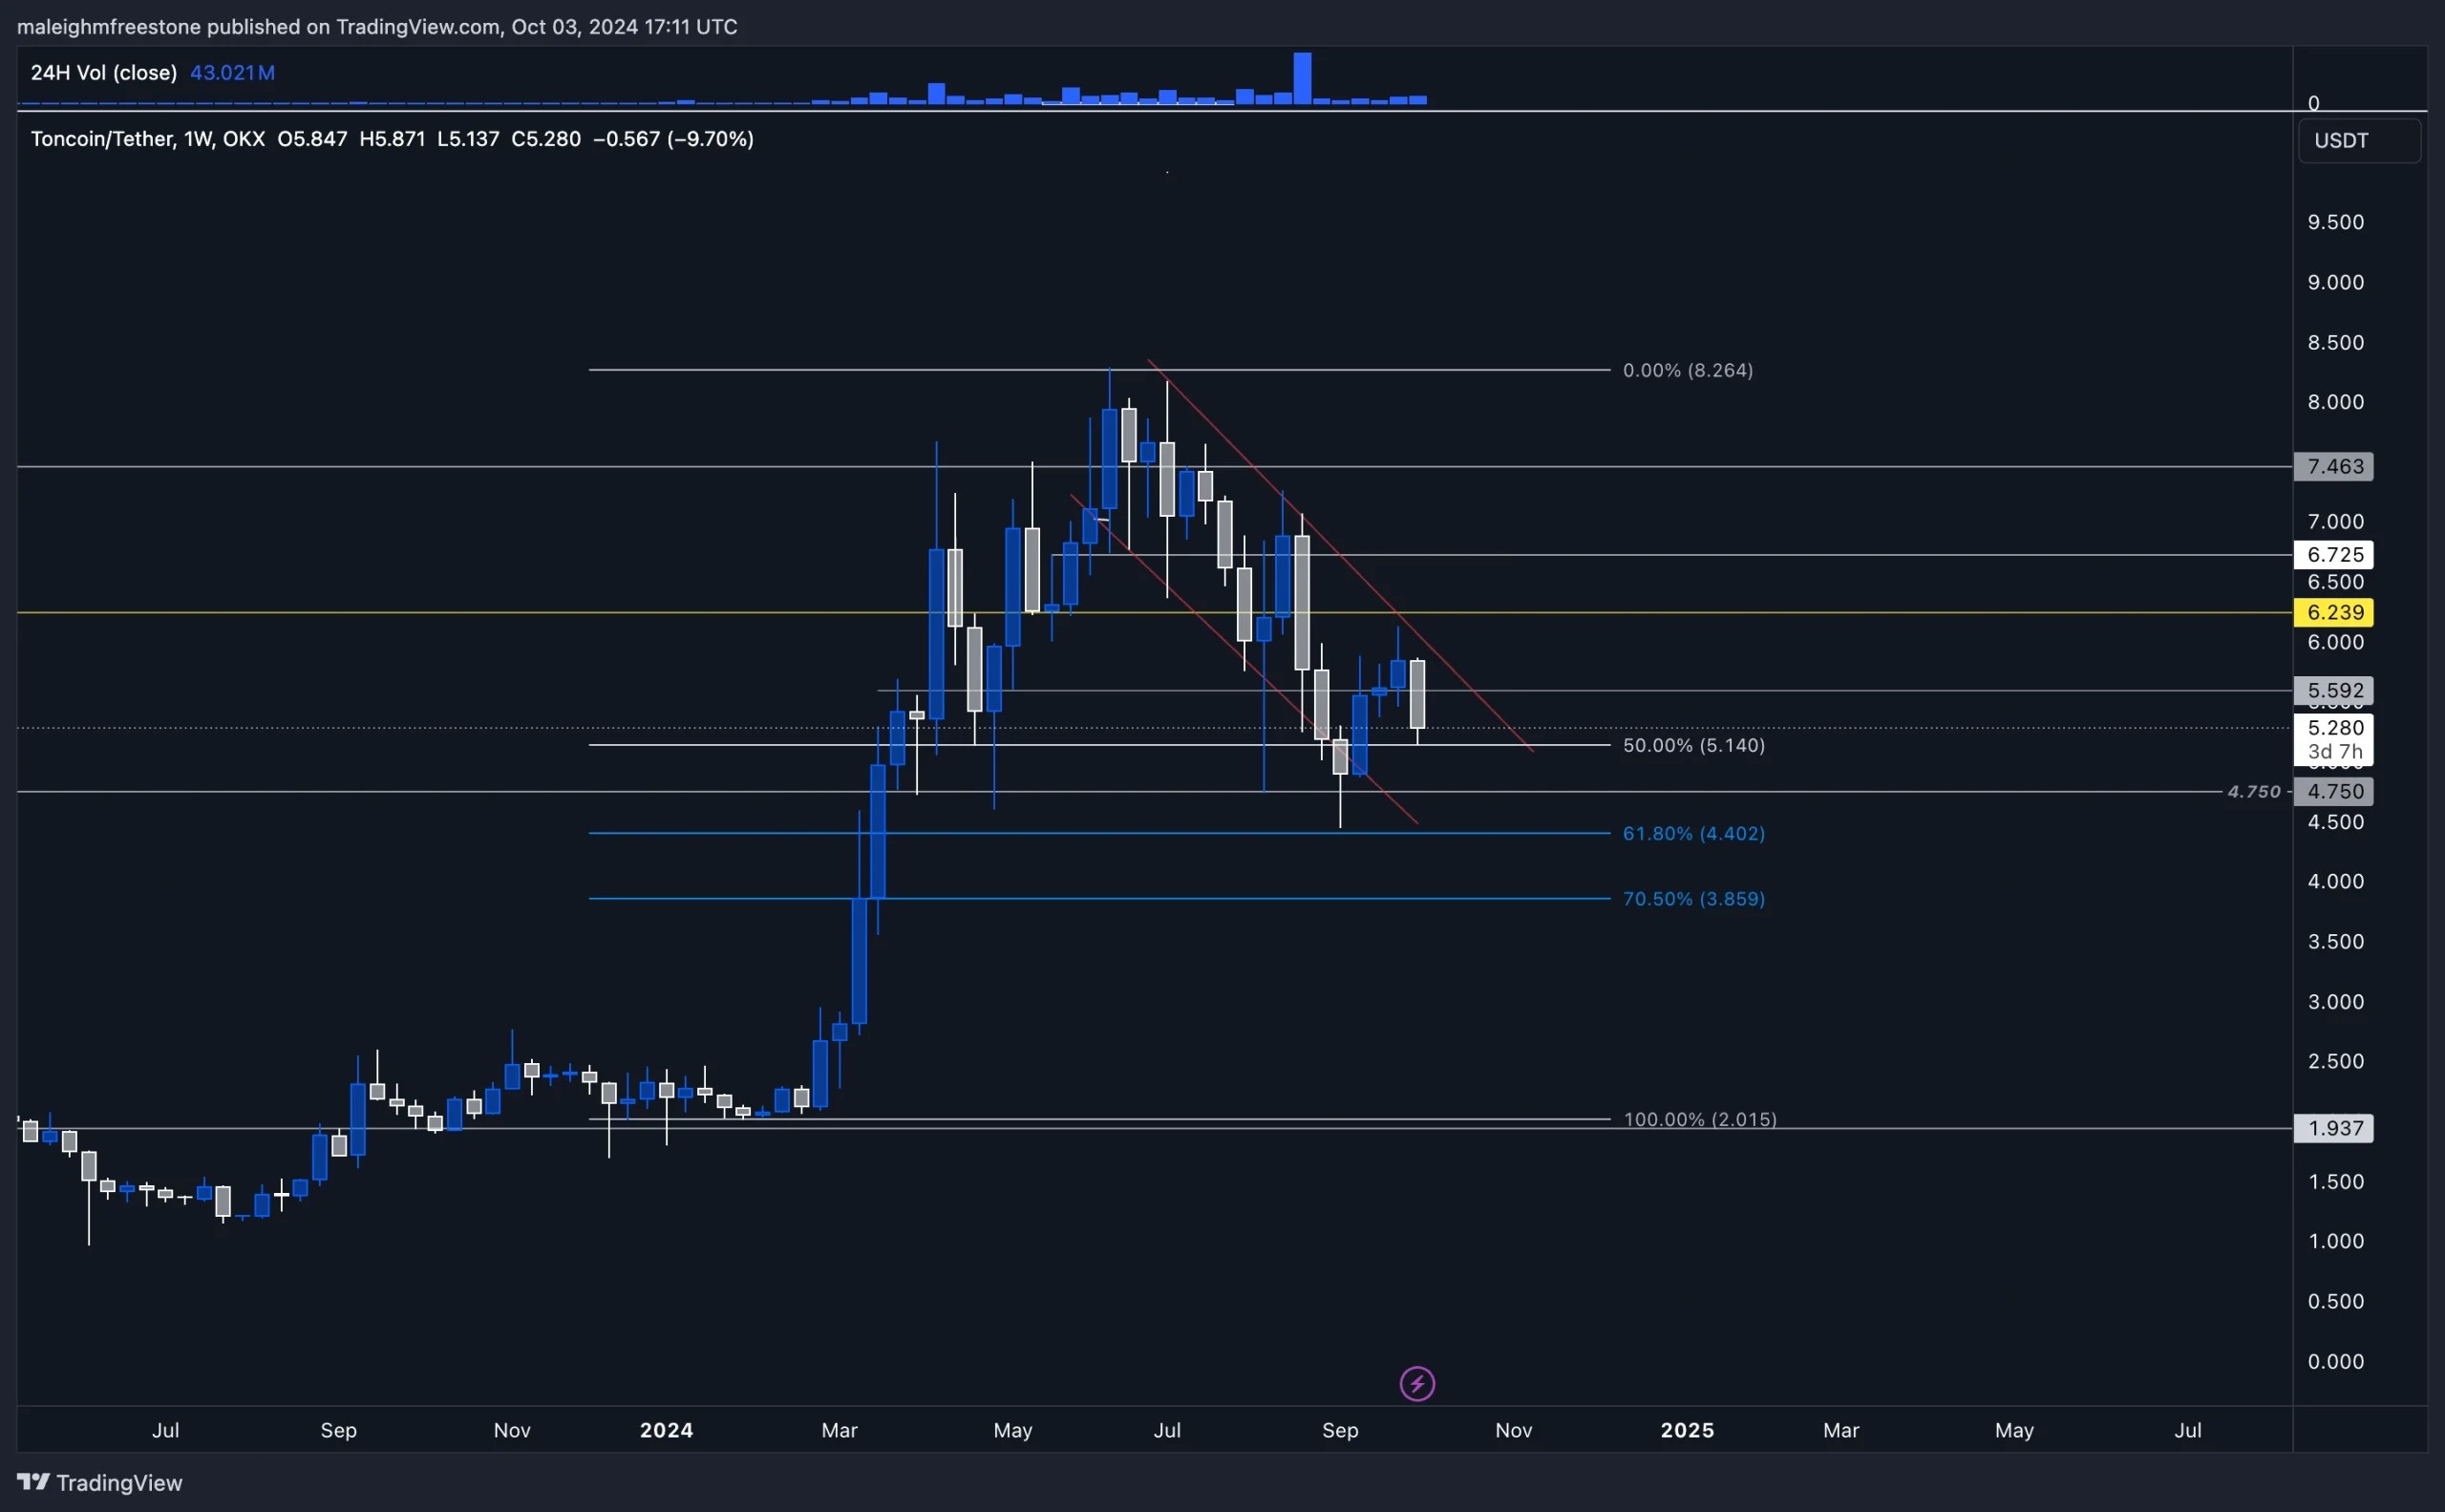
Market context TON has been shaping up interestingly, especially when focusing purely on the charts. The asset experienced a significant expansion of 300% to the upside, starting in mid-February and topping out around June. The price rallied from the $2 mark to a peak at $8, marking a huge expansion in a relatively short period.During the summer, when we last analyzed it, TON had retraced into deeper pullback territory, now trading back down into the $4.750 region, a level that aligns enough with a 61.8% Fibonacci retracement. This Fibonacci level was tested during the week of September 2nd, with the asset wicking into this key price region. That area, which is around $4.750, slightly below the 50% retracement, has been well respected and remains a key demand zone.
Current playbook
- The $4.750 level has been well-defended and is an ideal level for accumulation, especially given the price action we've seen since its retracement from $8.
- The deeper pullback into this demand zone aligns with the 61.8% Fibonacci retracement, suggesting that TON is in a bit of an accumulation phase.
Short-term trend
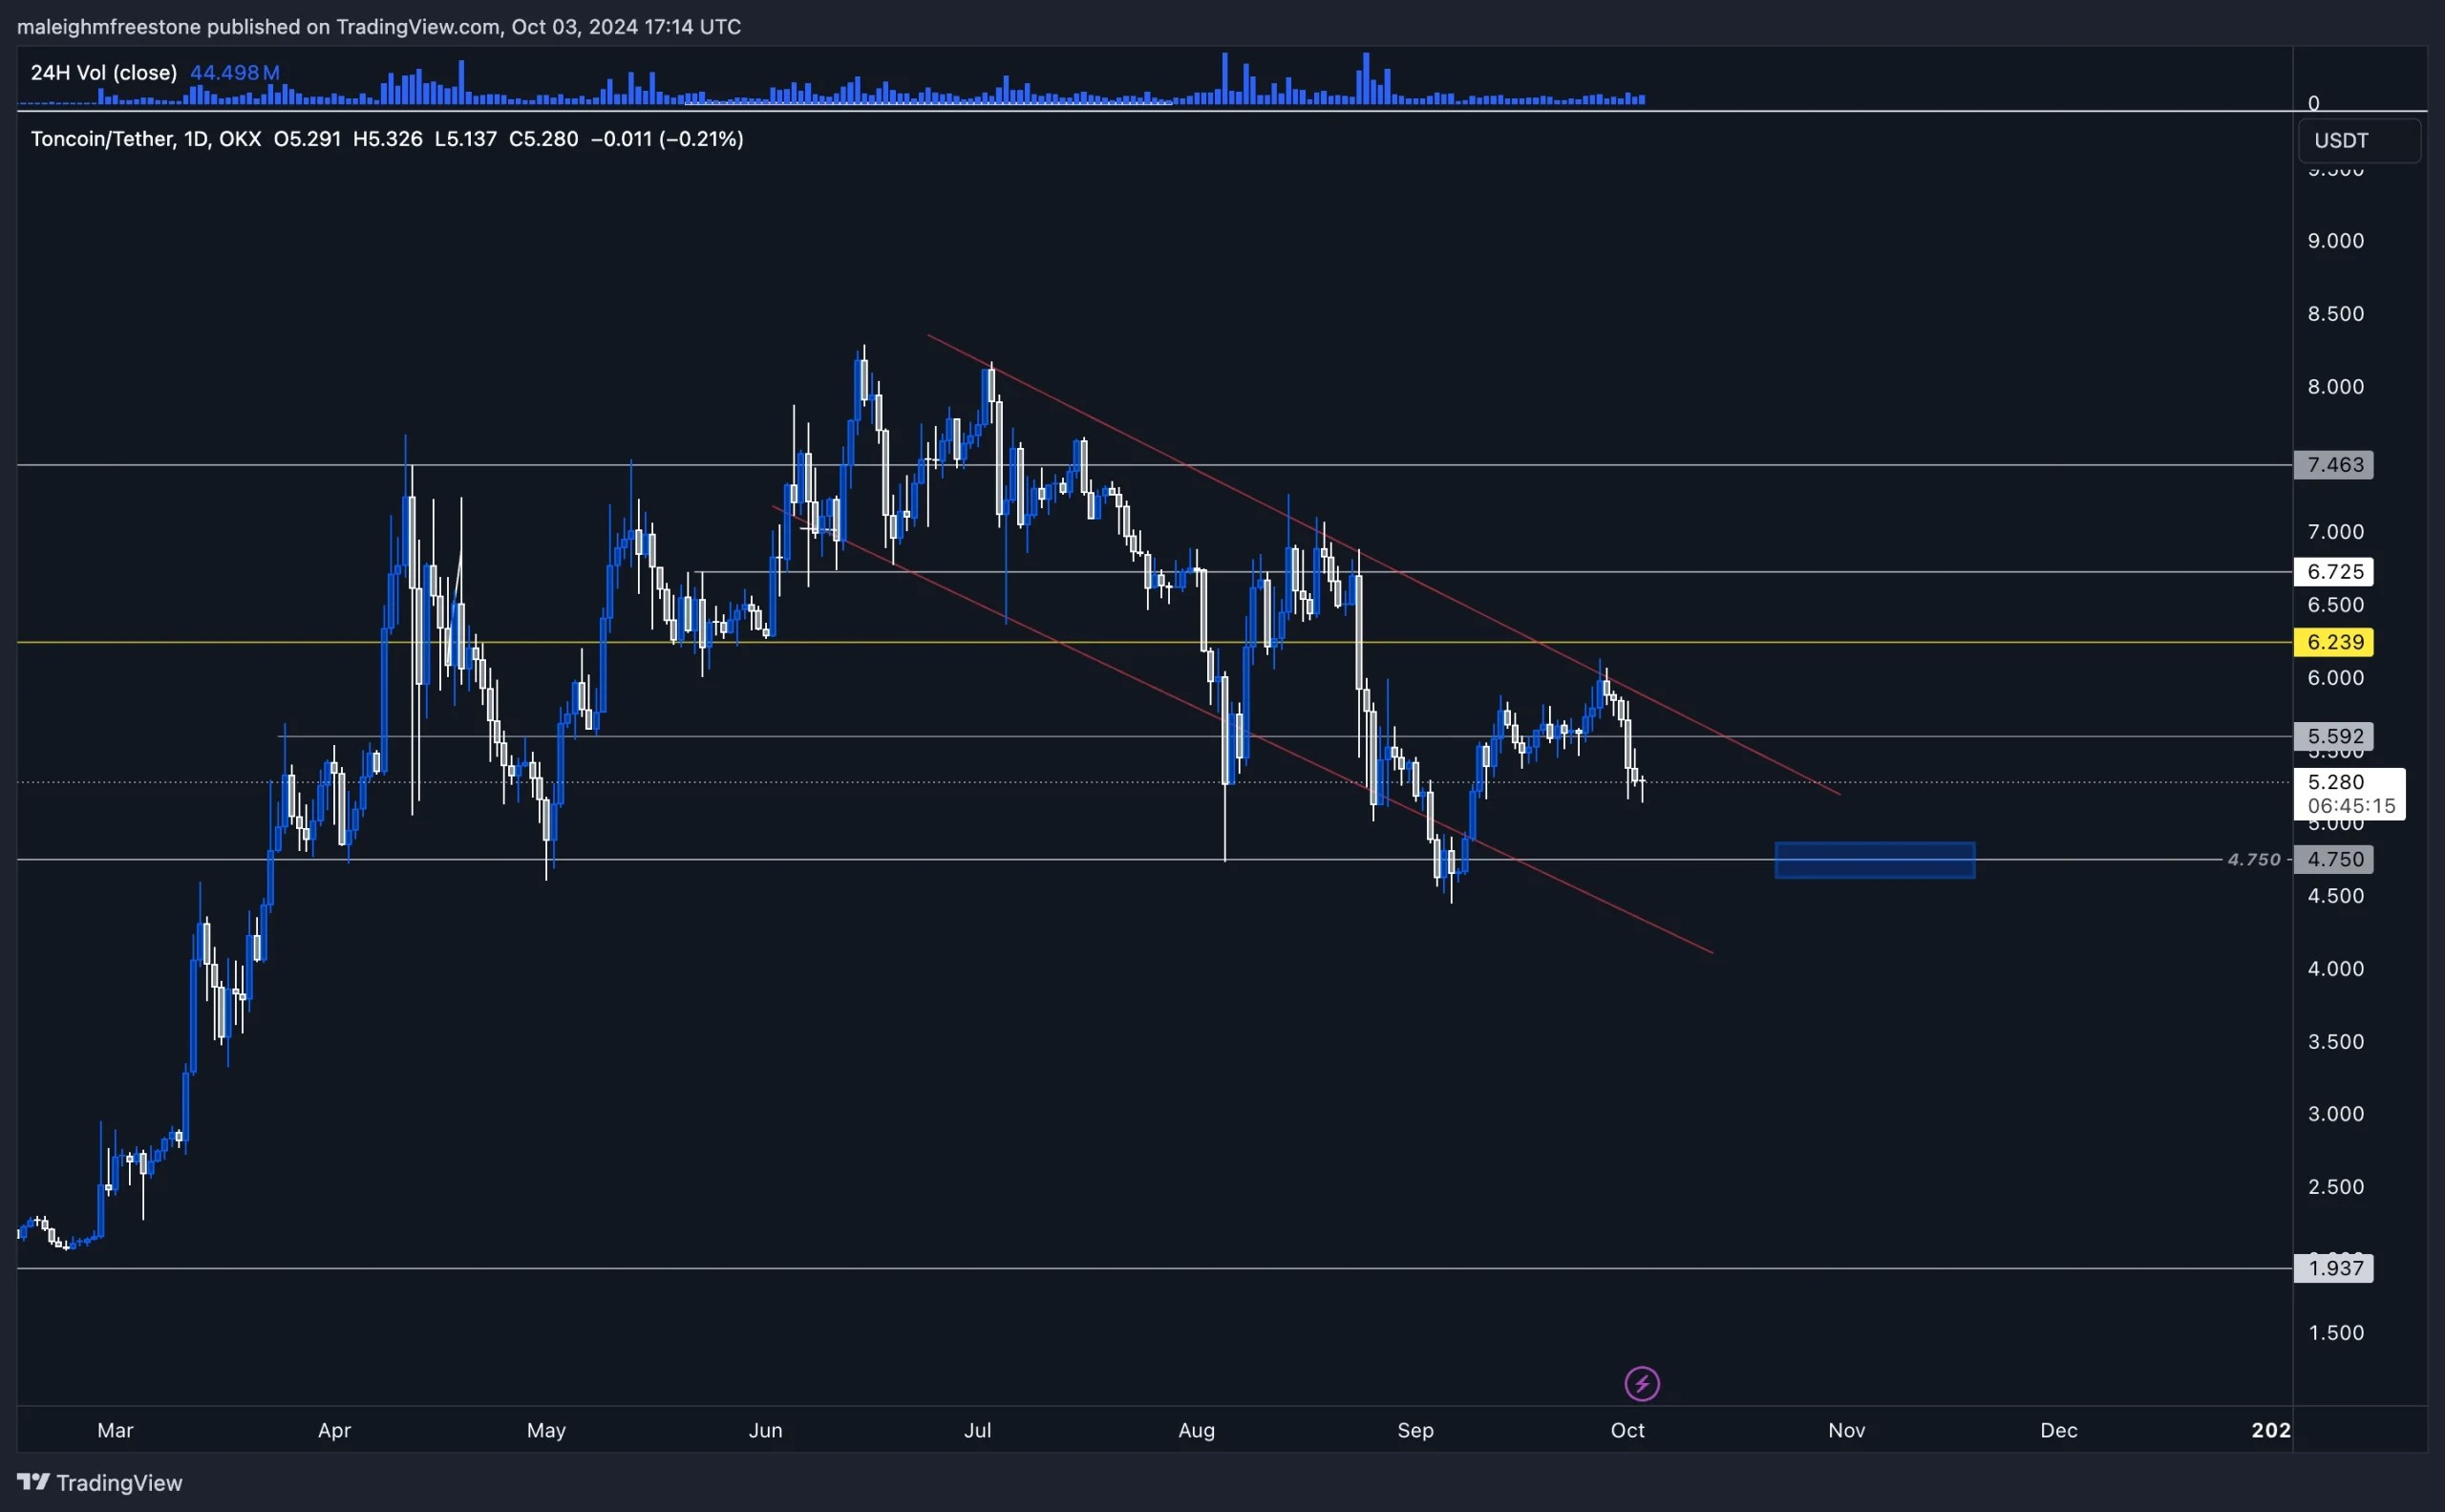
- On the daily timeframe, TON has been trading within a short-term bearish trend. However, the $4.750 level has repeatedly held, hinting at the formation of a wedge pattern as pressure builds up, which, as we know, has been a strong formation across the board this cycle.
Potential targets
- The key level to watch for is $4.750. This level provided the foundation for a 72% move in May, making it a key area of support moving forward.
Risk management ( if you are looking to get exposed )
Spot accumulation
- Accumulate spot near the $4.750 level, always best to first look to capitalize with spot in these promising bullish enviorments.
- This setup offers a decent risk-to-reward ratio but doesn't qualify as one of the best opportunities in the market. While it's not the top play, it remains a solid opportunity with great potential.
Leverage
- If leveraging, scaling in at $4.750 with low leverage. View like a spot position but added exposure and of course utilise stop orders to protect capital.
Cryptonary's take
TON presents an interesting technical setup, particularly with its retracement into the $4.750 demand zone. While it doesn't stand out as one of the best opportunities in the entire market, it remains a solid asset with potential, especially if the $4.750 level holds.With this level being responsible for significant moves in the past, it's worth keeping an eye on for short-term accumulation and potential upside, but with caution given the broader market and the current daily bearish trend.
While we do have a great report on this for its bullish case, we are not investing in this asset; this is purely for educational purposes. Before looking to get involved, do your own research.
SUI:
Market context
SUI has shown exceptional strength, standing out as one of the top gainers over the past month with a notable increase of 30% in market cap. Its nearest competitor, TAO, trails behind by 20%, highlighting the dominance and momentum behind SUI.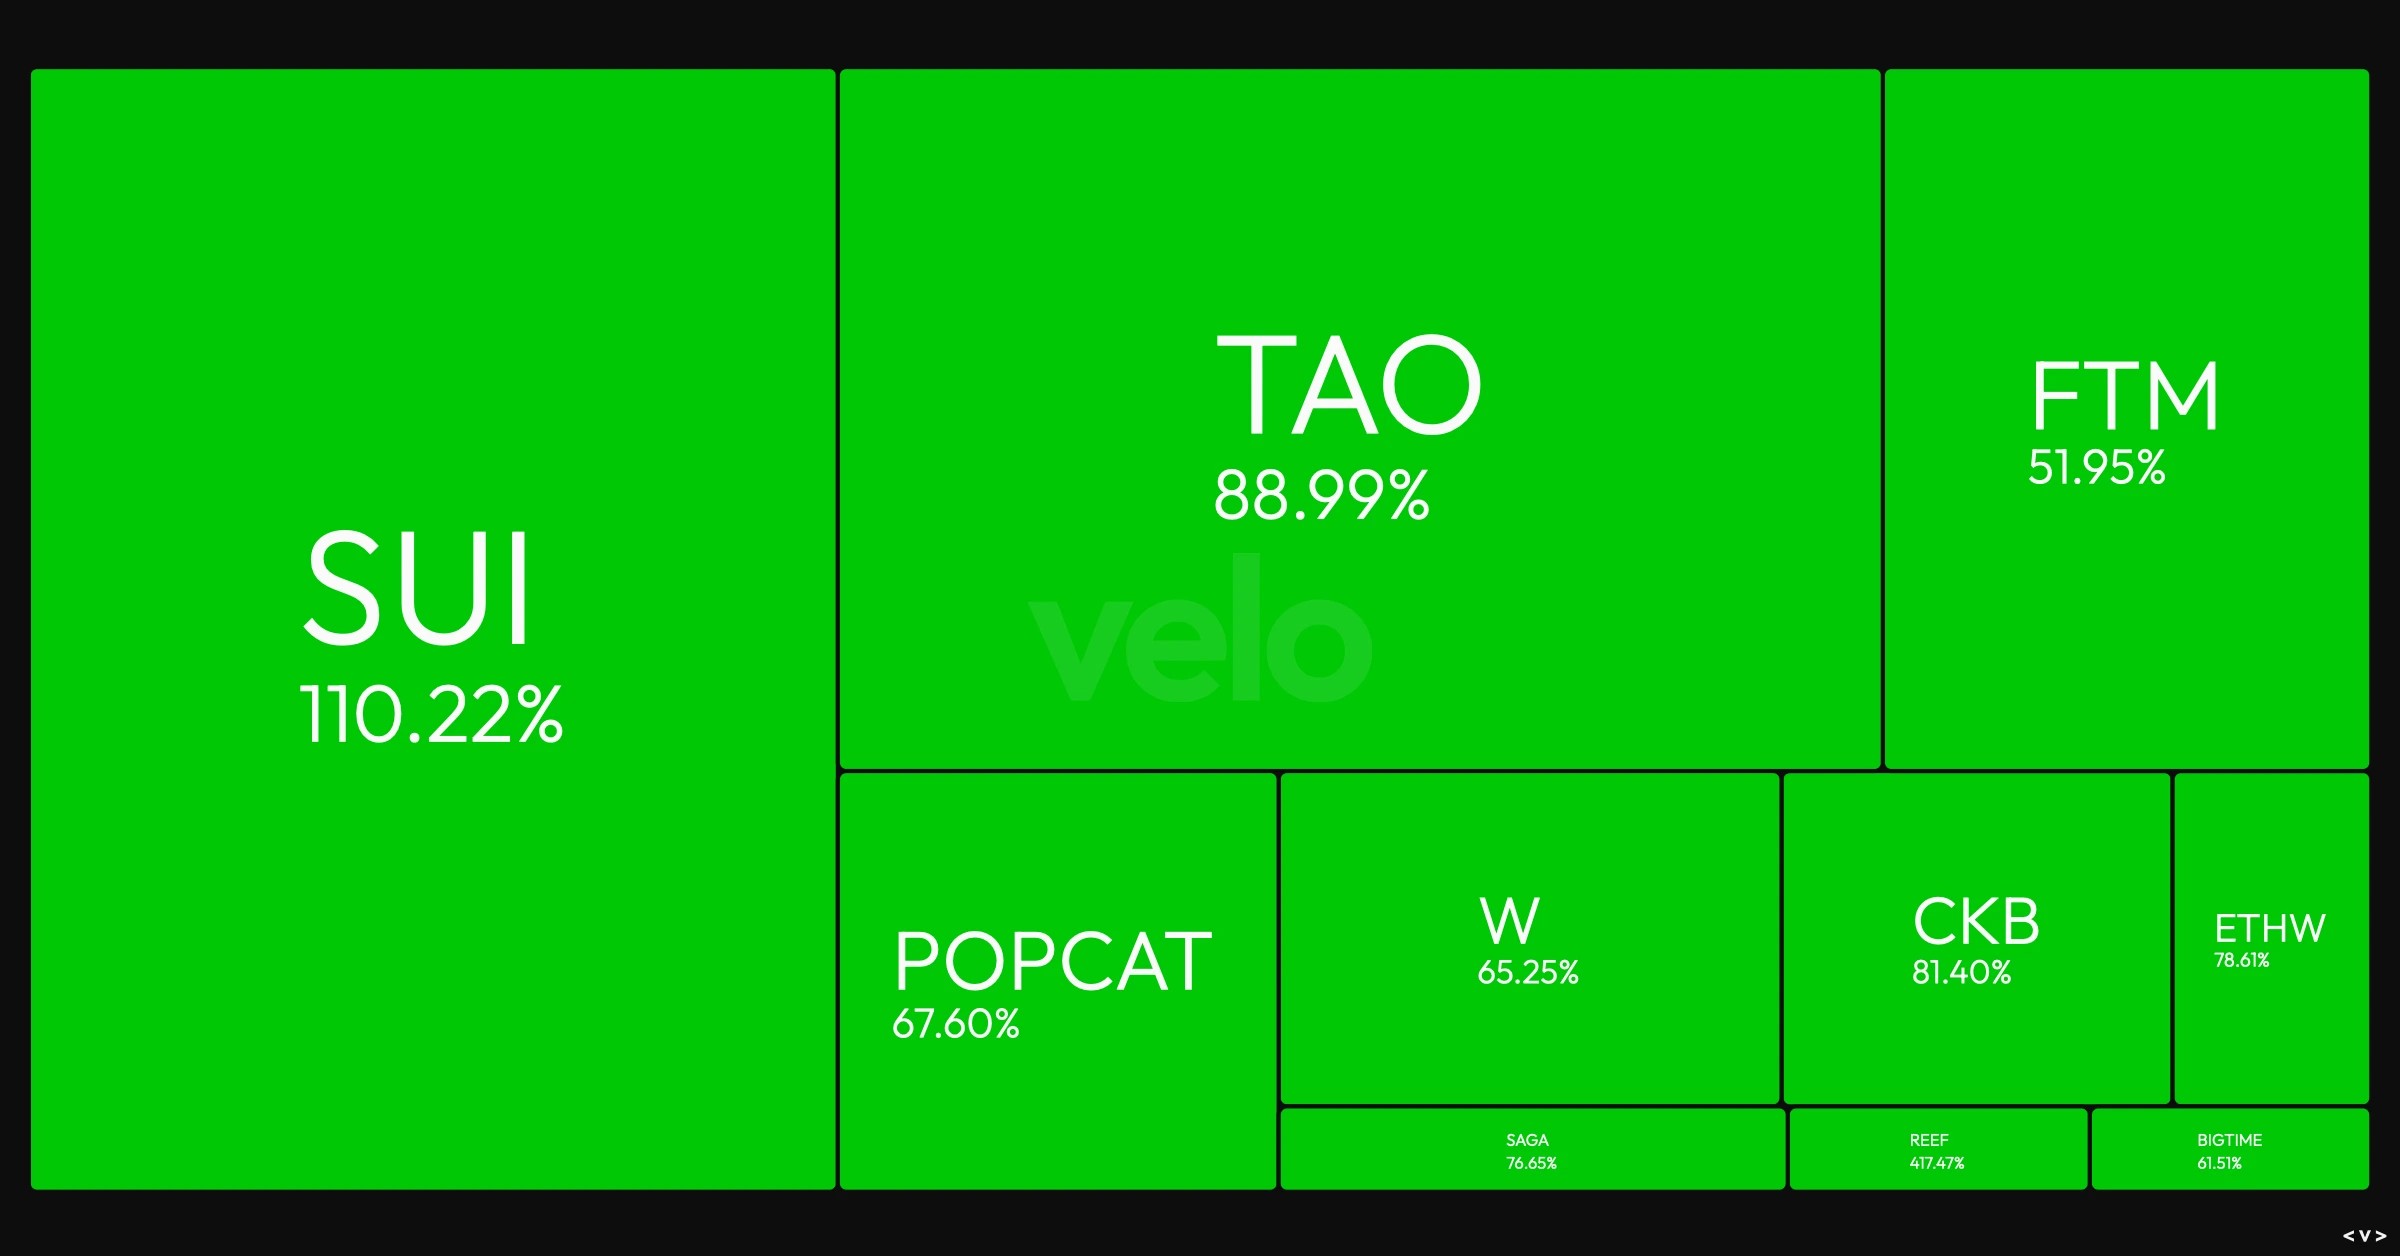
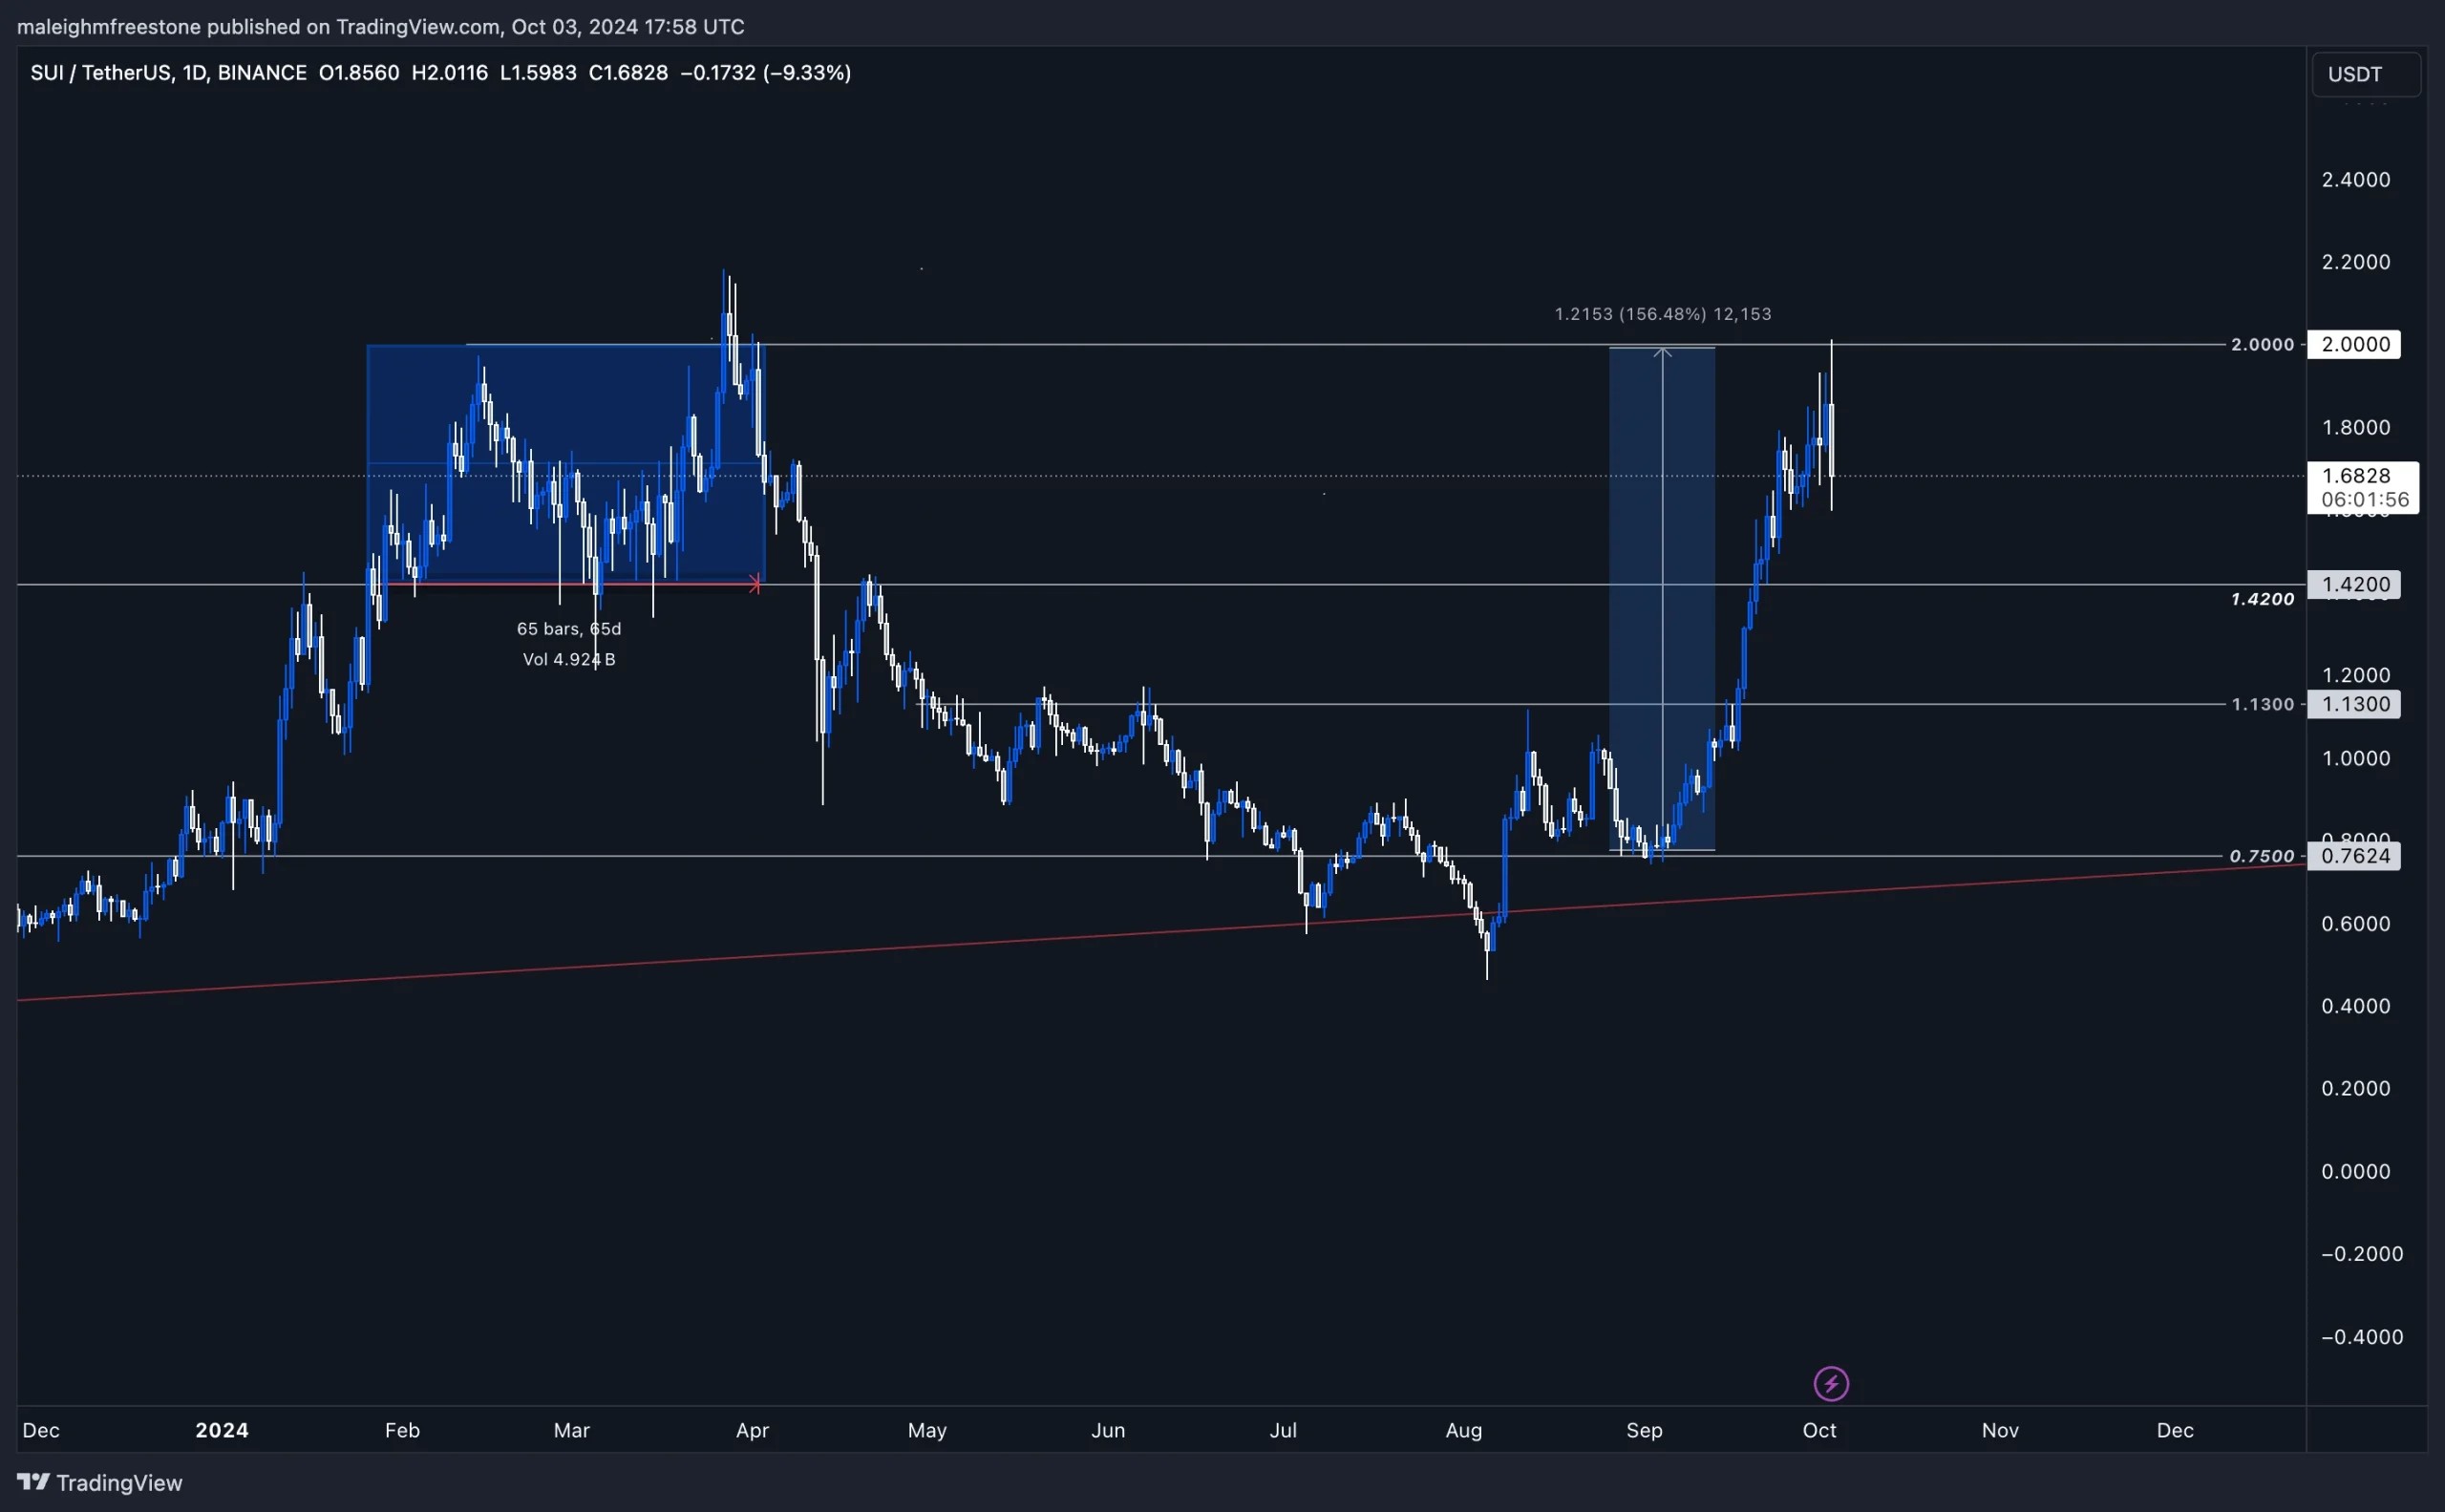
From a technical perspective, SUI saw a 163% move to the upside, rising from $0.75 to a peak of $2. This move now seems to be exhausting around the $2 price point, a level that has been tested multiple times earlier in the year (February, March, and April). The downside floor appears to be within the range of $1.42, a key area to keep in mind given its significance as support during a 68-day period earlier on in the year as well as almost the range floor for the $2 tests. Additionally, it acted as strong resistance on both January 15th and April 21st, establishing this level as a key price point.
Market mechanics
Liquidation Levels
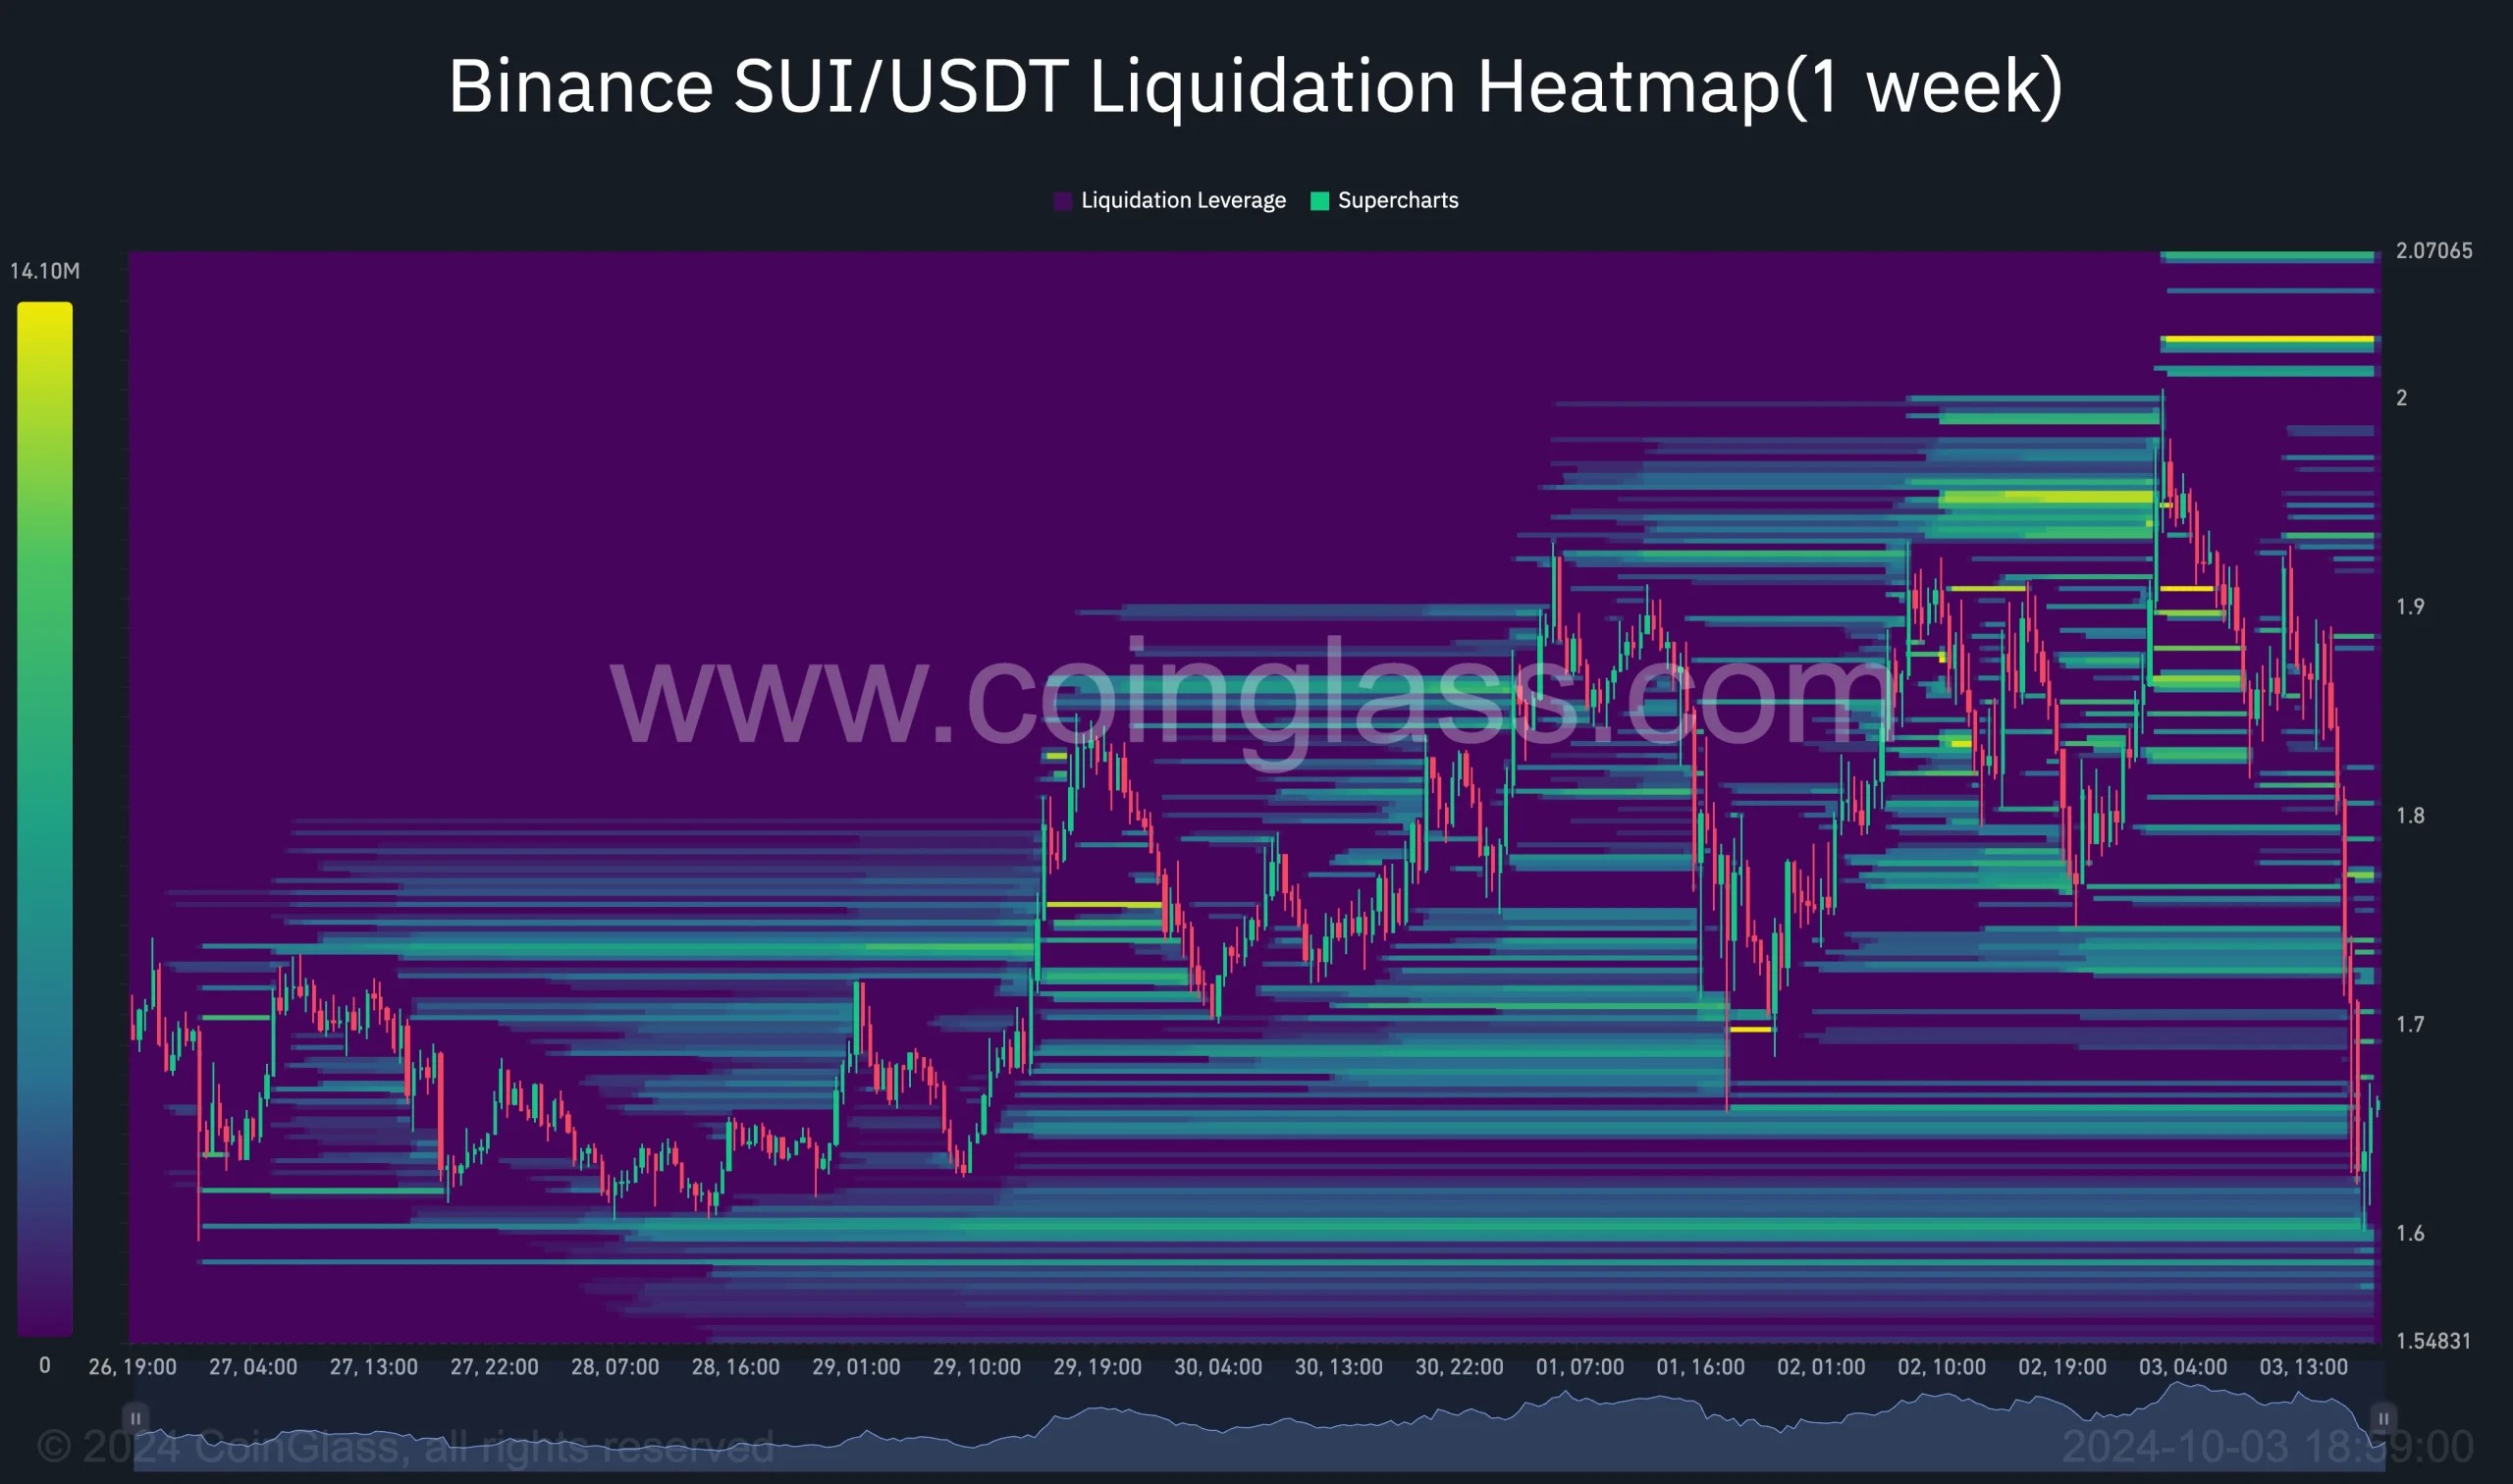
- The liquidation heat map reveals significant liquidation levels above the $2 price point, with the nature of SUI suggesting a tendency to push toward these levels. Exchanges, functioning as market makers, often drive prices towards liquidation zones to trigger these events, given the profitability of liquidations. If a bounce is found at $1.42, it could lead to a quick retest of the $2 mark as exchanges seek out these liquidation levels.
Fibonacci levels
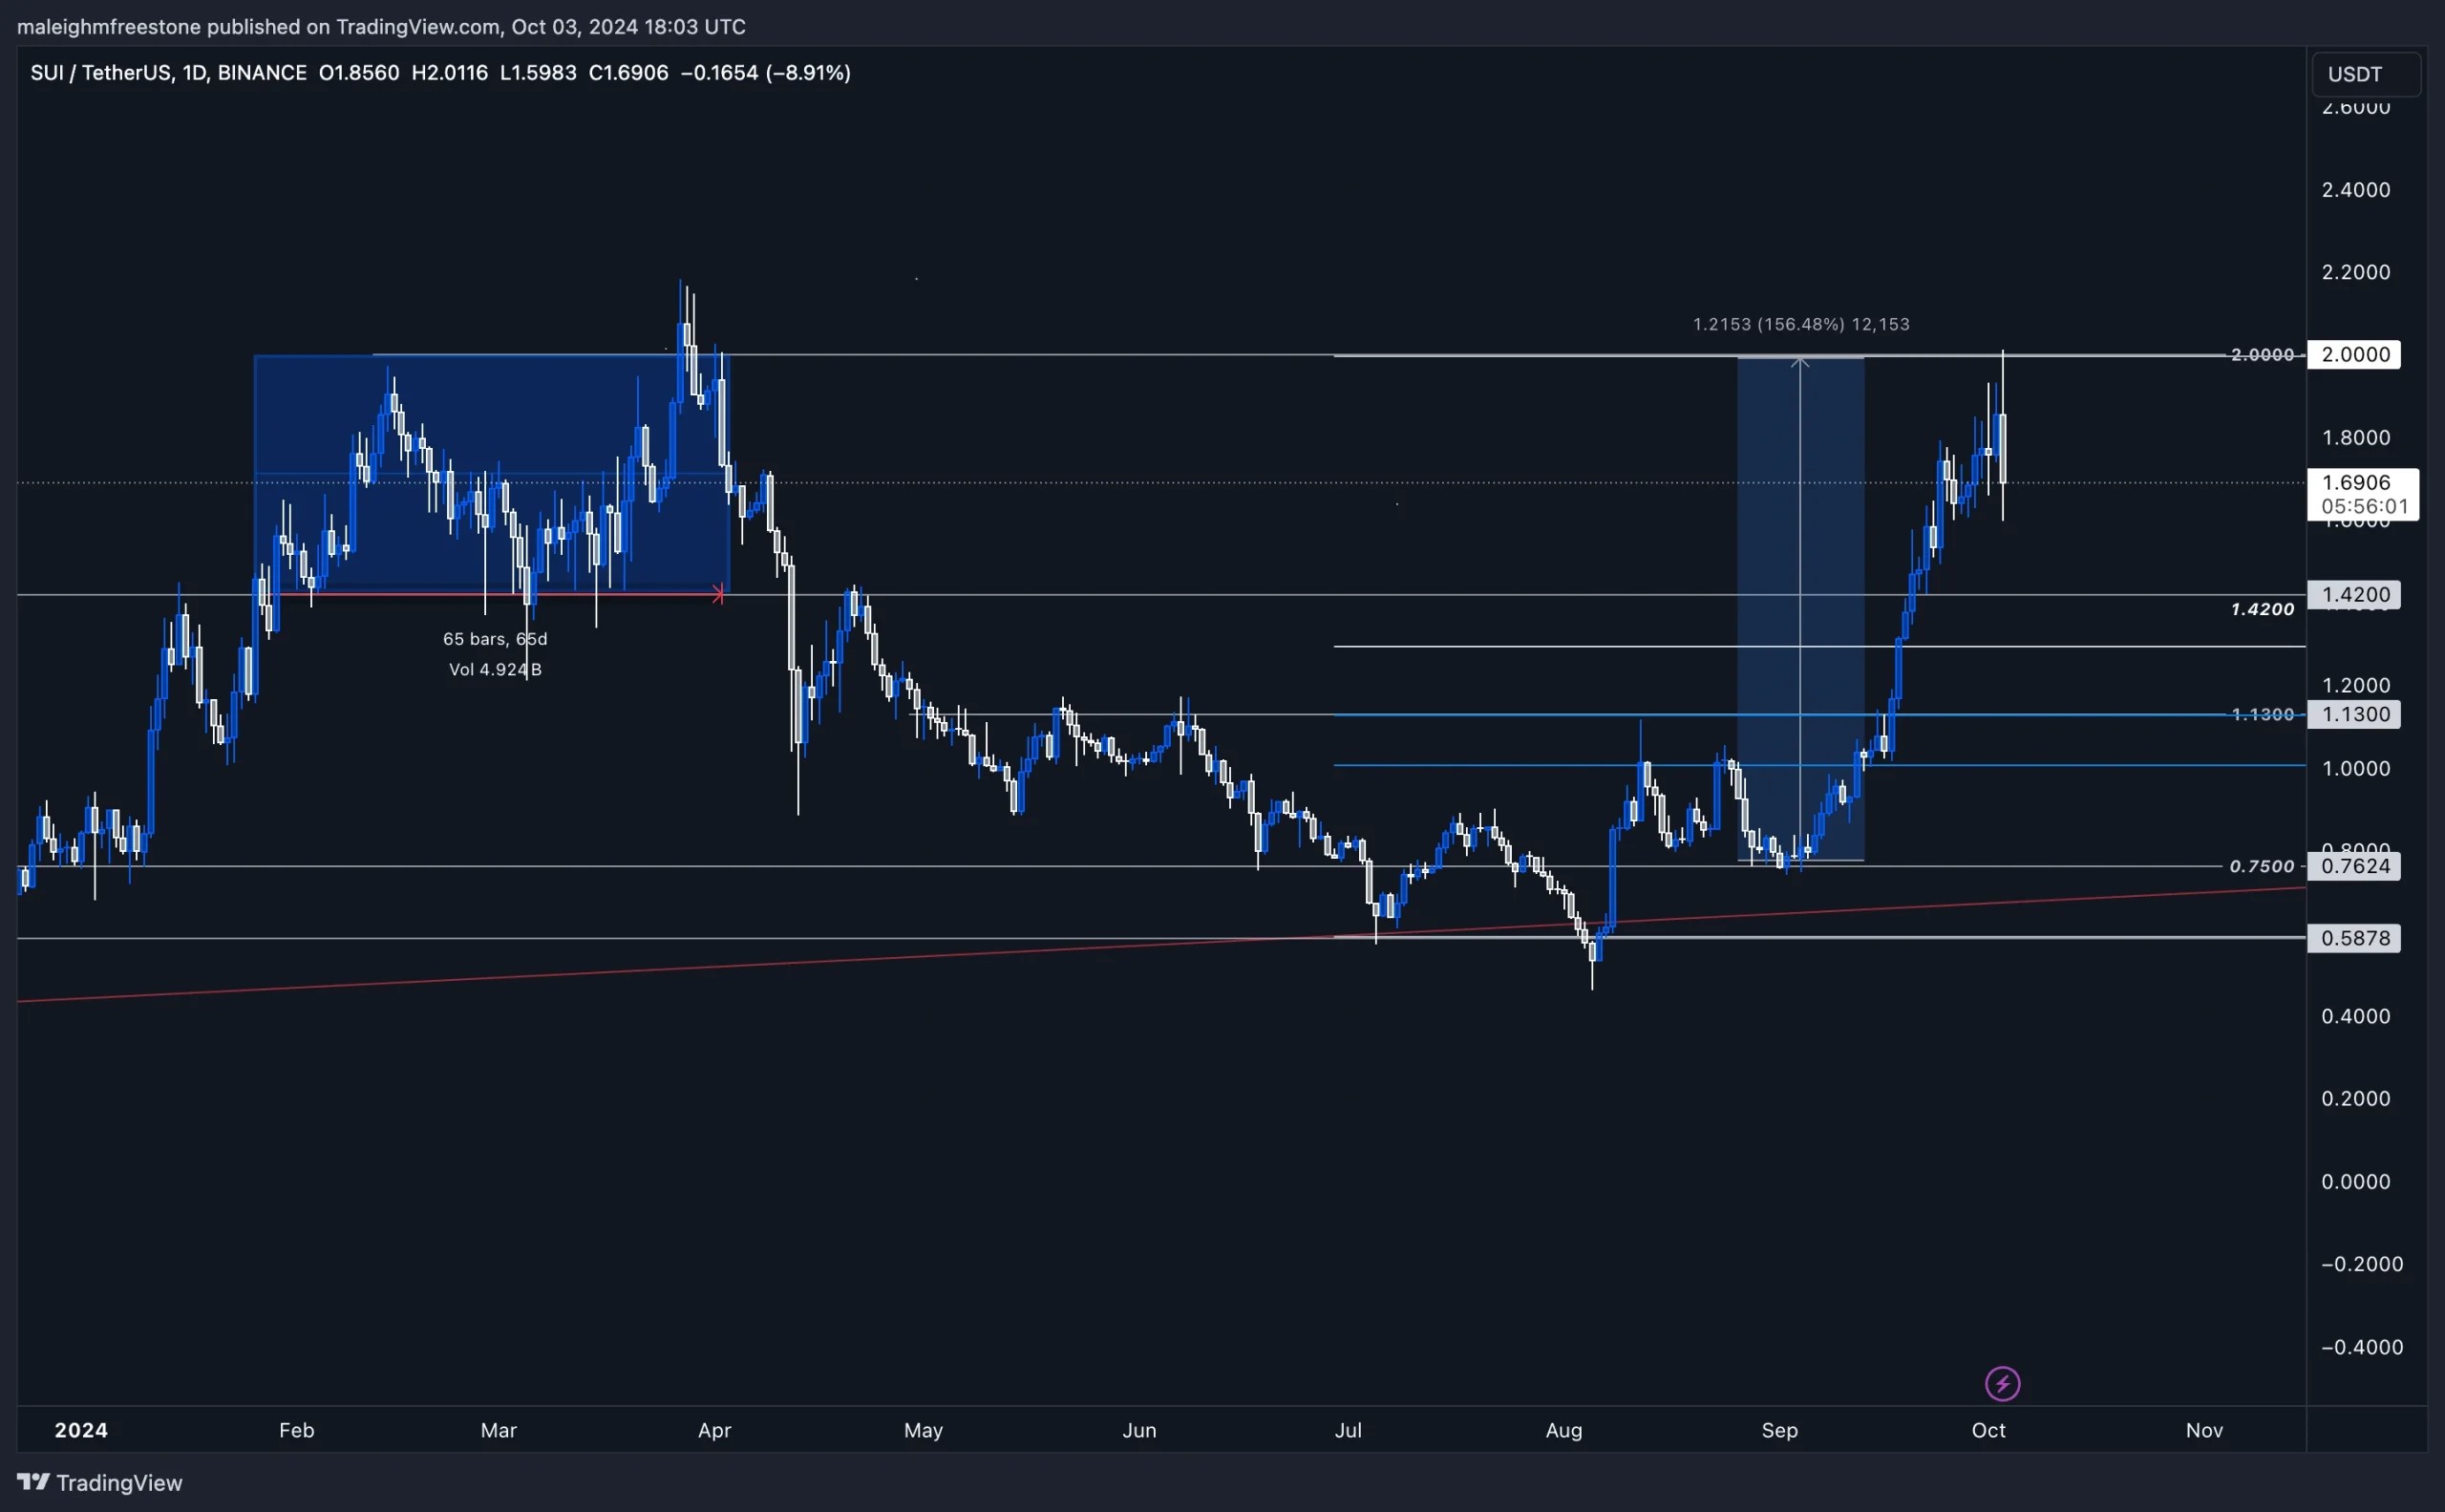
- Should the market fail to hold the $1.42 floor, the next notable level is $1.13, which aligns with the 61.8% Fibonacci retracement, measured from the low in August to the recent high at $2 on October 3rd. This area would also be supported by the 17.5% Fibonacci level, offering another potential zone of demand.
Cryptonary's take
SUI has shown impressive market strength, leading the way in gains over the past month. The key level to watch is $1.42, which has served as a strong support and resistance zone in the past. If the price bounces here, we could see a quick recovery towards $2, fueled by liquidation dynamics.However, a breakdown below $1.42 could see the asset retest at the $1.13 level, which coincides with significant Fibonacci retracement levels. While there isn't a clear playbook here, tracking where demand comes in will be crucial for any future moves and after a strong move like this, with all eyes on an asset, profit taking will be natural. Holding fire and seeing where the next floor is a good play.
Recommended from Cryptonary


