Save 23% ($351) & Get a Free 1-1 Call with our Team ⏰ : 0d 2h 59m 43s
Breaking down the market context of RUNE and SCF
RUNE's Fibonacci retracement and SCF's stable holder base highlight key accumulation zones. Could these be prime buying opportunities? Let's dive into the data and explore the potential for these two assets.
Disclaimer: This is not financial or investment advice. You are responsible for any capital-related decisions you make, and only you are accountable for the results.
RUNE:
Market context
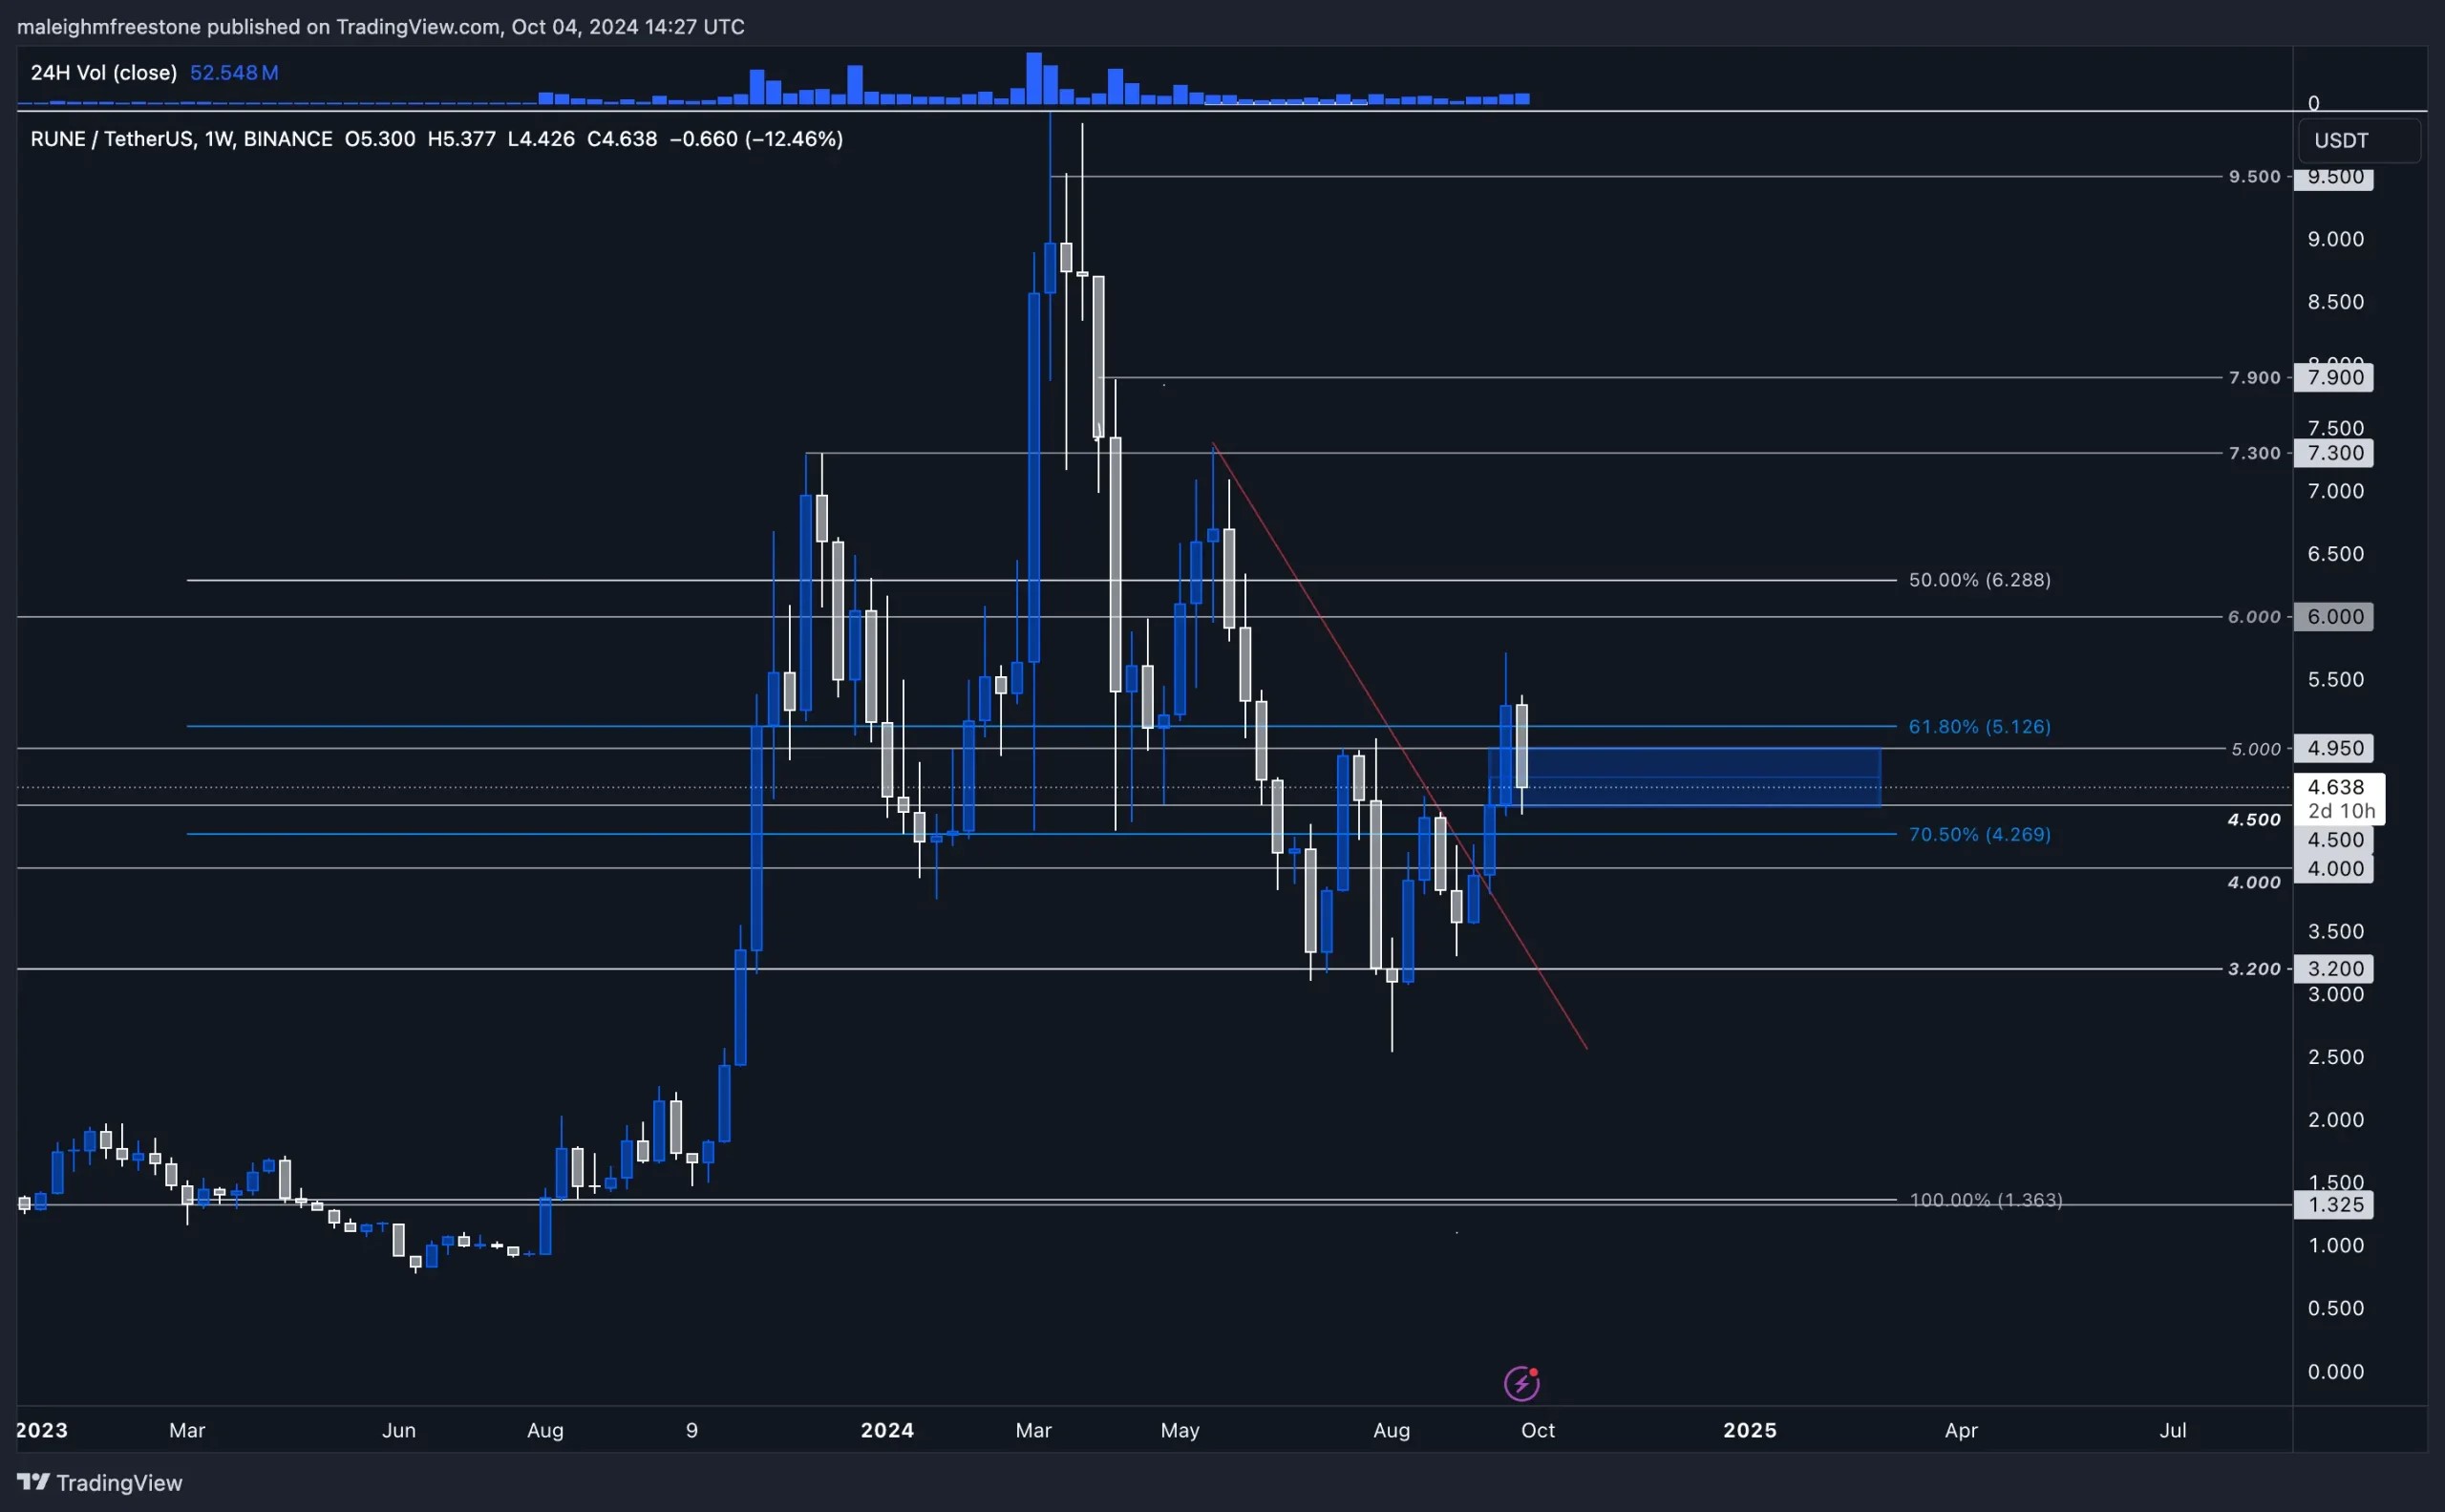
When we look at RUNE's current context, it's really clear. We've got a significant low at $1.5, where we saw a large amount of volume come in. This was a key level of support, with buyers stepping in when we were trading around that region like, we say, a scene of the crime price point.Now, we've pushed up and hit another price point with heavy volume, right at $5, where we've seen significant selling-likely due to the recent geopolitical tensions. But that's actually a positive sign because it shows there's a lot of volume being traded in this area. The market is perceiving it as a sell zone at the moment, but in the short term, this could flip.
If we pull the Fibonacci retracement from the overall context, running from the $1.5 lows to the $9.5 highs, we get a key 61.8% retracement around $4.5. This level is crucial, as it represents a significant retracement of the overall move and is holding up well in the current price action.
We can see that we've established a nice range between the key levels of $5 (a psychological number) and $4.5 (the Fibonacci level). Price is getting trapped between these two levels for now, creating a range that needs to be monitored closely.
Volume profile
- We also see a lot of volume sitting around the $4.5 level and even down to $4, as indicated by the volume profile. This shows that a significant number of participants are interested in this price range, validating it as an accumulation zone.
Bearish trend break
- We broke out of the bearish trend line that we discussed in the last analysis, which is a strong indication that momentum is shifting. This is important to watch as it shows the market is moving away from bearish control.

Current playbook
Key levels:
- $5 is acting as a key psychological resistance level. We've tested this level multiple times, and each time, sellers have stepped in. But once this flips to support, we could see a strong move higher.
- $4.5 is the critical Fibonacci retracement level (61.8%) from the larger swing low of $1.5 to the high of $9.5. This is the key level to watch for accumulation.
 Short-term Fibonacci alignment
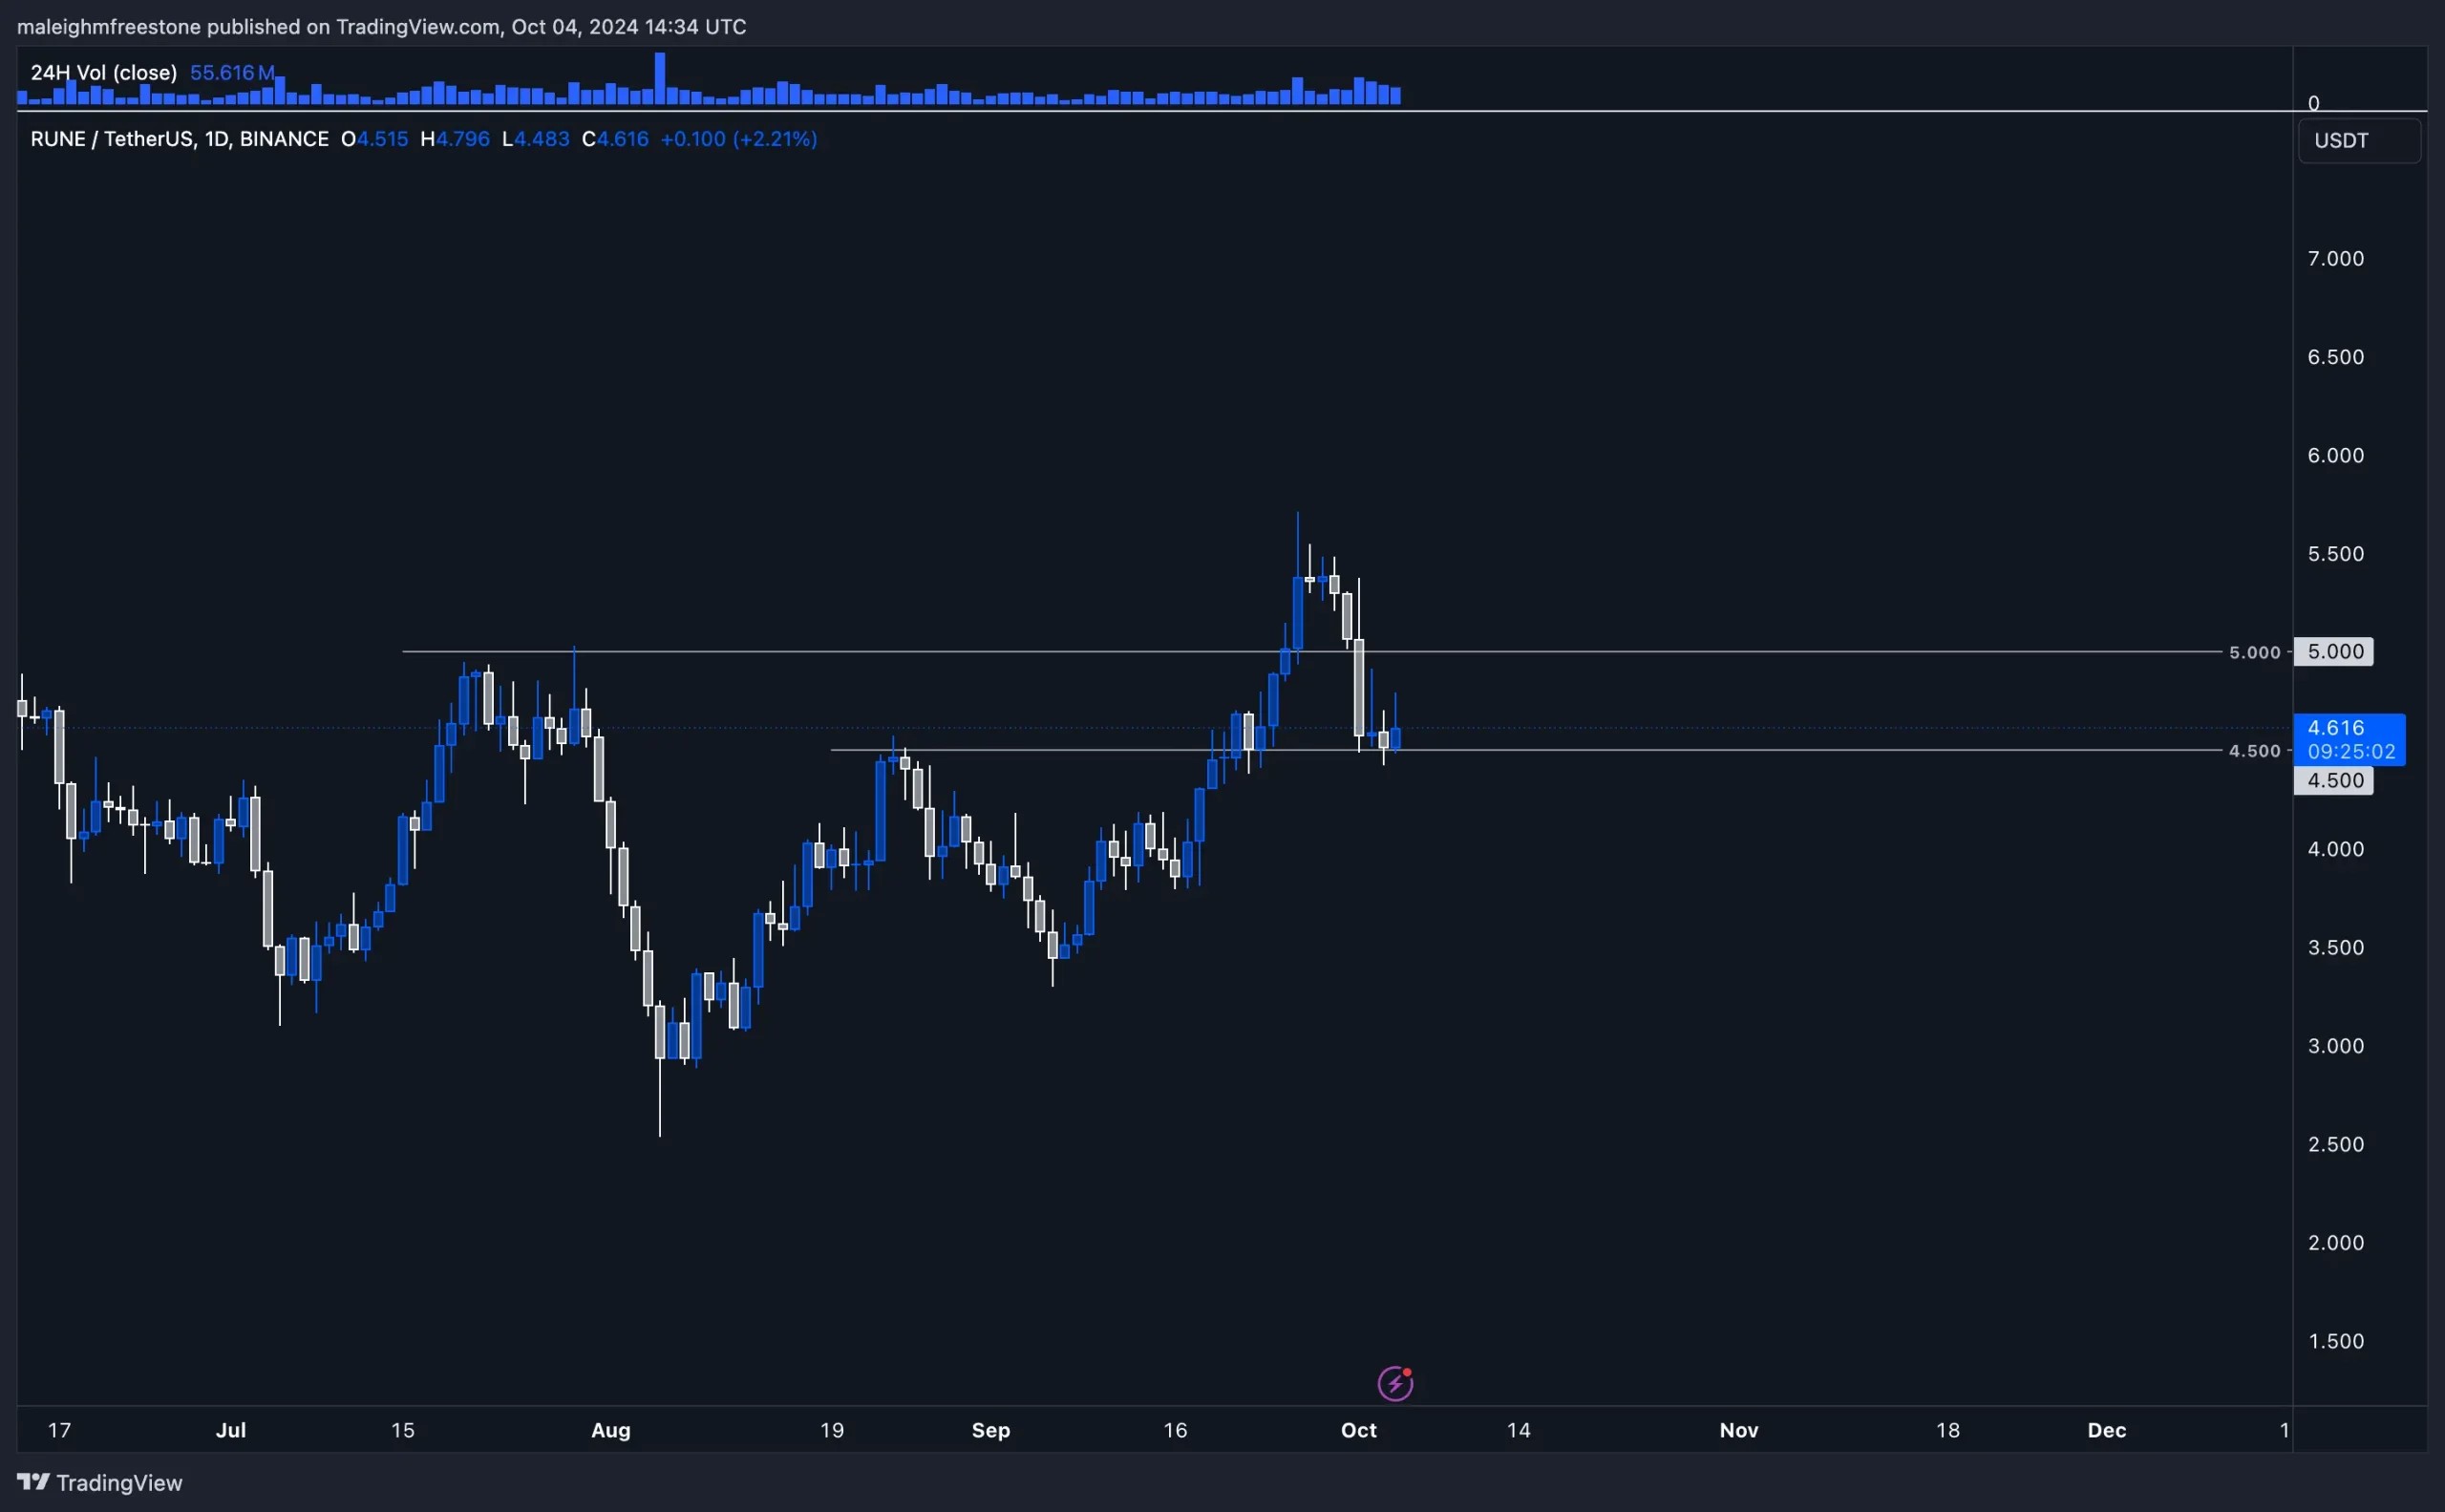
- On the daily timeframe, we pulled a smaller Fibonacci from the $4.4 lows to the recent highs of $5.7. Interestingly, this short-term Fib lines up perfectly with the 61.8% retracement at $4.5, confirming its importance.

Risk management strategy
Accumulation
- The best play here is to monitor how well the $4.5 level holds. If the price continues to respect this Fibonacci level, we could see further accumulation in this area. There's also notable volume at $4, so if the price dips, that could be another great spot for accumulation.
Cryptonary's take
RUNE has performed nicely, breaking out of the bearish trend and holding up well around the $4.5 Fibonacci level. This range between $4.5 and $5 looks like a prime spot for accumulation. As long as these levels hold, this could present a strong buy opportunity for the short-to-mid term. This is purely for educational purposes, and we are not investing in this asset.SCF:
Market context
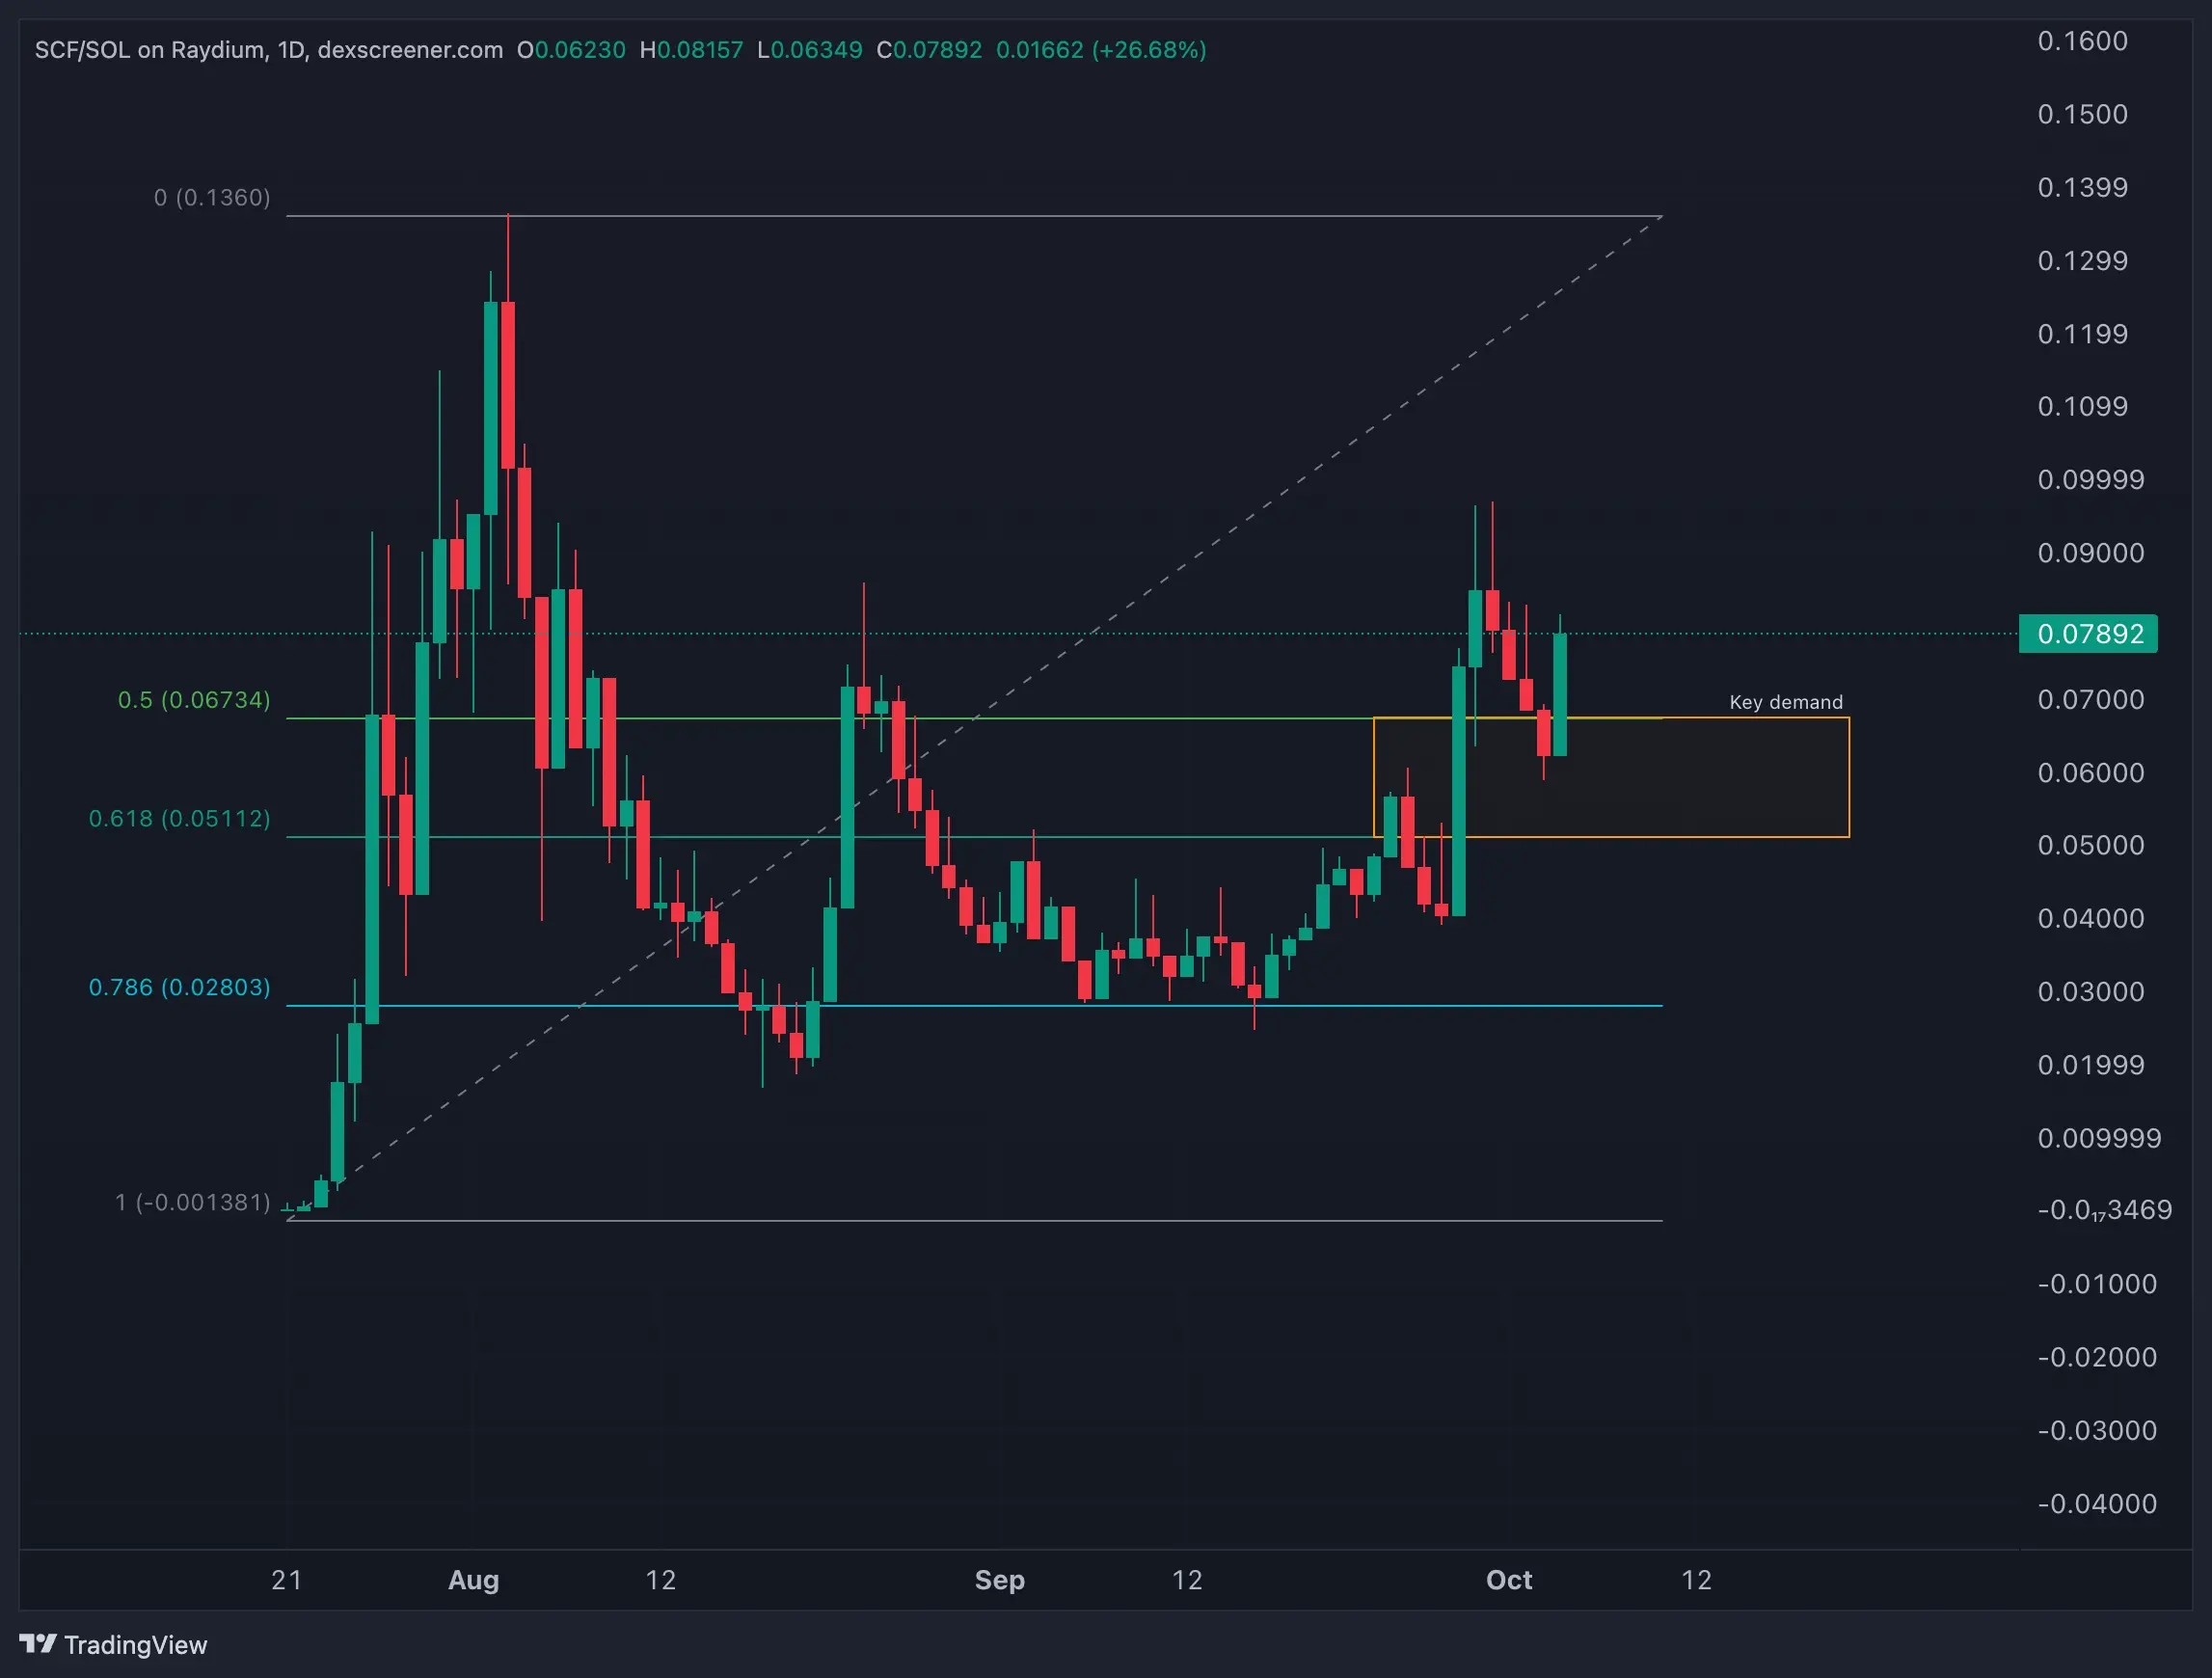
When analyzing SmokingChickinFish, we can see a clear trend forming. The asset has maintained higher lows since the 20th of August when it set a key swing low at 0.2. This higher low structure is promising, even though we haven't set a new higher high just yet. This suggests a potential wedge formation might be building up, signalling that downside momentum is starting to slow down. From the initial high at 0.13, the asset retraced downwards, but we've held steady around key levels, showing signs of demand in this region.
Fibonacci analysis
- We've pulled a Fibonacci retracement from the inception low to the high of 0.13. This gives us a key level at 0.06, which sits nicely between the 50% and 61.8% Fibonacci retracement levels. Historically, 0.06 has acted as both demand and resistance, and it's no surprise we're seeing buy orders come in at this price level again.
- This is a key price point that needs to hold. It's a historically significant level that could serve as a strong foundation for further moves higher, especially given its alignment with the Fibonacci retracement.
Holder base
What's interesting about SmokingChickinFish is that the holder base has remained relatively steady, even during periods of profit-taking. There hasn't been any significant drop in holders, which suggests strong conviction from those holding the asset. This is a positive signal for the long-term potential of the asset, as it shows that despite the 85% correction back from the 3rd of August to the 22nd of August, confidence hasn't wavered.
Cryptonary's take
SmokingChickenFish is in an important phase right now. We've seen bullish buy orders come in at key levels within the Fibonacci retracement zone, which is encouraging for the asset's outlook. If the asset can break out of the bearish trend formed from the highs of the 3rd of August and the 30th of September, it could move aggressively back toward retesting those highs. While we're not invested in this asset, it's clear that SmokingChickenFish shows strength across the board, especially with the current market context and holder stability.Recommended from Cryptonary


