Save 23% ($351) & Get a Free 1-1 Call with our Team ⏰ : 0d 2h 59m 43s
Breakouts or breakdowns: BTC is between support and resistance
It sounds repetitive to say that trading crypto is a bit like riding a rollercoaster blindfolded – but the truth is that nothing else compares. Just when you think you've got the twists and turns figured out, there's a surprise waiting.

Right now, Bitcoin is standing at a crossroads, trying to decide if it will break through the resistance barrier or take a detour down to support.
As is our custom, we bring you the backstage pass to the technical analysis of the majors, starting with BTC.
LFG!!!
TLDR
- BTC is battling at $28k resistance and needs to close above to confirm the uptrend.
- ETH is lacking momentum and eyeing potential rejection at $1,625.
- SOL bounces beautifully from $21 support, watching for bearish divergence if $24 is retested.
- It’s time to take profit on DOT.
Disclaimer: Not financial or investment advice. You are responsible for any capital-related decisions you make, and only you are accountable for the results. “One Glance” by Cryptonary sometimes uses the RR trading tool to help you quickly understand our analysis. They are not signals, and they are not financial advice. Any capital-related decision you make is your responsibility and yours only.
BTC | Bitcoin
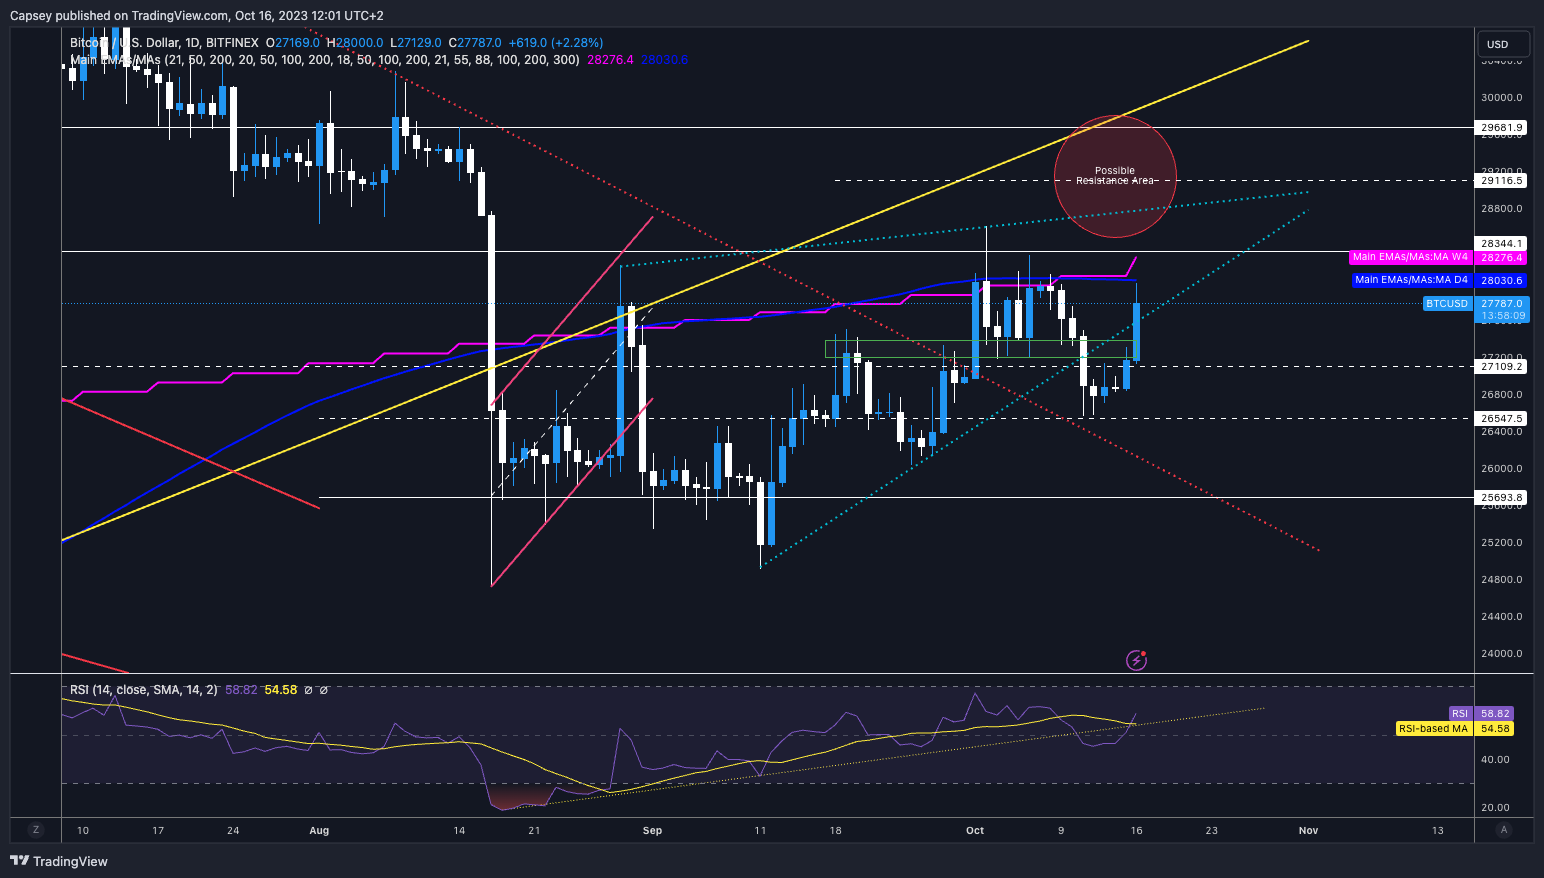
The inverted correlation continues. S&P closed lower on Friday, whilst BTC climbed well over the weekend and shot past our local resistance box of $27,100 to $27,300. The key is to close a daily candle above this area now.Technical analysis
BTC had a brilliant move-up this morning after positive price action over the weekend. Following the move, the key area of interest was the local resistance zone between $27,100 and $27,300.This morning, BTC smashed through this and tested the $28,000 zone. However, this is now an area of more major resistance. There is the horizontal resistance at $28,300, plus there are several EMA’s and MA’s between $28,000 to $28,300 (200-day MA is a key one at $28,000).
Alongside this, we have the short-term realised price at $28,000. All of this together will most definitely provide some heavy resistance, at least in the short term.
A positive daily candle closure today (north of $27,600) would see BTC reclaim its uptrend, which could be positive for price in the short term. This is a positive that could help BTC’s price continue higher. Overall, we thought the first major area of re-assessment would be when BTC got back to $27,300, which we’ve got. Now, we’re becoming more cautious here as BTC tests $28,000. RSI & funding rates
Funding has been relatively chaotic, constant whip-sawing over the past few days. Right now, it’s slightly positive, but because of the whip-sawing we’ve had, this shows the fluctuation in overall positioning. Therefore, we should stay wary of the funding rate as it’s liable to bigger swings at the moment. So, nothing to really take from this in terms of helping us with direction.
The RSI has broken back into the uptrend and is still in middle territory at 58. One thing to watch here will be if BTC can close, close to $28,300, as this might put in a lower high on the oscillator and a higher high in price - hidden bearish divergence.
Conclusion on trading BTC
Our expectation for BTC was a move up to $27,300, and then we thought it might get a rejection there. We’ve stormed higher, and really, this has only strengthened our more cautious approach at these price levels - near $28,000. Great price action overall, but this is where we now become much more cautious.Action
- For now, we are not doing anything. We’re $28,300 to see if BTC can get there. We may look for shorts at that point. We will re-assess our outlook when/if we get there.
ETH | Ethereum
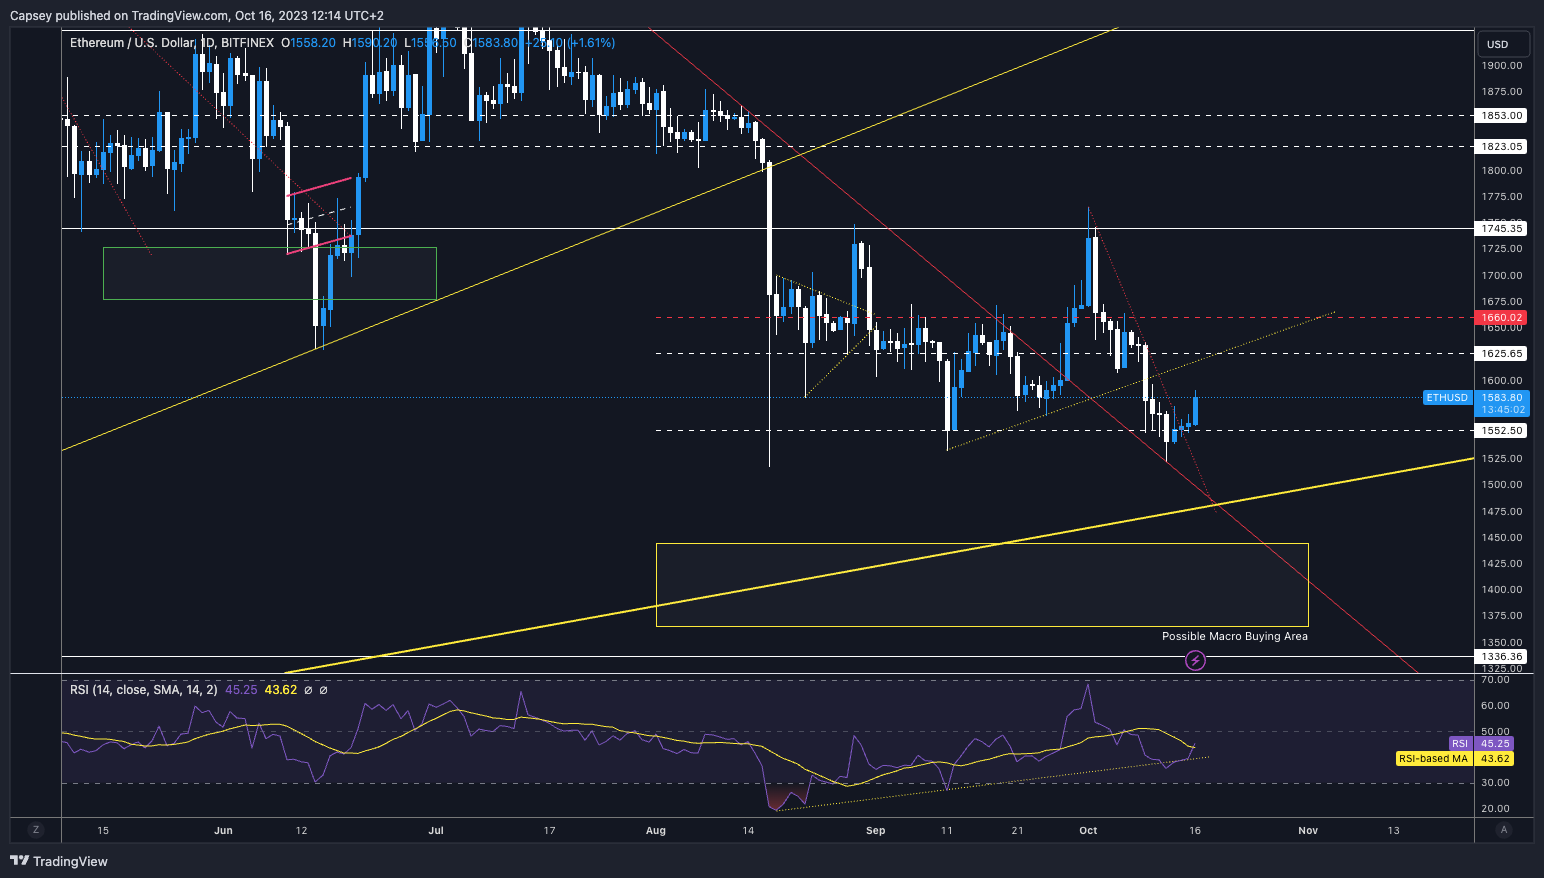
The $1,550 level seems to be supported for now, but ETH doesn’t look or feel as strong as BTC.Technical analysis
We finally saw ETH get some upside, having bounced from the $1,550 horizontal support. There is now a very local resistance at $1,590; the next major one is at $1,625. ETH is well out of its uptrend here, and we feel the $1,625 resistance, which is also the underside of the uptrend line, should act as a more meaningful resistance.We feel ETH will reject at $1,625 if the price can get to that level. Regarding MA’s/EMA’s, they’re well above us at $1,690 and $1,790, so we don’t need to consider this too much for now.
RSI and funding rates
The RSI is testing the RSI-based MA here at the 45 level. Potentially, this could be resistance, but you’d like to think the overall market strength could help ETH get some more upside here, but it does look weak. No divergences to take note of for now.Funding rates are relatively positive and much more positive than BTC. But this is a normal-ish rate here, so, we wouldn’t take too much from this. Funding Rates are helpful for any meaningful/large changes which indicate the market is heavily positioned one way. We don’t have such moves right now, so the funding rate is irrelevant to our analysis.
Conclusion on trading ETH
At the back end of last week, we noted that ETH looked weak but that we expected a bounce - we got it. Right now, though, ETH hasn’t moved as strongly as BTC, so we’re not confident in it here.Action
- If ETH can get to $1,625, we may begin to look for shorts, but we will re-assess if we get there as to whether we take the trade or not.
- In the medium term (next 1-6 months), we expect ETH to go meaningfully lower, at least sub $1,400. Once we get there (assuming we do), we will strongly consider DCA’ing for the long term.
SOL | Solana
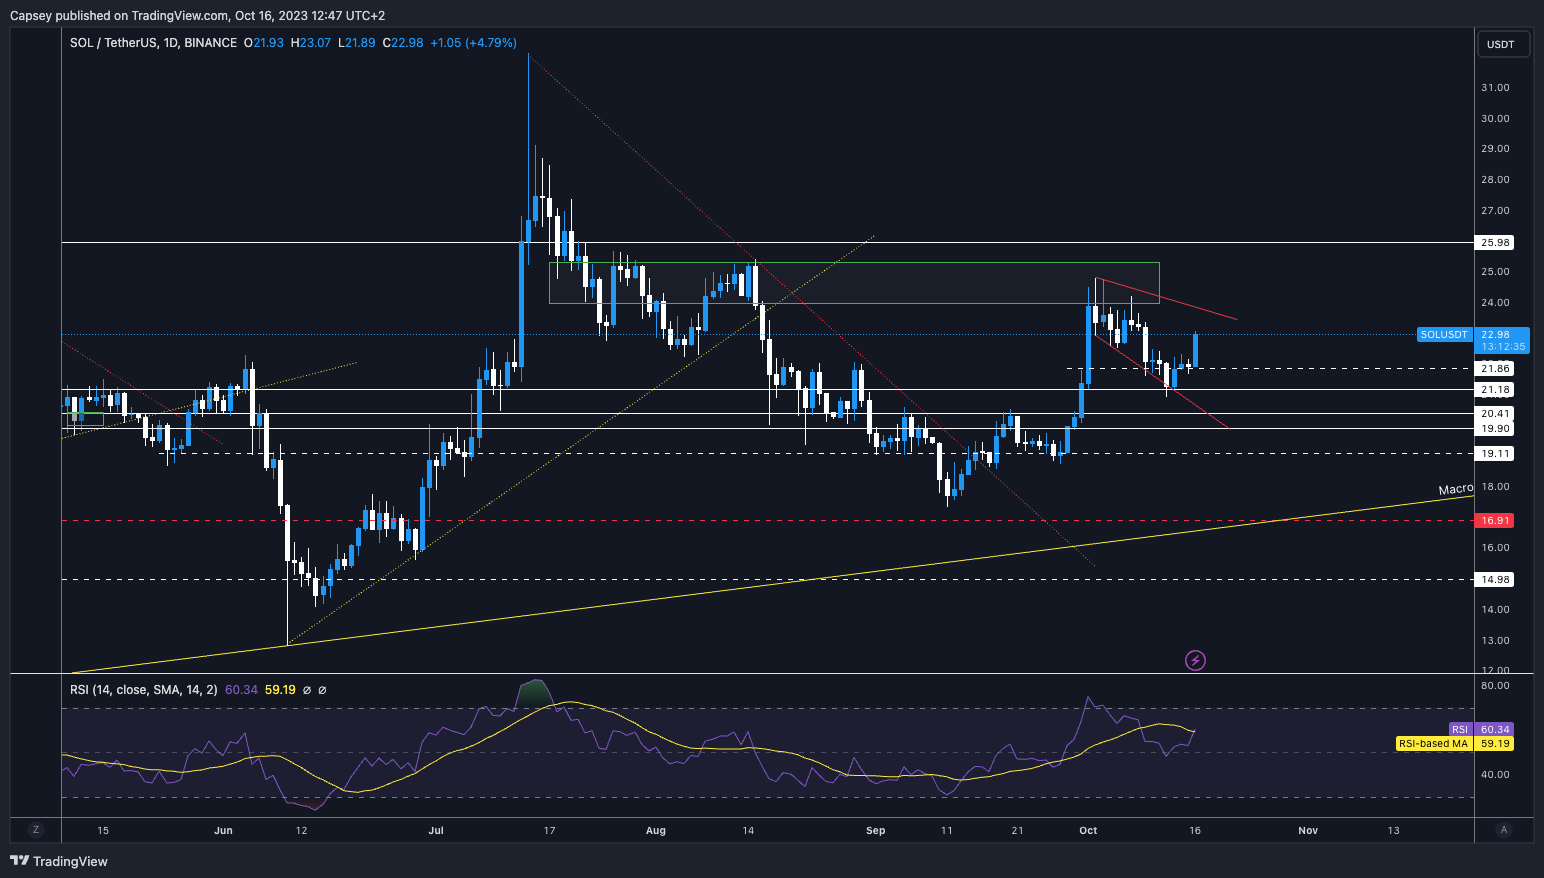
A beautiful bounce from the major support of $21.18. We’d love to see this back in the $24’s; if we do, we may look for shorts.Technical analysis
SOL has so far held the $21.18 horizontal support, which also has the support convergence from the bottom border of the broadening wedge.On our last SOL update, we said, “We expect SOL to find some support at this level and at least try to attempt a bounce up to $21.86.” Well, SOL has outperformed this.
We’re moving into the $23 area and may head to the $24 zone. If we get that, that will be a retest of the last local highs and maybe what produces the bearish divergence that would entice us into a short. For now, it’s a really strong move from SOL.
Let’s see if we can push onto $24.
RSI and funding rates
The RSI is now retesting the RSI-based MA at the 60 level. This could provide some local resistance to SOL here. No divergences are currently at play. But, a move into the $24 zone could open the door for a bearish divergence. We think this could open the door for a short if we get this.The funding rate for SOL is quite deeply negative, so exchanges are trying to encourage longs to come in here. Heavily negative funding rates could be open to a short squeeze. This could be what pushes us higher from here.
Conclusion on trading SOL
Things are quite mixed here, but we feel this could go higher, potentially driven by a short squeeze. Other than this, we’re waiting here.Action
- If SOL can get back to $24 and put that bearish divergence in with a higher high in price and a lower high in the oscillator, then this may entice us for a short.
- But right now, we’re sitting tight and waiting for the bearish divergence to happen, if it happens at all. Patience.
DOT | Polkadot
Good play so far. We took the long in the early $3.60s, but we didn’t quite get our long orders filled at lower prices. Either way, in decent profits, having called the trade last week.Technical analysis
There was a big break below the major horizontal support of $3.90, which led to a deeper move lower. We identified the green box as an area of long interest, which could generate a bounce back to $3.90.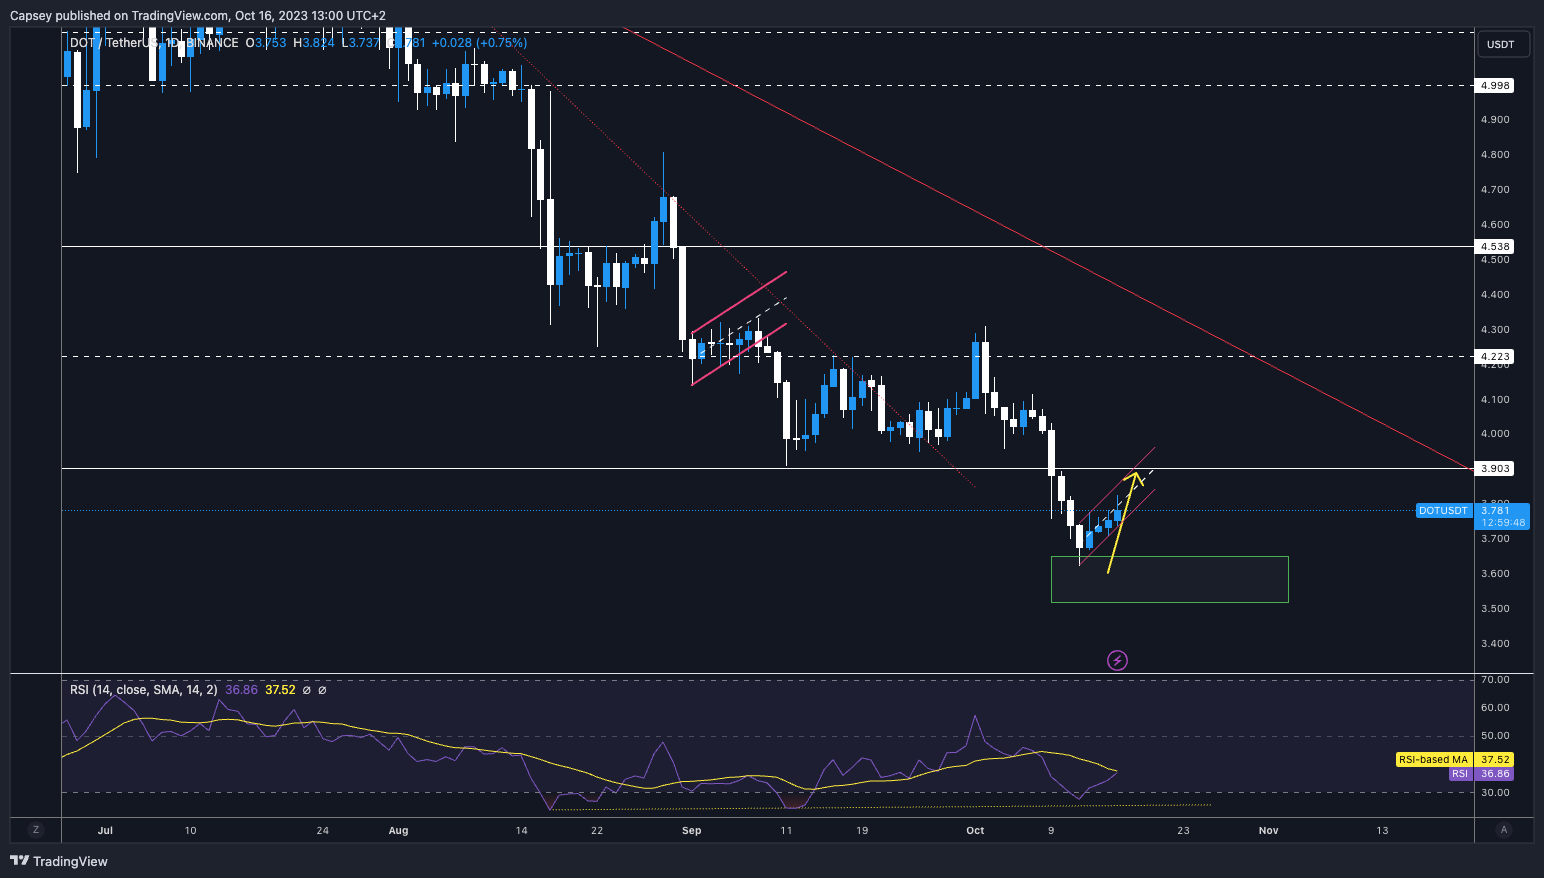
Currently, DOT is in a flag pattern. It's an unconventional flag pattern but something we still need to be aware of and watch.
RSI and funding rates
The RSI was oversold, which encouraged us to take the long trade, as it also put in a bullish divergence at this level. We have now bounced from oversold levels and back to testing the RSI-based MA at 37, which could act as a local resistance.The funding rate was very negative and still is very negative, but on some exchanges, it is also now positive. So, this is showing a less bearish bias but still bearish. The bearish positioning isn’t as extreme as it was before we took the other side of the trade. Remember, a market too heavily positioned one way is open to a squeeze.
Conclusion on trading DOT
Going into the DOT long trade (we took the other side of the market), it was overly bearish. Now, it’s still bearishly positioned, but not as one-sided as it was last Friday. This, therefore, weakens our trade thesis despite the fact the thesis is still strong - just not as strong as it was.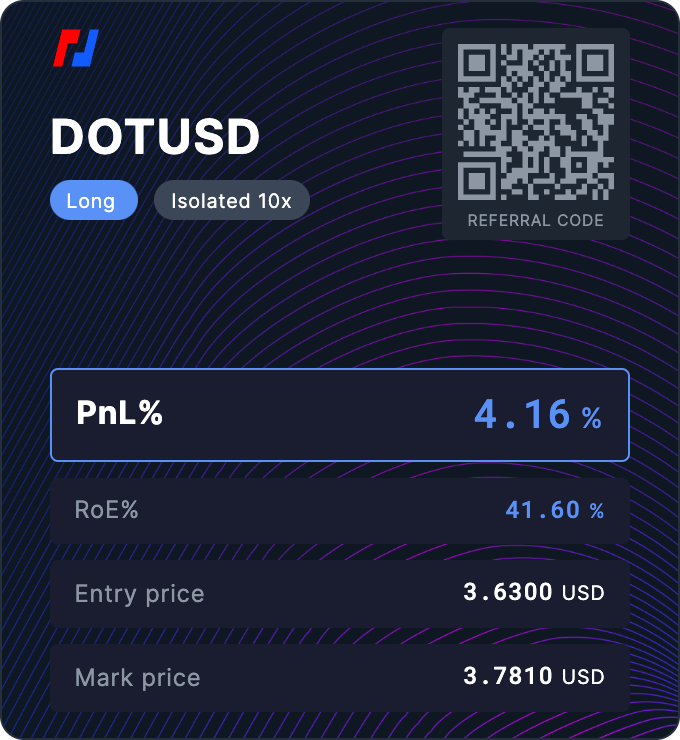
Action
- We are going to close our DOT long here. This is probably too early and is slightly skittish of us here. But, with BTC moving how it has, you'd have expected DOT to perform slightly better than it has. We’re now also at the RSI-based MA, which could be a local resistance.
- As we said, skittish of us here, but we’re booking the profits.
Cryptonary’s take
And there you have it: this week’s crypto drama is already underway.Like the lead actor, BTC is in the spotlight, pushing past $27,000 and eyeing that $28,000 mark. But don't let the curtains close just yet. A formidable lineup of resistance factors is waiting backstage, demanding our attention.
Bitcoin is king, and its performance sets the stage for altcoins. So, keep your eyes peeled on Bitcoin, and you’ll be in a better position to understand where the rest of the market is heading in the short term.
As always, thanks for reading.
Cryptonary OUT!
Recommended from Cryptonary


