Save 23% ($351) & Get a Free 1-1 Call with our Team ⏰ : 0d 2h 59m 43s
TLDR:
- Ukraine hits Russian bombers, minor Gold and Oil uptick, no broad market impact yet.
- US-China trade talks progress, tariffs paused, Trump-Xi call expected.
- Key US jobs data on Friday could sway Fed policy; markets eye softening.
- Crypto turning bearish, BTC breaks support, alt/meme coins lose momentum; summer pullbacks expected.
- Ukraine Launches Drone Attack on Russian Bombers.
- US and China Trade Negotiations.
- Data This Week.
- Bearish Retests for the Majors and the Indices.
- Cryptonary's Take.
Disclaimer: This is not financial or investment advice. You are responsible for any capital-related decisions you make, and only you are accountable for the results.
Ukraine launches drone attack on Russian bombers
On the weekend, Ukraine launched a sophisticated drone attack on Russian bombers deep inside Russian territory. This is a meaningful escalation just before both sides went into a fresh round of peace talks in Istanbul on Monday, to which a prisoner swap was agreed, but still no truce was agreed. However, there will be another meeting between Ukrainian and Russian representatives at the end of the month.This escalation from the Ukrainians is likely an act that keeps the pressure on, and it strengthens the Ukrainians' hand in the ongoing negotiations. This didn't really impact markets, although it did result in both Gold and Oil moving higher on the day. We're continuing to pay attention to this; should there be a further escalation, which then might have a wider effect on risk assets.
US and China trade negotiations
In the last 24 hours, we've seen the US extend its tariff pause on many Chinese goods until August 31st. Alongside this, we've seen messaging out of the Trump administration that Trump and Xi are expected to get on a call potentially later this week.Overall, we're seeing a greater willingness from both sides (but mostly the US) to talk and come to an agreement. However, this still might take time. So far, we've had the 'Liberation Day' tariffs paused for 90 days. We're now approximately 60 days through that, and we haven't seen any trade deals yet. This is something we need to continue keeping an eye on over the coming weeks and months, although the markets seem to be looking through tariff talk until more concrete deals are announced.
We'll now move on to the key components of the market that we're watching.
Data this week
This week is a key week on the data front as we have labour market data, which is arguably the most important data now, as a weakening there is what likely brings the FED to the interest rate cutting table.Today (Tuesday), we have Job Quits and Job Openings. The expectation is that the number of Job Openings will come down very slightly whilst the number of Job Quits will remain flat at the 3.3m level. However, the key data is on Friday, where we have Non-Farm Payrolls and the Unemployment Rate. The Unemployment Rate is forecasted to stay at 4.2%, whilst the Non-Farm Payrolls are forecasted to come in at 130k, which would be lower than last month's 177k print. A 4.2% Unemployment Rate and a 130k jobs added would likely be seen as positive by the market, this would be despite a decrease in the number of jobs added.
Bearish retests for the majors and the Indexes?
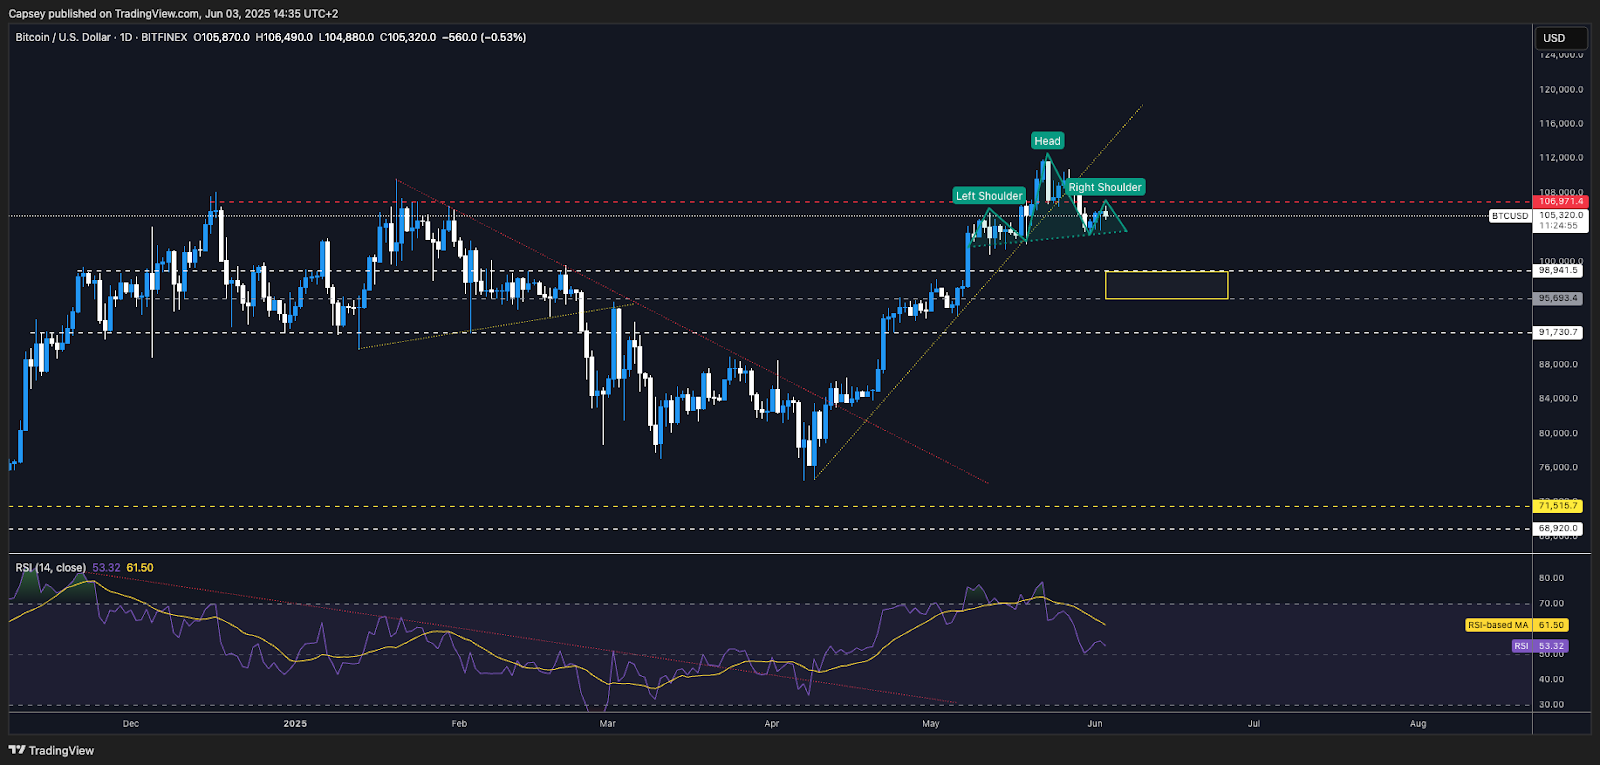
Starting with BTC, price has broken below its uptrend line, and it's fallen below the $107k support, although it does remain above the $105k support. However, price has formed a 'Head & Shoulders' pattern which, if it broke down (bias suggests it would), it would have a downside target of $98k.BTC 1D timeframe:
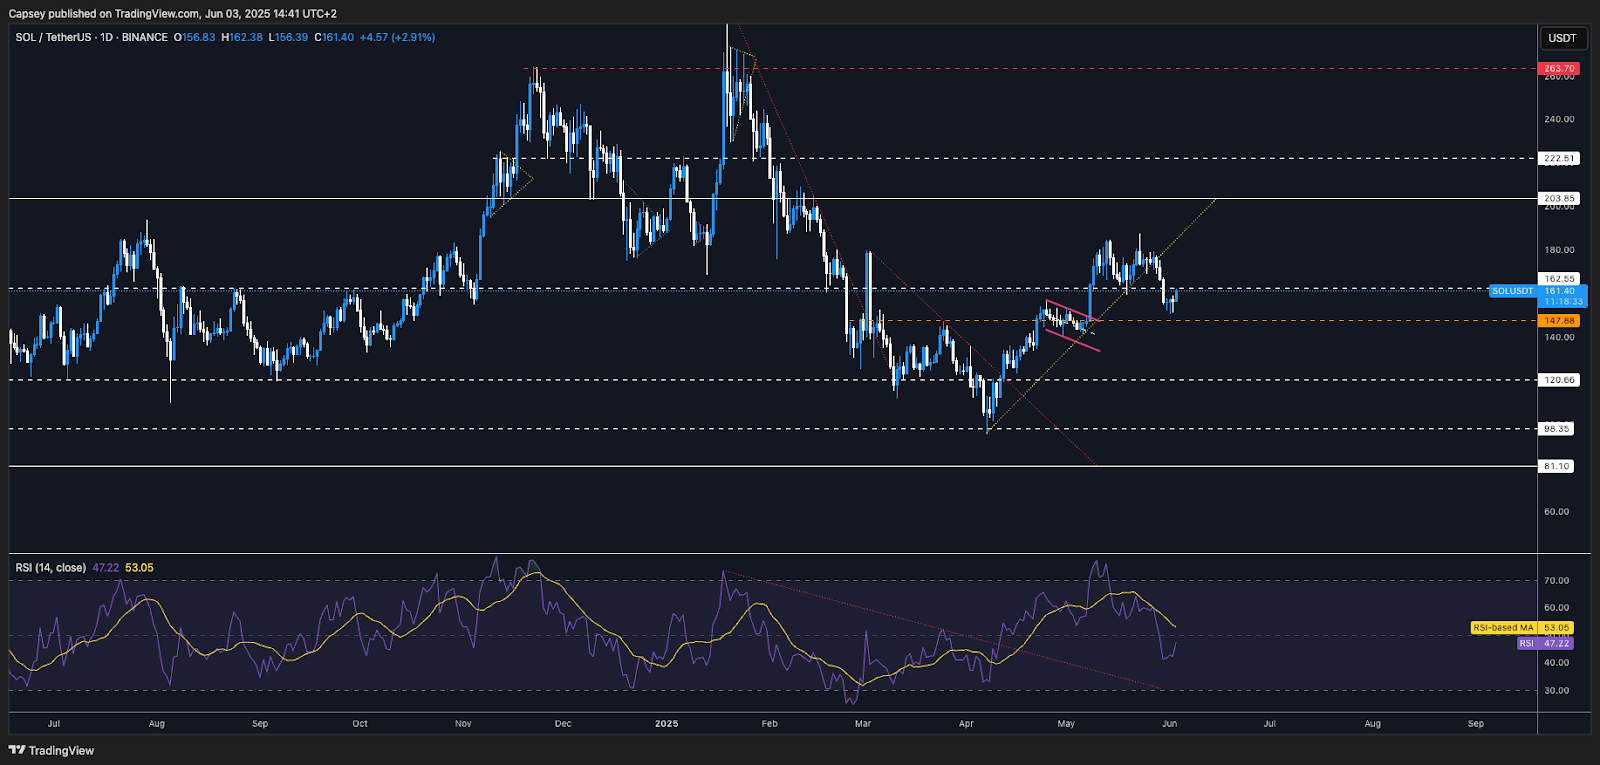
On one hand, ETH still looks good here, trading in its range between $2,420 and $2,720. But SOL has broken below its main uptrend line, and it's fallen below its key horizontal level of $162, with price now butting up against that level as a new horizontal resistance. For now, the signs point to this being a bearish retest that likely results in price going lower.
SOL 1D timeframe:
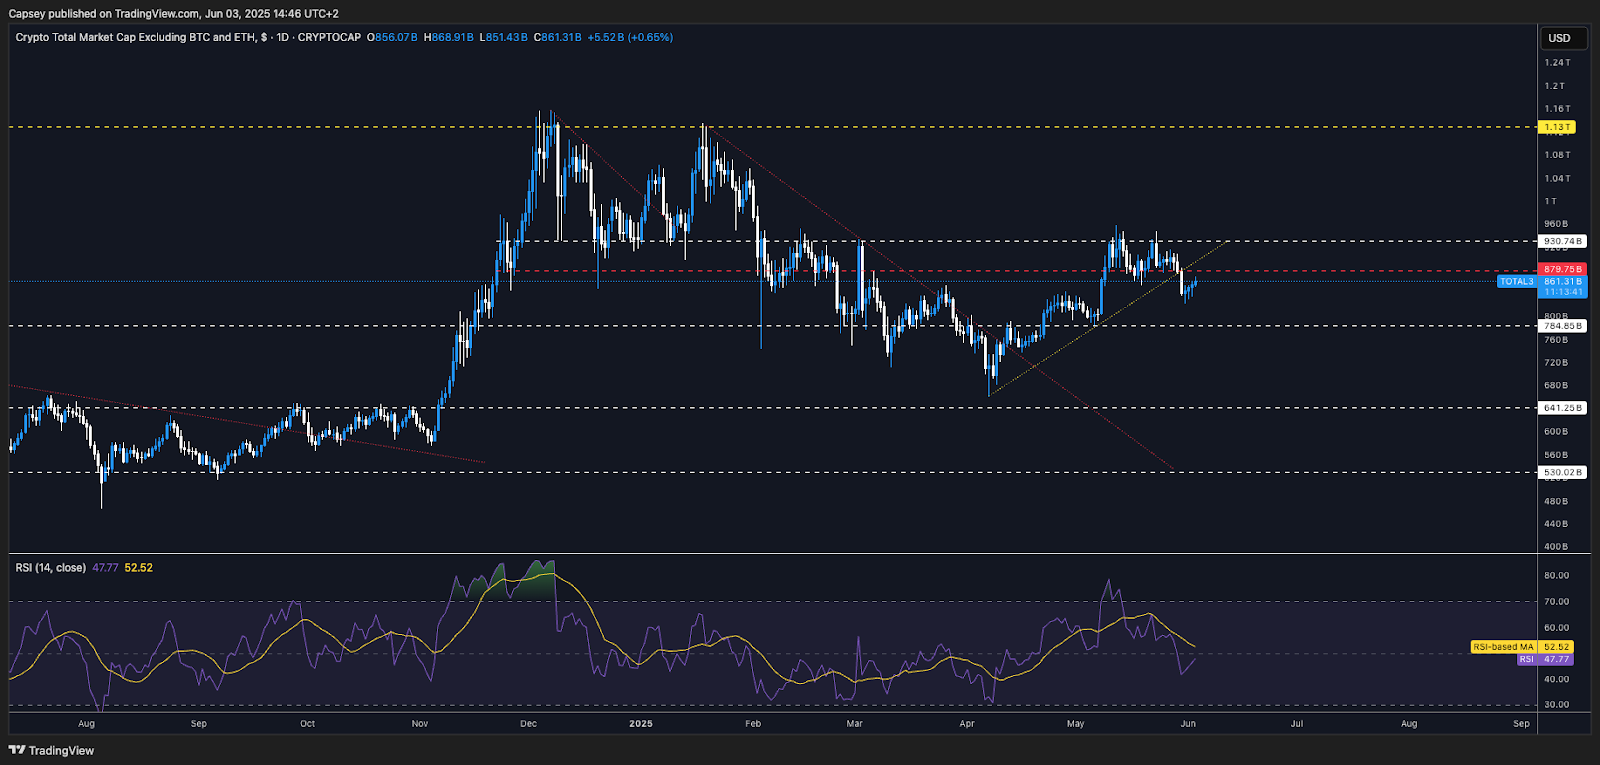
If we then zoom out to gage the alt/meme coin market as a whole, (and for that we use TOTAL3) we can see that price broke below its main uptrend line, with price now attempting to bounce but price remains below the key horizontal level of $879b. TOTAL3 also looks as if it's putting in a bearish retest – retesting the underside of the horizontal resistance, to then reject and breakdown further.
TOTAL3 1D timeframe:
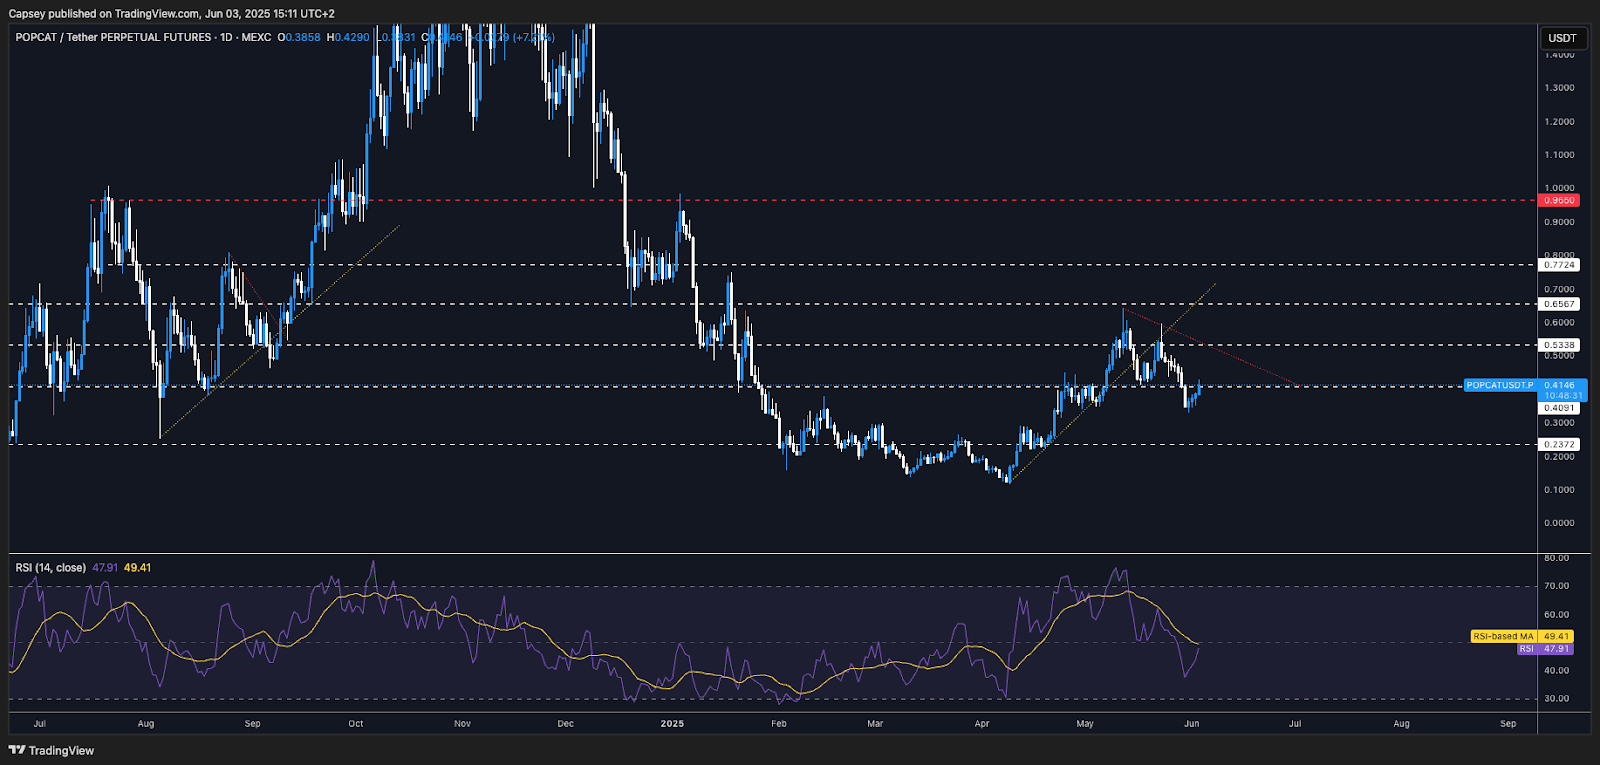
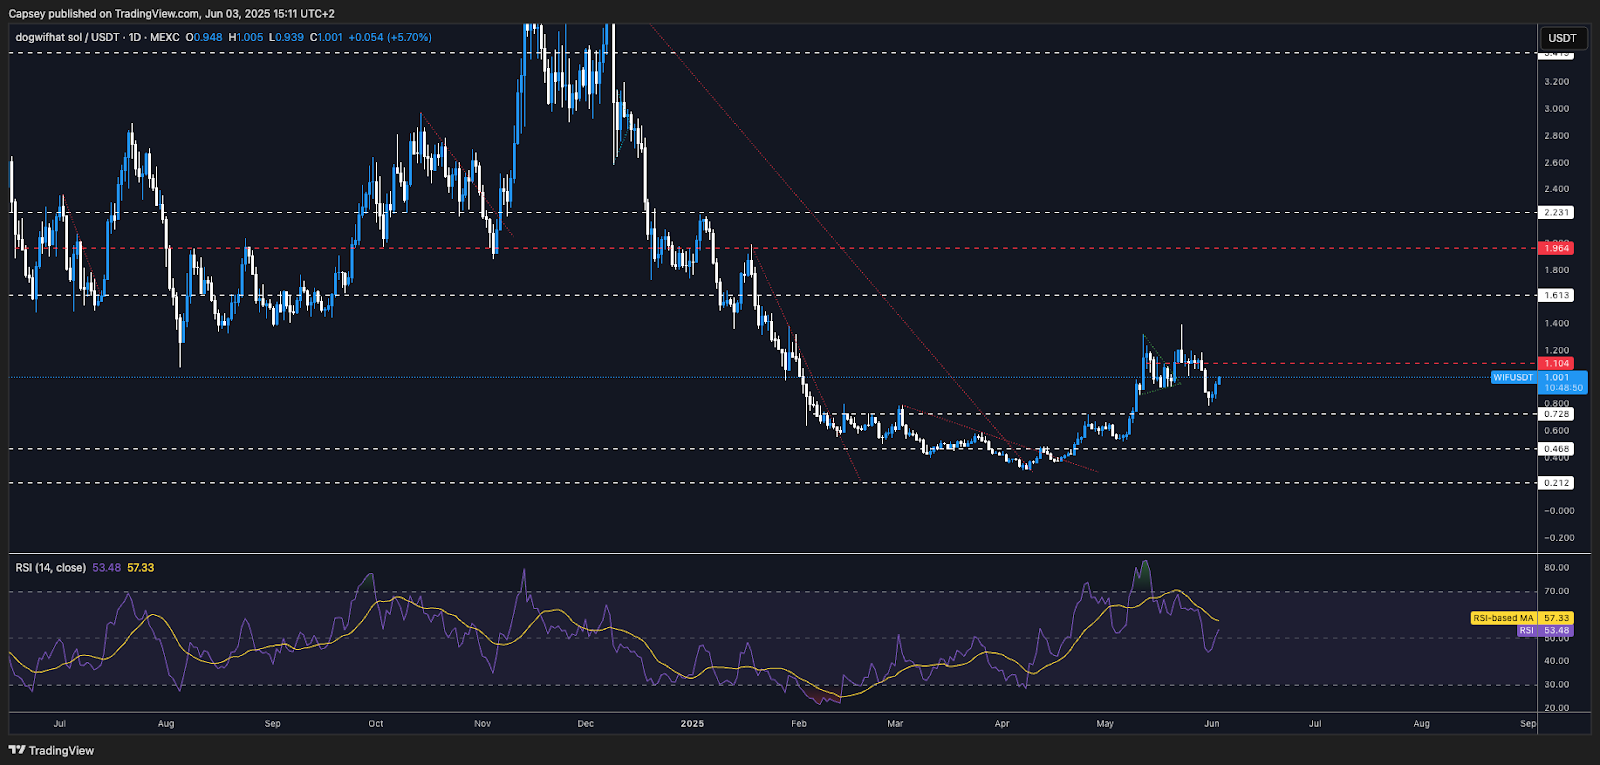
Alongside the above, some of the Major Meme's are also putting in bearish retests or they have broken below the main uptrend lines. Good examples of these are POPCAT and WIF.
POPCAT 1D timeframe:
WIF 1D Timeframe:
Cryptonary's take
We remain in market environment that has a high level of economic and policy uncertainty which is likely going to take some time before we have full clarity, which markets will likely need to move through all-time highs and go into price discovery. That clarity is going to either come from trade deals, or a breakdown in the hard data, resulting in the FED coming to the table and easing.In the meantime, BTC has broken down, falling below $107k, having been the standout performer in the last 6–8 weeks. And, whilst some Alts and Meme's have put in tremendous rallies recently, these rallies now look to have stalled and even broken down with their wider, more zoomed out structures now looking like bear market rallies.
Now this doesn't mean we're in for a 12-month bear market from here, but it might mean that we chop, and potentially even see much more substantial pullbacks throughout the summer until either the hard macro data breaks down, or we get clarity on the trade deals.
Therefore, our plan of action is this:
We're expecting prices to chop and pullback in the summer months of June, July and August, and we'll look to be buyers of the Majors in these periods. But we'll look to buy progressively meaning we buy positions and add to positions over time. So, think of it as we're playing the timeline (against the macro data and trade deals) rather than just solely playing against price.
Our initial target areas to begin adding some longer-term Spot bags are as follows:
- BTC: $95k
- ETH: $2,160
- SOL: $120
Recommended from Cryptonary


