Save 23% ($351) & Get a Free 1-1 Call with our Team ⏰ : 0d 2h 59m 43s
BTC, ETH, alts, and memes face tough resistance
As BTC retests resistance, ETH fights to hold support, and SOL pushes towards a breakout, the market remains in limbo. Can HYPE and PEPE find momentum? Here’s a deep dive into the latest price action and upcoming levels.

Disclaimer: This is not financial or investment advice. You are responsible for any capital-related decisions you make, and only you are accountable for the results.
BTC:
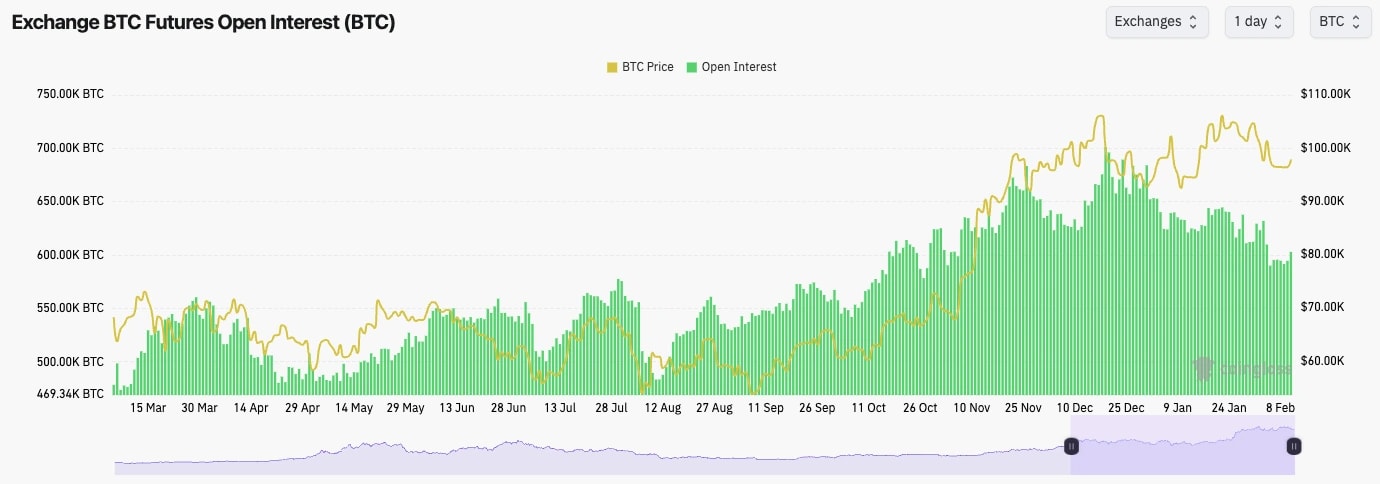
- BTC's Open Interest has kicked up from the lows, but only very slightly. Since the last week of December (OI highs), OI has reset by approximately 15%.
- BTC's Funding Rate has been fluctuating around neutral but it is gradually moving up to 0.01%.
- Overall, this is a positive leverage environment and we have seen a flushing out of the froth that did exist towards the end of 2024.
Technical analysis
- BTC has found some support at the horizontal support of $95,700.
- Price is now attempting to put in a small bounce, with price moving into the horizontal resistance of $98,900.
- If $98,900 can be broken to the upside, then the next level of resistance to watch would be $101,500 to $102,300.
- The RSI is in the middle territory but it is now butting up into the underside of it's moving average.
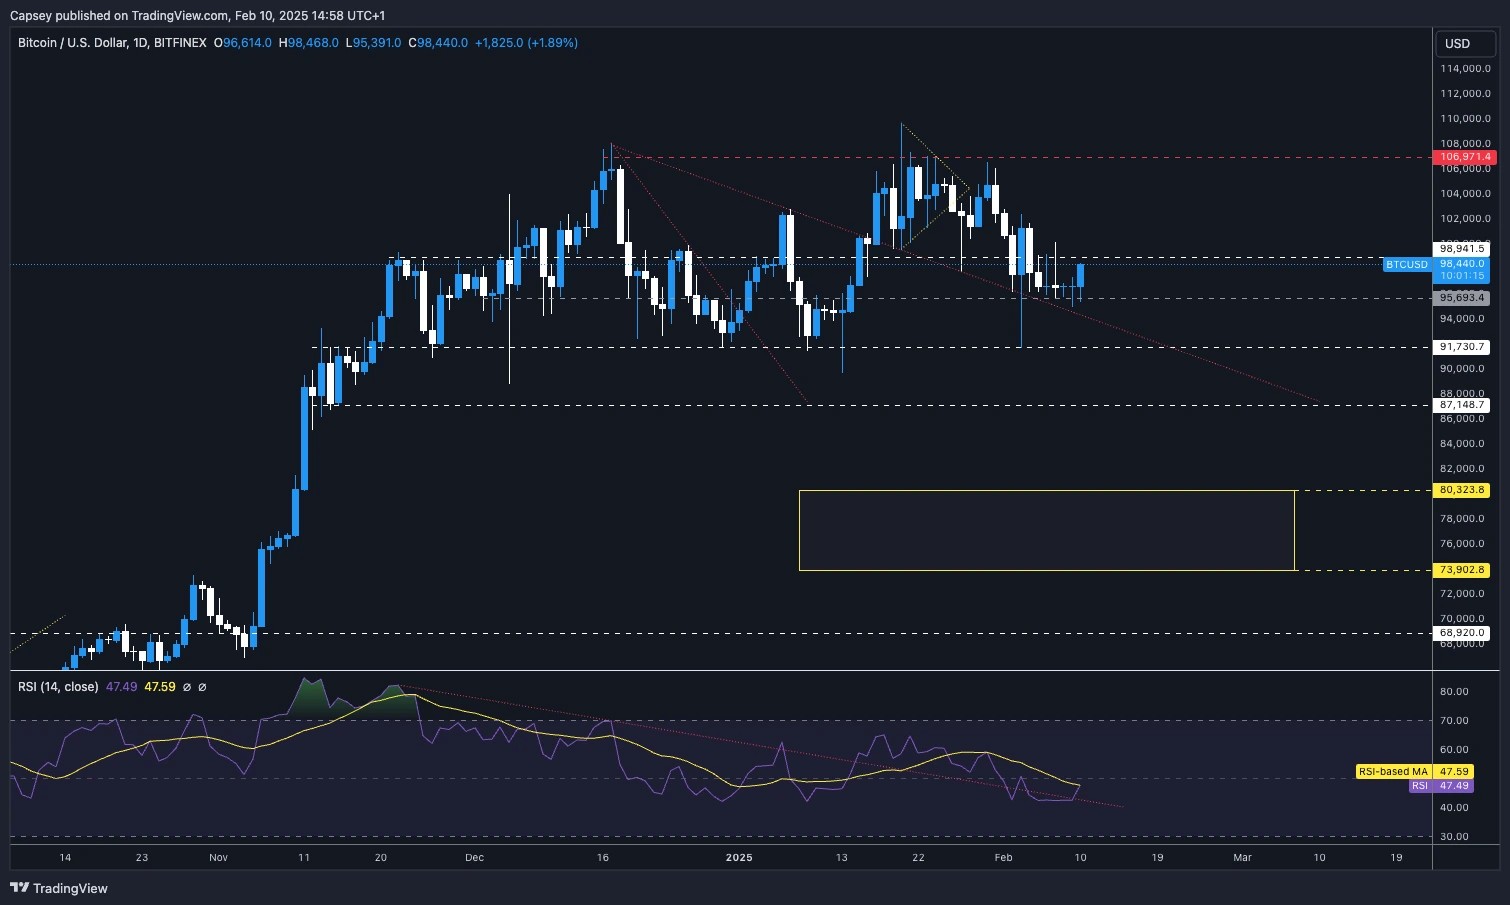
- Next Support: $95600
- Next Resistance: $98,900 (then $102k)
- Direction: Neutral/Bullish
- Upside Target: $102,000
- Downside Target: $91,700
Cryptonary's take
It is still our expectation that BTC is in a downward trend to sideways chop for the upcoming weeks, and maybe months. We view the current move as a slight relief rally.This is less the case for BTC, but particularly the case for Alts and Memes. In order for us to consider changing our stance, we'd need to see a convincing break of $104k or to see a real rapid change in the macro, which we're currently not expecting. We still expect $87k to $91k to be retested in the coming weeks.
For the traders; if BTC reaches $102k to $104k, this may open the door for a trade opportunity. A Short. However, if the price reaches those levels, we'll reassess at the time also.
ETH:
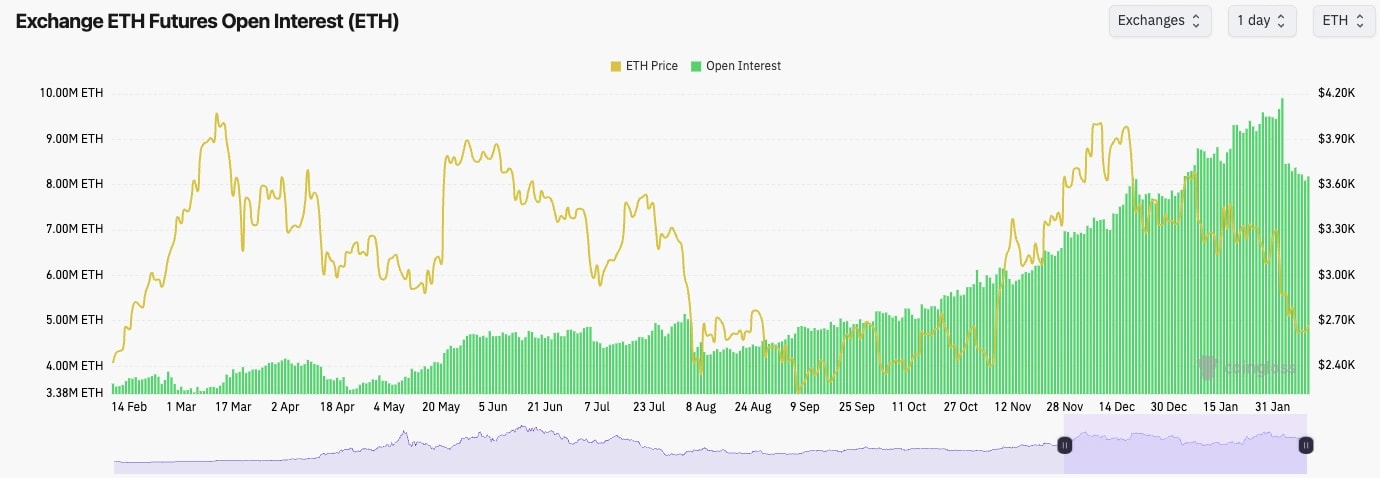
- ETH's Open Interest has been on a rapid increase until recently when we saw a 20% flush out on the large price move down over the first few days of February.
- ETH's Funding is similar to BTC, in that it has fluctuated around 0.00%, although it is now grinding up to 0.01% again, indicating that there is a slight bias amongst traders to go Long.
Technical analysis
- ETH fully filled our Yellow box, and the price actually broke below it. We had this as a target zone that has now been hit and hence removed.
- ETH has seemingly found support in the short term between $2,500 and $2,600.
- But, the major support is at $2,420. A breakdown below this level would be very bearish/negative, and it might take ETH a long time to recover.
- To the upside, ETH is below the two main horizontal resistances between $2,875 and $3,050.
- The RSI is very close to oversold territory, which is positive and might mean we could see a bounce but as of yet, we haven't formed any bullish divergences which are sometimes needed to see a more substantial relief bounce.
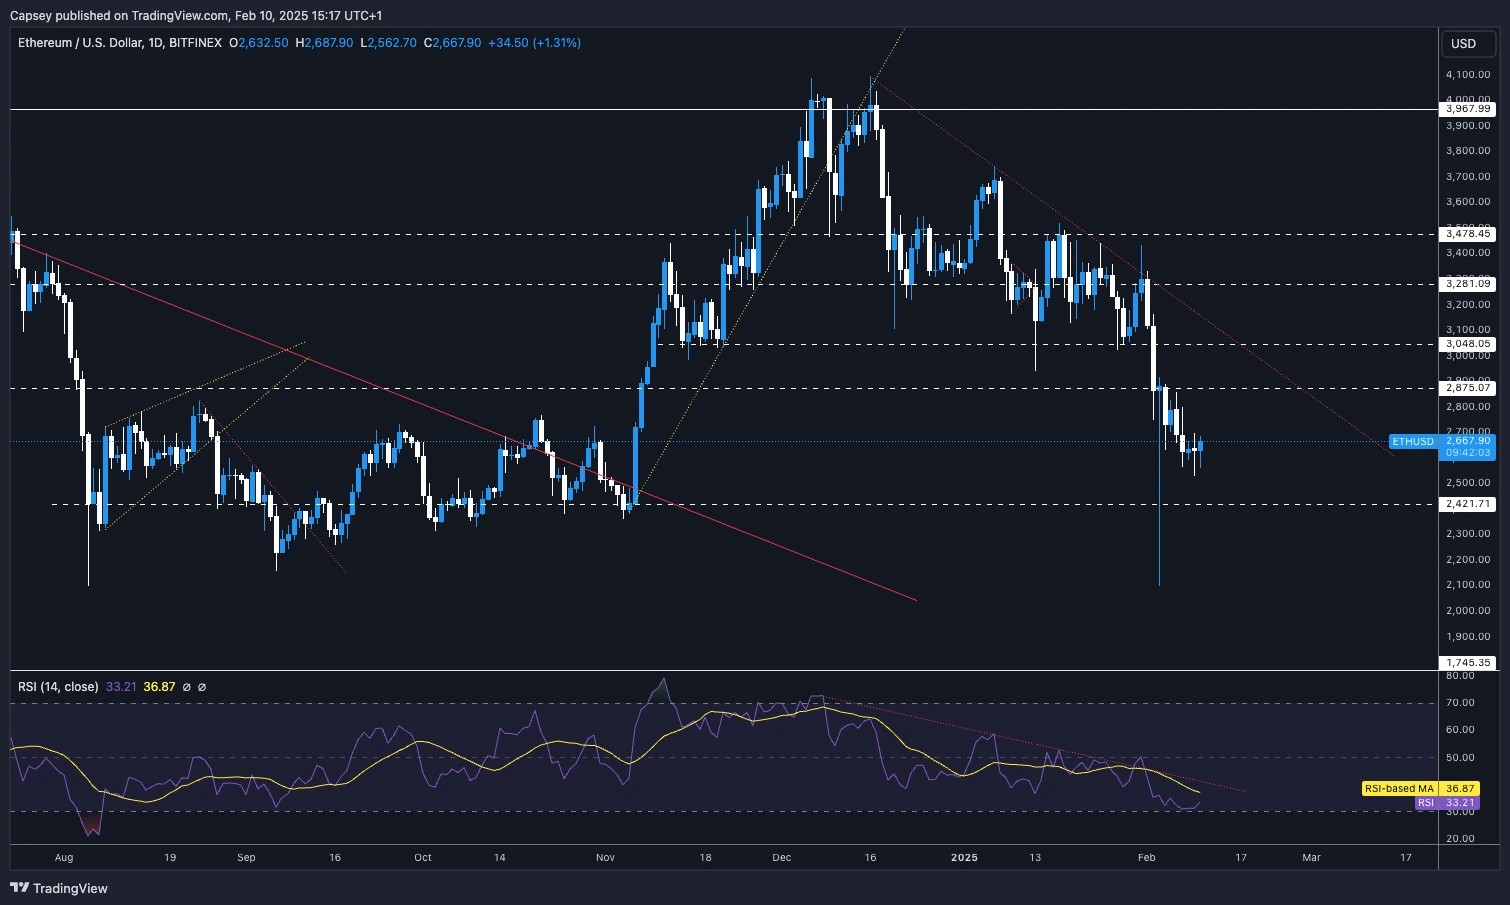
- Next Support: $2,420
- Next Resistance: $2,875
- Direction: Neutral
- Upside Target: $2,875
- Downside Target: $2,420
Cryptonary's take
Whilst ETH occasionally looks attractive for short-term trades, it's hard to be super positive on it in the immediate and medium term considering its overperformance (lack of upside when the market rises, and it pulls back matching the market when the market bleeds).ETH remains in a downtrend and below some key horizontal levels. We likely won't become interested in the short-term, until we see some of these components reverse, we'll instead remain patient on ETH. In the short-term, however, ETH might retest $2,800 if we see BTC move up to $102k say. But other than that, we're not too interested in ETH here.
SOL:
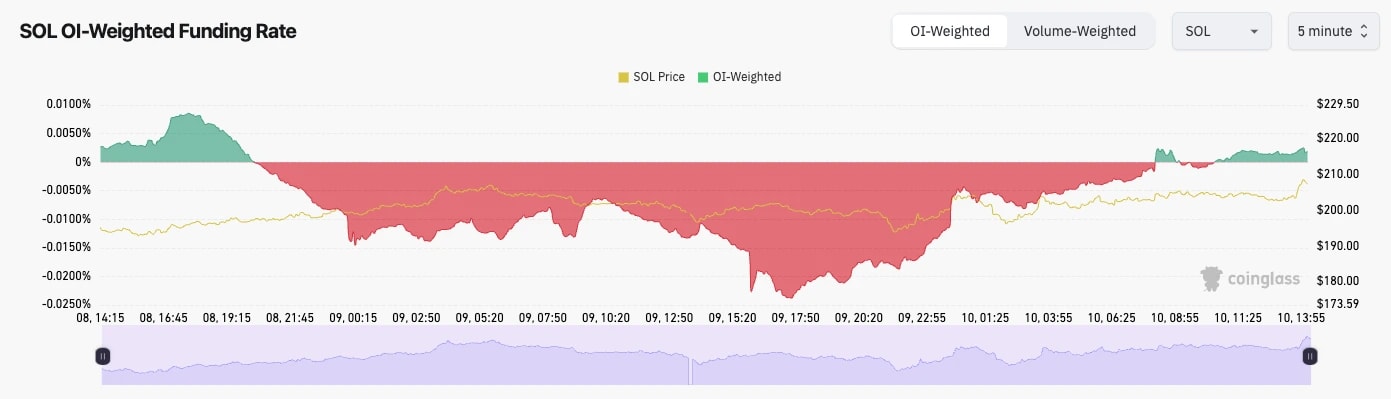
- SOL's Open Interest (by number of coins) has been generally downtrending since early January, and since the price spike, it's remained flat. This essentially means that there aren't many signs of froth currently.
- SOL's Funding Rate has fluctuated between slightly negative and positive, showing real indecision amongst traders. Funding was negative, and as price has ground higher in the last days, it's reset back to slightly positive.
Technical analysis
- SOL has found some support in the short term from an old level between $180 and $190.
- SOL is now attempting to break out of its downtrend line, and also reclaim the horizontal level of $203.
- If SOL can break out that might mean we see a further move higher, however, we think this might stall out around the horizontal level of $220 (the next horizontal resistance).
- The major supports are at $180 to $188, and then at $162.
- The RSI remains in a downtrend and it is now butting up to its moving average. The moving average and the downtrend may provide too much of a resistance from the price to break out from.
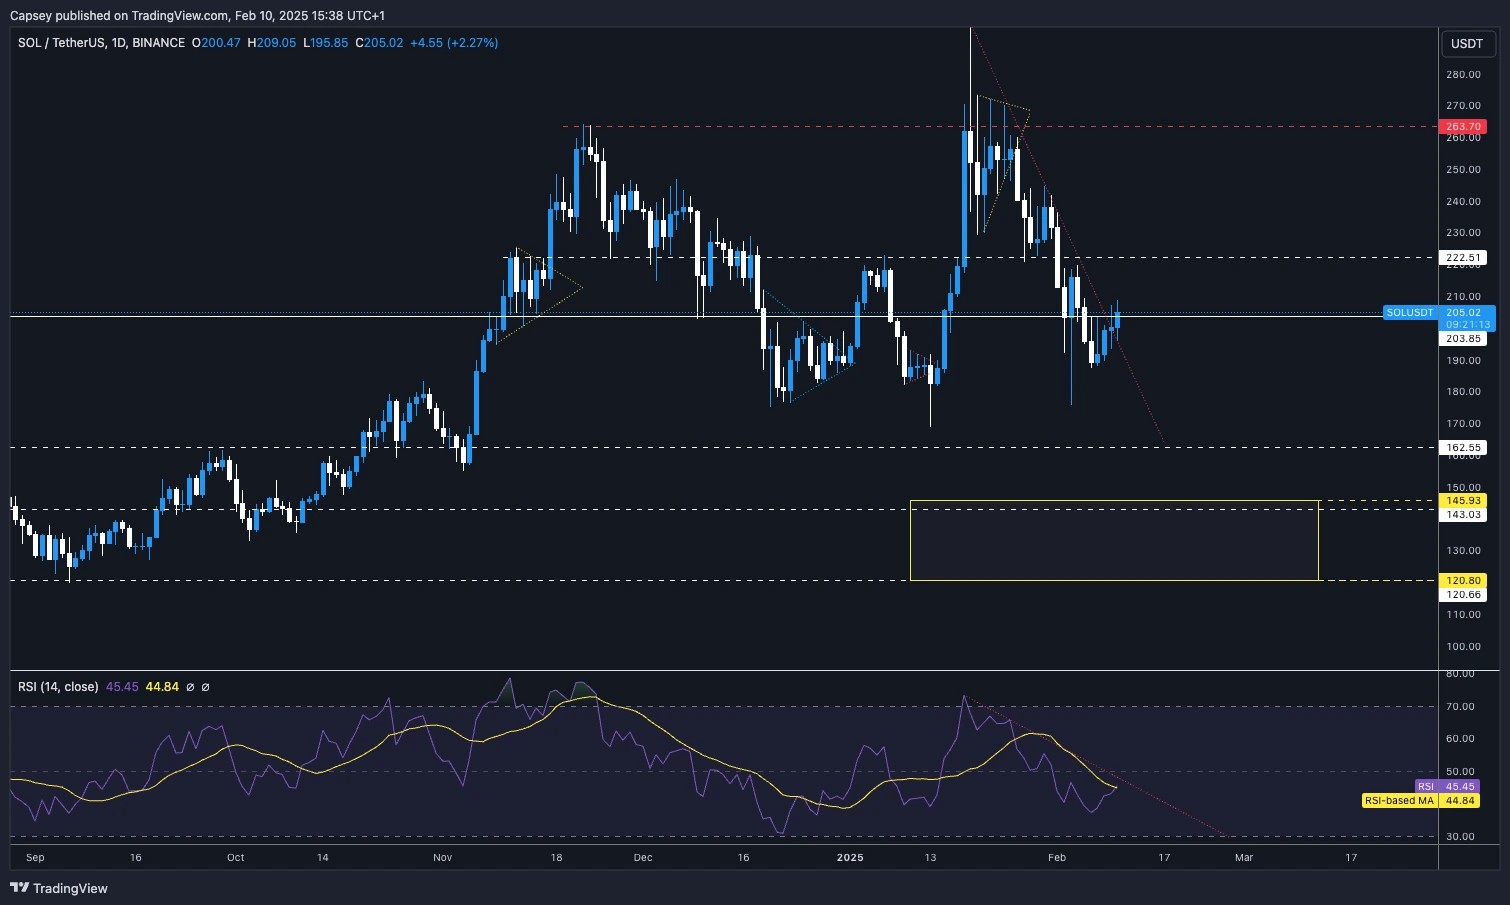
- Next Support: $180
- Next Resistance: $222
- Direction: Neutral/Bullish
- Upside Target: $222
- Downside Target: $180
Cryptonary's take
Price is at a key point here in that it's attempting a breakout. In the immediate term, we're unsure if SOL gets the breakout or not. But, if BTC can drive up to $100k to $104k say, then SOL could potentially see $222. However, we would expect $222 to be a local stopping point, and maybe an entry for a potential Short - but again, we'll reassess around the time.HYPE:
- HYPE is currently holding the $21 to $23 area relatively comfortably. This keeps us bullish on the asset whilst this structure holds.
- HYPE is now forming a wedge pattern, that could see us breakout in the coming weeks. However, this will likely need to be supported by positive market momentum.
- The $20 level remains the key horizontal support.
- A major breakout would come with a move above $26. That would set up a test of $28. A break out of this level, and $36 (previous all-time-highs) would be on the cards.
- The RSI has come into a tight range but in the middle territory. Although it is below its moving average.

- Next Support: $23
- Next Resistance: $26
- Direction: Neutral
- Upside Target: $28
- Downside Target: $20
Cryptonary's take
HYPE is an interesting chart here, and overall it's a play we like. However, it may take more time for this chart to develop/play out, and a breakout or a breakdown is likely dependent on the market conditions around the time the price moves into the pinpoint of the wedge. In the meantime, we'll remain patient, and continue to accumulate a bag around the lows - $20 to $22.PEPE:
- PEPE is showing an interesting chart now having fully retraced its Q4 2024 move higher.
- Price is in a general downtrend and it has also lost a number of key horizontal levels.
- Price is however close to a major support zone between $0.00000711 and $0.00000826. This zone would be the area we'd choose to potentially accumulate a position.
- The two key horizontal resistances are at $0.00001137 and $0.00001424. If the price can break out of the downtrend line and the $0.00001137 level, this would likely ignite the bullish reversal.
- The RSI was in overbought territory, and it's seeing its moving average as a resistance. We're yet to see a bullish divergence form, which might be what PEPE is looking for to then see more substantial upside.
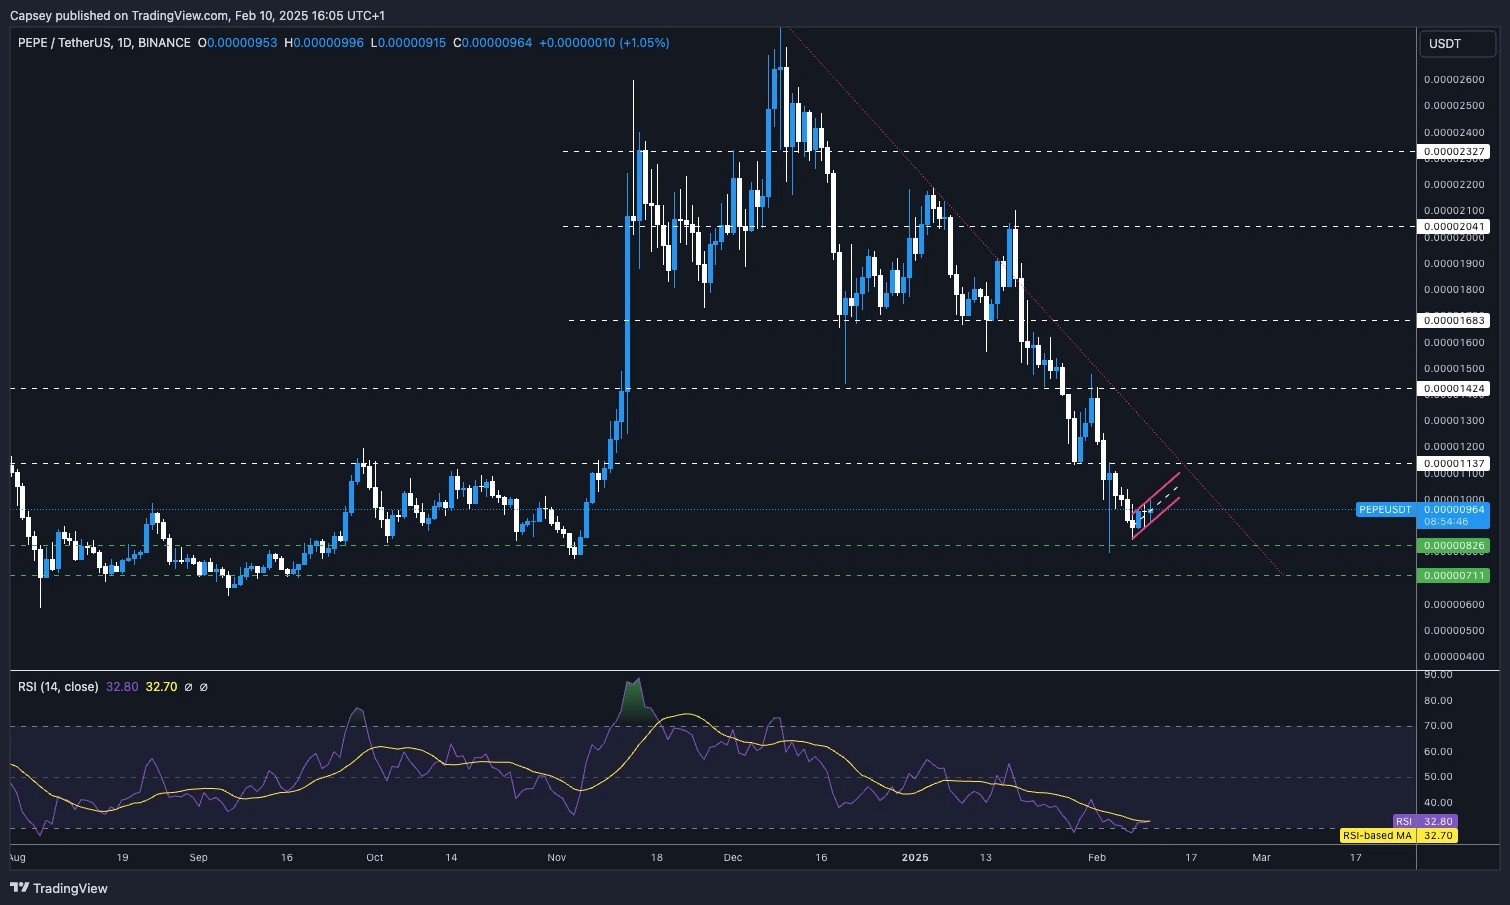
- Next Support: $0.00000826
- Next Resistance: $0.00001137
- Direction: Neutral
- Upside Target: $0.00001137
- Downside Target: $0.00000711
Cryptonary's take
We're watching PEPE with a more keen eye at the moment. However, we see that PEPE has to form a bottom and for that, we might need to see it grind out/flatten out between or just above $0.00000711 and $0.00000826.This will likely take more time, but this is the most likely way we'll see a bottom form. For now, we're not confident in any meaningful bounces (we might get a slight one, but that might arguably already have happened), so for now we remain patient.
Recommended from Cryptonary


