Save 23% ($351) & Get a Free 1-1 Call with our Team ⏰ : 0d 2h 59m 45s
BTC, ETH and More: A Weekly Close Below the 50-Week EMA
We’re entering one of the most important phases of this cycle. BTC has tapped its Yearly Open, macro uncertainty is rising, and the next prints leading into the December FOMC will shape the remainder of Q4. What happens here decides if this is the final shakeout, or the start of something bigger...

Hey everyone,
Update on our forecast: After the rejection at our resistance at $107.5k, BTC broke down and went directly to our next support area and Key level at $93.5k (Yearly Open).
Any deviation below $93.5k into the range low around $86k-$88k continues to have high odds of giving a 10%+ reaction and move up.
Until next FOMC meeting December 10th, BTC and ETH will react directly to whether the incoming data shows a “controlled slowdown,” which historically supports risk assets, or a more abrupt weakening that could pressure crypto before ultimately forcing the Fed into a more aggressive easing cycle. This next batch of macro prints is likely to define the tone for the remainder of Q4.
We have had persistent selling pressure since the start of November, and each bounce for BTC and ETH has been sold heavily.
November is historically the most bullish month for BTC, but for now, seasonality is nowhere to be found.
The big unknown: is this just the last shakeout before markets turn, or the early stages of a longer bearish phase for the crypto markets?
TLDR
- U.S. Government reopening
- Odds of ‘No Change’ for December Rates Cuts increased to 52% and are now higher than ‘25bps cut’
- BTC is currently taking support on our Key Level at $93.5k (Yearly Open)
- Bias: Bias: Cautiously accumulating - weekly technicals show damage, but macro setup (see Market Update) supports patient buying into year-end
Let’s dive into the charts and find the key levels.
*These levels are valid through Sunday Nov 23th. Fresh analysis next Friday.*
Disclaimer: This is not financial or investment advice. You are responsible for any capital-related decisions you make, and only you are accountable for the results.
BTC
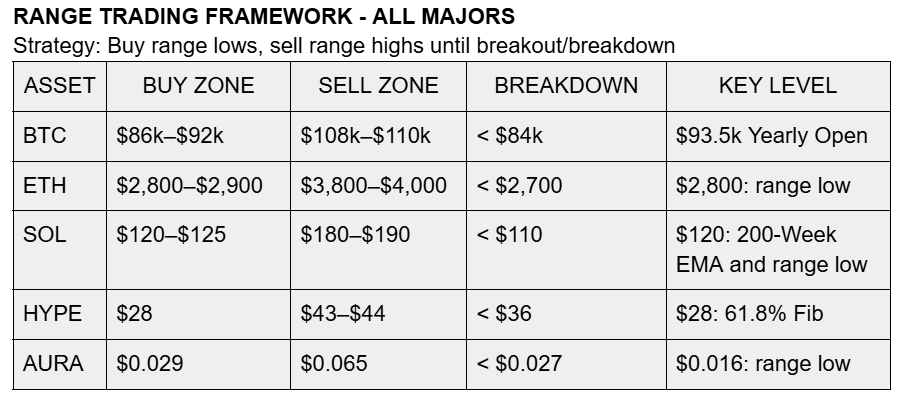
- Price Range: $86,000 – $110,000
- Bias: Neutral
- HEDGE positions if BTC retest $108-$110k. BUY a deviation below 93k into range low.
- Resistance: $108,000 – $110,000
- Current Support area: $85,000 – $92,000
- Breakdown Trigger: $84,000
- Closest Support in case of Breakdown: $76,000
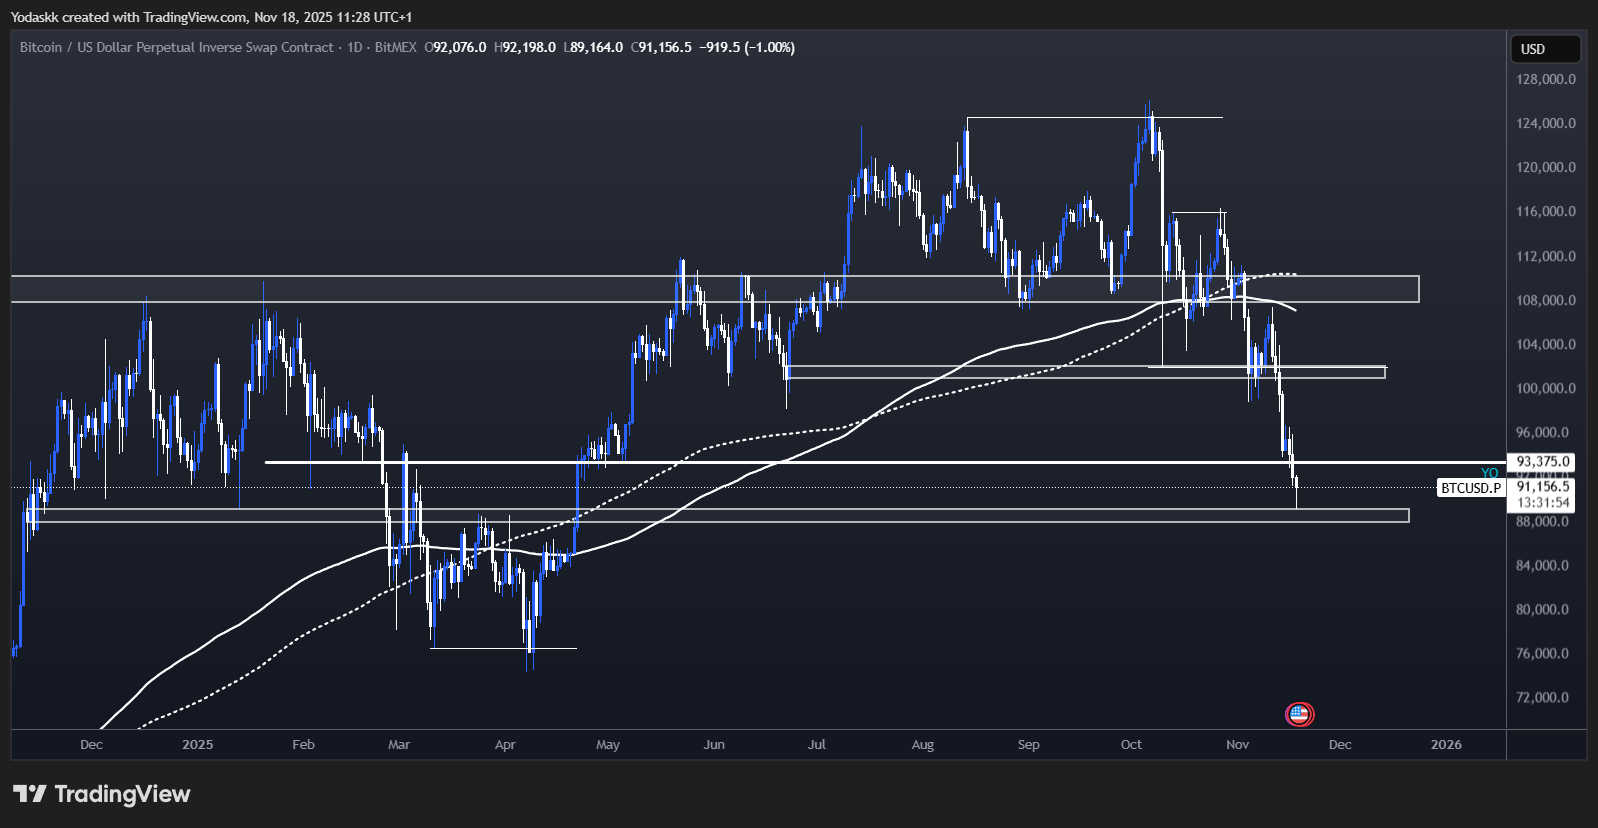
Following our analysis in previous Market Directions, we got the SFP we expected at $100k-$102k.
The SFP worked out as we got the reaction with BTC going directly into our next resistance at $107.5k.
The reaction around our resistance at $108k-$110k was key, as we got a quick rejection and the continuation of downtrend. This resistance zone remains a key area to be breached for any talks of future bullish continuation.
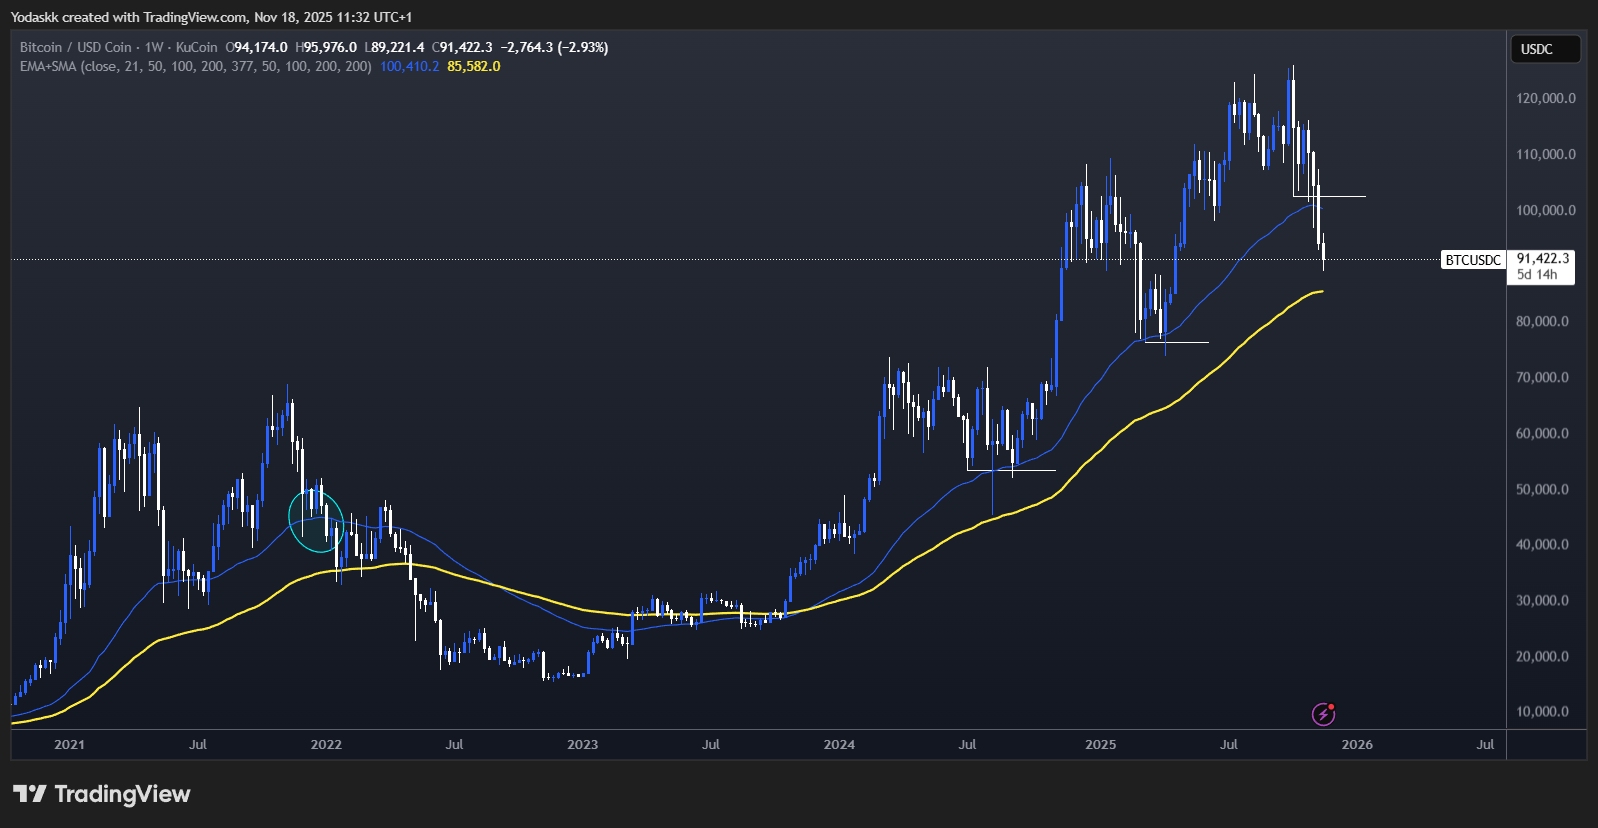
BTC closed below our support at $100k-$102k and also closed below the 50-Week EMA. This weekly close damages our bullish thesis since it’s a change of character for BTC on high timeframes.
We are just below the support area at $93k, where the Yearly Open is (Key Level).
A deviation below $93k into $86k-$88k would probably be a good buying opportunity if presented. By the way, the CME gap around $92.5k is now closed.
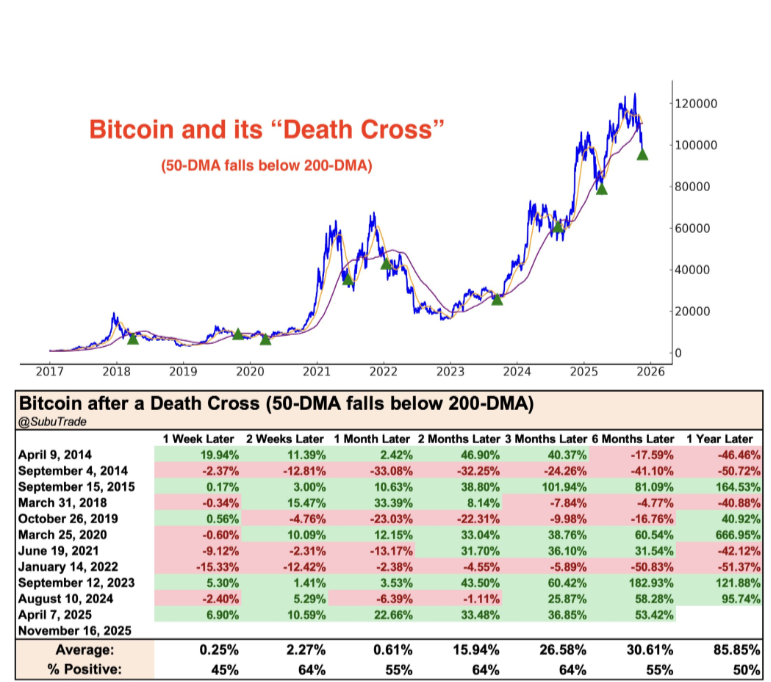
We just got a Death Cross this weekend (50-day SMA < 200-day SMA). Each time we've seen this during the bull market, it marked local bottoms. This increases odds that any deviation below $93.5k in the next few days would be the local low.
The last 3 times we got it during this bull market, it was the start of the next bull phase.
Even when we got it at the beginning of the 2022 and the 2018 bear markets, we still got a bounce around the Death Cross, where the 200-Day SMA capped the upside.
This is why from now on, the 200-Day SMA will be crucial in assessing if the next bounce is a bear market rally, or the start of a new impulse going into new highs.
Here are some interesting data regarding the BTC Death Crosses since 2018.
First very interesting thing: 100% of the time, BTC retested the 200-Day SMA within a few months (even in bear markets !).
This confirms the importance of the 200-Day SMA from now on.
Second thing: the highest %Positive are between 2 weeks to 3 months, roughly. This means that there is high odds that next bounce could:
- Retest the 200-Day SMA
- Take 2 weeks to 3 months to get there.
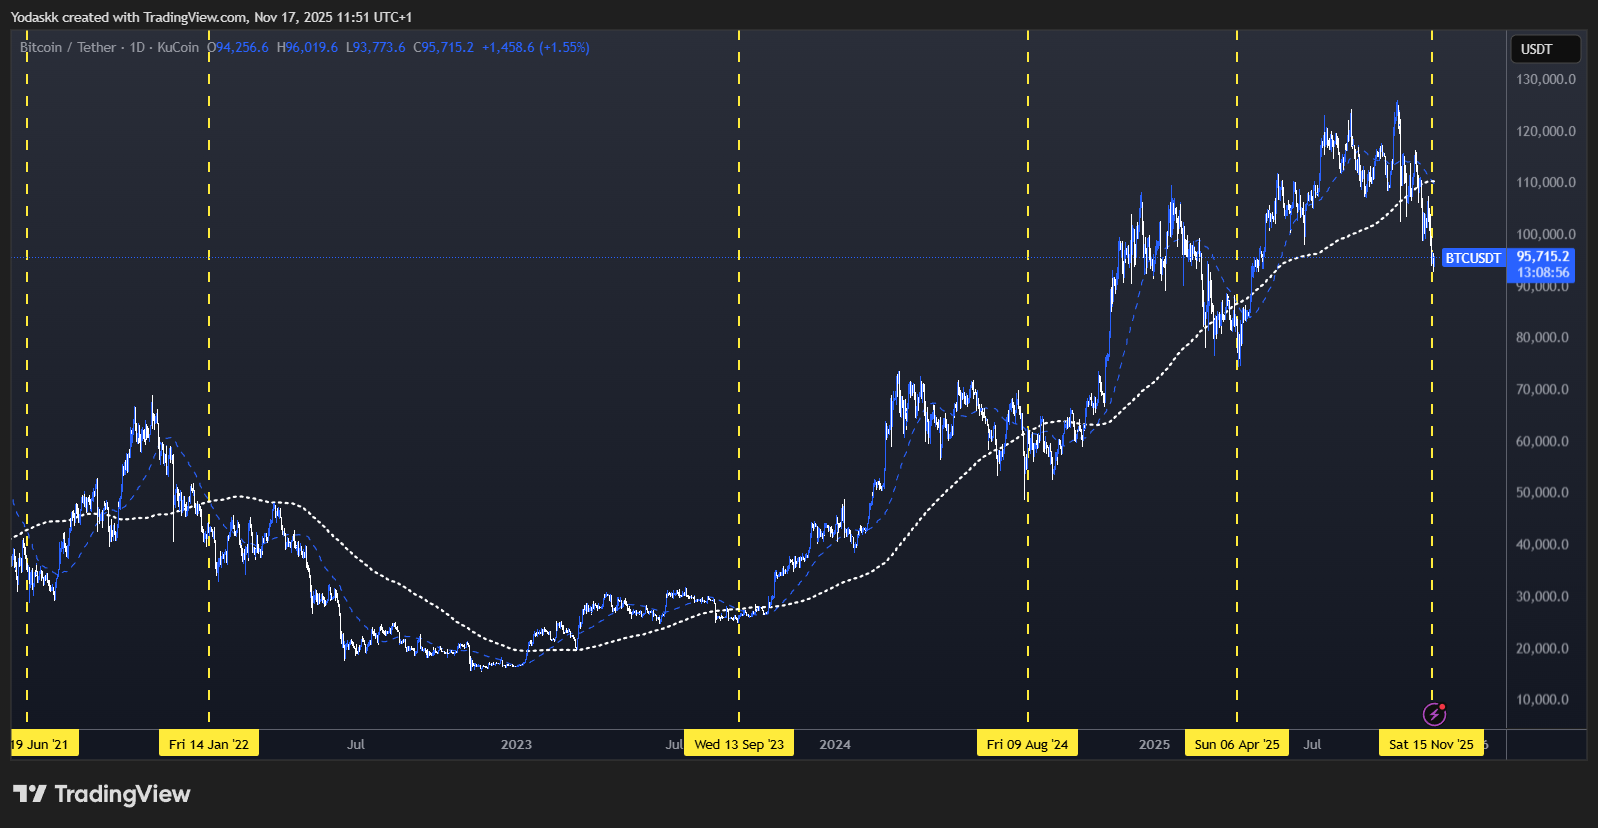
On the weekly chart, the 3 previous big corrections BTC had since its 2022 lows always followed this playbook:
- Form a low
- SFP (Swing Failure Pattern) of the previous low while retest the Weekly 50 EMA
- Continuation of the uptrend
This is an important change in BTC behavior that warrants caution.
On a close below the 50-Week EMA, we would expect the next EMA, the 100-Weekly EMA (in yellow) at $85.5k, to provide support for a bounce.
However, as detailed in today's Market Update, the 2026 macro setup (dovish Fed chair, Big Beautiful Bill, midterm dynamics) suggests this is more likely a deep correction than a bear market start.
The key difference from 2022: back then, we faced a tightening Fed with no fiscal support. Now, we're heading into an easing cycle with major fiscal stimulus. This changes the risk/reward - making patient accumulation at lower levels attractive, even if we see more chop into mid-December.
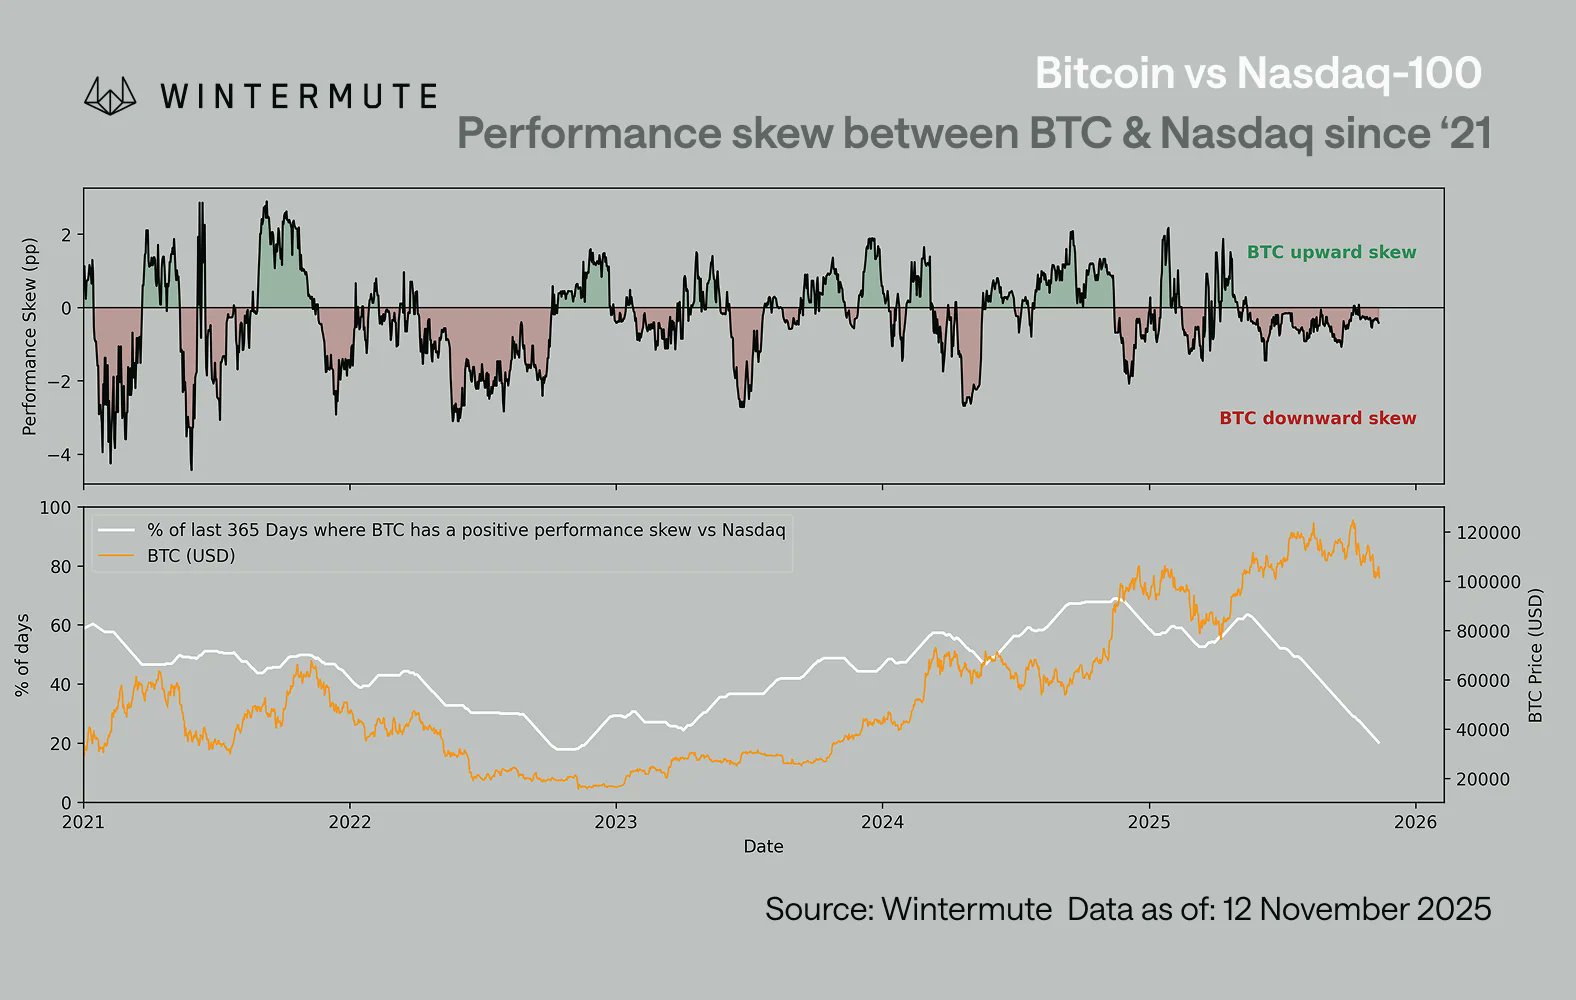
BTC's performance skew (Wintermute chart) is structurally negative: falls harder than it rises, similar to 2022. High correlation with Nasdaq (~0.8) means equity weakness = crypto weakness.
Liquidity Analysis: Yearly Open is a Key Level
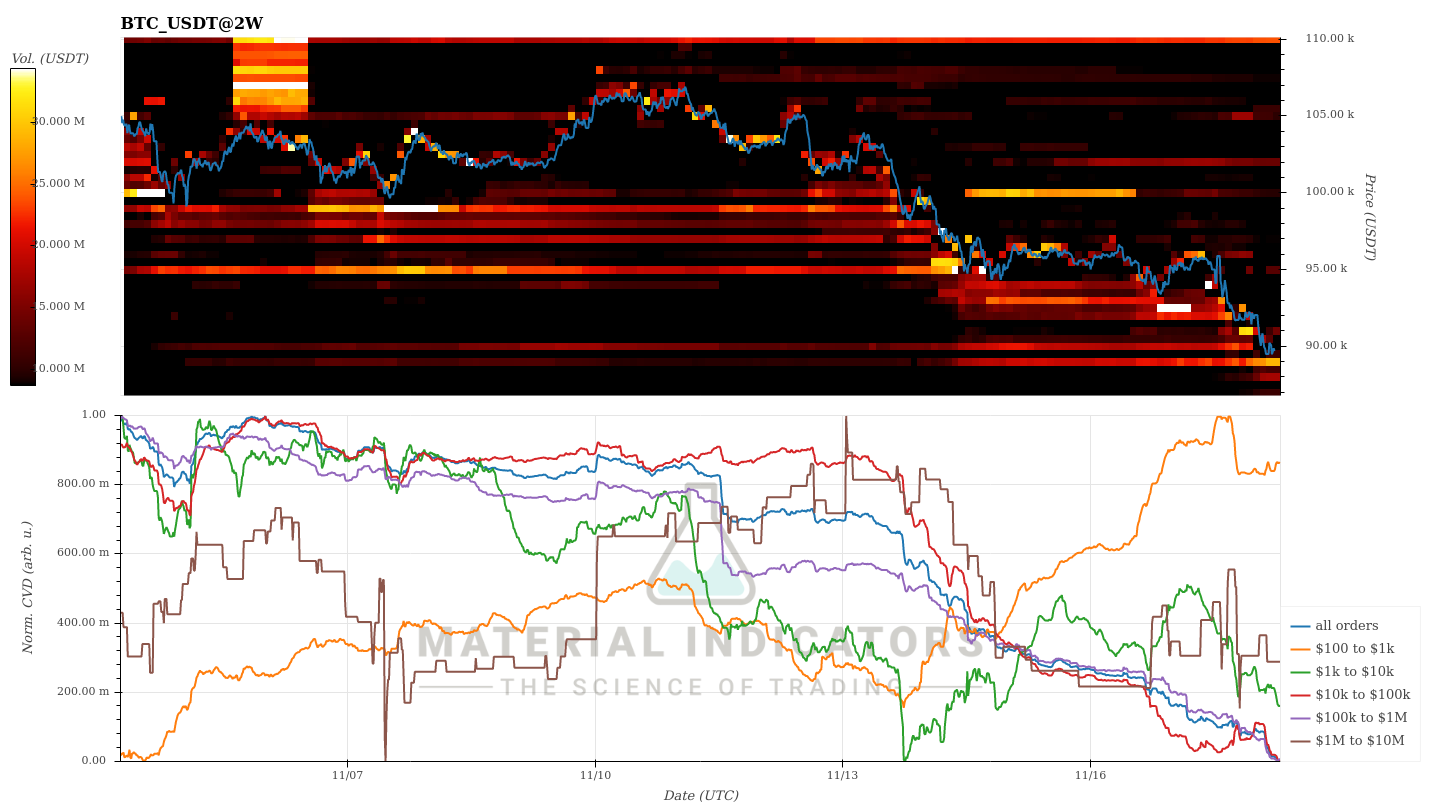
Looking at the BTC order book heatmap reveals interesting dynamics:
-
- Fake Pressure: A large sell order appeared around $95k that "walked" price down until price was around the Yearly Open at $93.5k, then mysteriously disappeared. This wasn't organic selling: someone wanted to push BTC lower WITHOUT getting filled.
- Plunge Protection: A large bid appeared around Yearly Open and then moved just above $92k as soon as the Yearly Open got tested.
- Local SFP (hourly) and move in the opposite direction: Plunge protection worked and price quickly reversed to above $96k.
-
- Plunge Protection disappeared: The large bid disappeared, leaving the possibility of a retest and move below the Yearly Open.
- Legit Seller Pressure: Since the rejection at $107.5k resistance, we can see an increase in sell order from $110k and below. Those sell orders seem legit, which put pressure on BTC.
- True Demand: There is true demand below the Yearly Open, with legit spot bids getting filled.
We expect a bounce soon to above $100k. While our base case aligns with the Market Update's 2026 bull thesis, here's what would validate that view and suggest a continuation of the bull:
The bullish view would be confirmed if we see:
Technical Signals:
- BTC breaks and closes above 110k on daily chart (3+ closes)
- Volume confirms breakout
- Weekly close above weekly 21+50 EMA
- Daily close above 200-Day SMA (3+ closes)
Flow Reversal:
- ETF inflows continue to turn positive for 3+ consecutive days
- DATs with mNAV < 1 reversal for 3+ consecutive days
Macro Shift:
- DXY continuation below $96
- Fed speakers adopt decisively bullish tone
For detailed flow analysis and what catalysts would bring institutional buyers back, see our Market Update (published today).
See individual asset sections below for detailed analysis.
ETH
- Price Range: $2,800 – $3,900
- Bias: Neutral to Bearish
- Wait for $2,800-$2,900 dip to buy. Hedge if retest of $3,800- $4,000 zone.
- Resistance: $3,800- $4,000
- Support Zone: $2,800-$2,900
- Breakdown Trigger: $2,700

ETH broke back below the $3,800-$3,900 Key Level on the weekly, ETH is now back in the $2,800-$3,900 range.
To be bullish again, ETH needs to close above the range and get above the resistance at $3,800-$4,000.
Breaking the $4,250 resistance zone would make ETH very bullish again, opening the path to All Time Highs.
The $2,800 area is a Key Level and a bounce around this level could lead to an underside retest of the 200-Day SMA or top of the range.
A breakdown below $2,700 and next support is around $2,100.
SOL
- Price Range: $120 – $190
- Bias: Neutral to Bearish
- Add if dips to $120 – $125, Hedge if retest of $180 – $190 resistance.
- Resistance: $180 – $190
- Support Zone: $120 – $125
- Breakdown Trigger: Break below $110
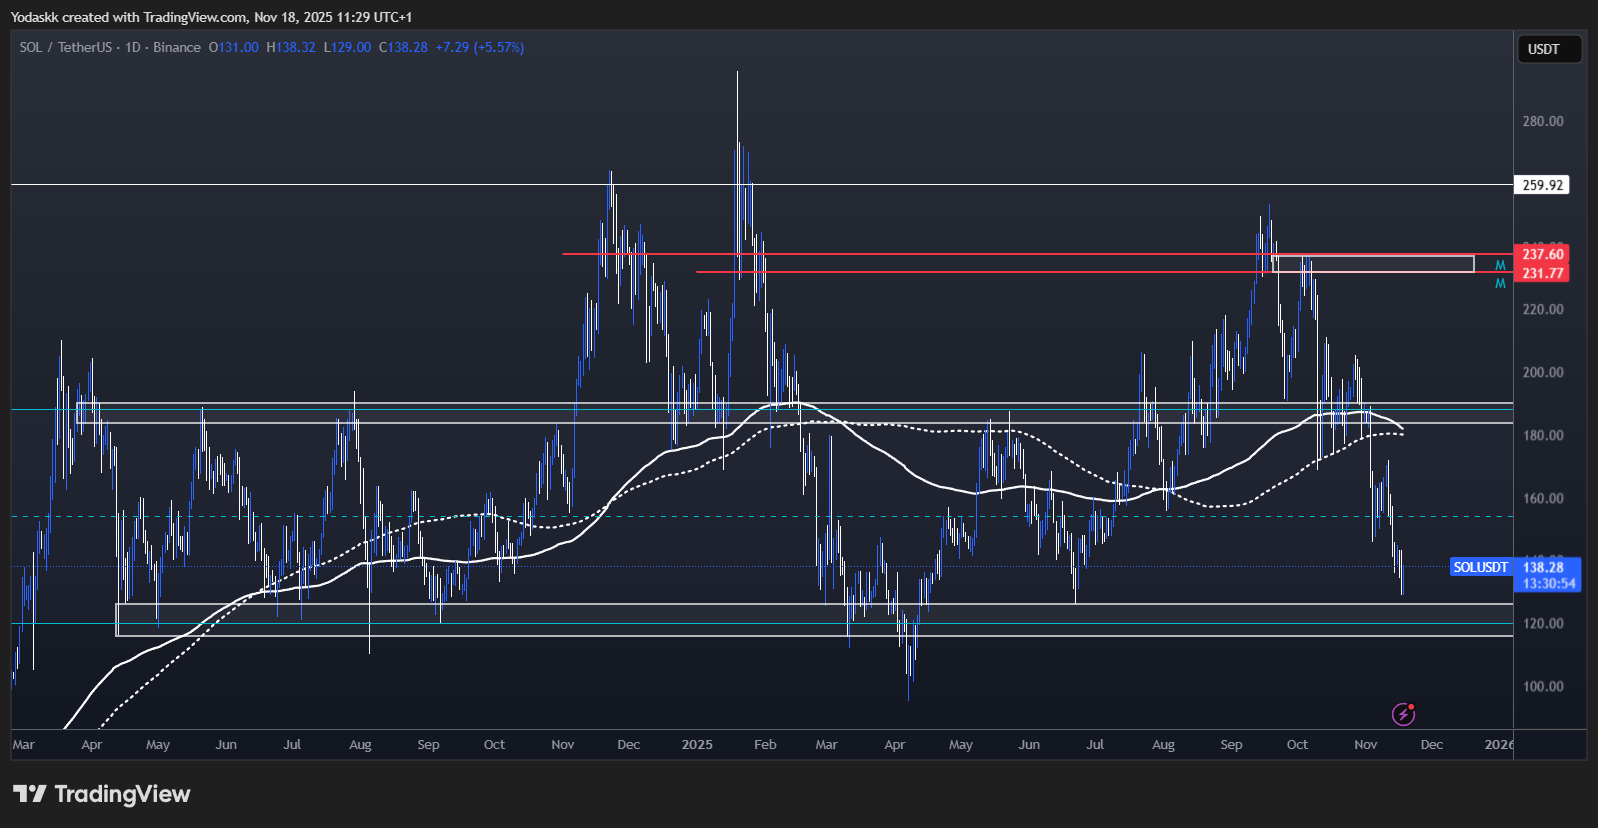
SOL continued its downtrend that started mid-September,as we continue to get lower highs and lower lows on the daily.
SOL broke down back into the $120-$190 range and is currently sitting at $140 after breaking below the mid-range at $153.
To be bullish again, SOL needs to reclaim above the top of the range at $190.
Next support is around $120–$135, which is the bottom of the range and also the 200-Week EMA.
The $120 area is a Key Level and a bounce around this level could lead to an underside retest of the 200-Day SMA and the top of the range.
HYPE
- Price Range: $28 – $44
- Bias: Neutral
- Add if breaks $44. Strong Buy below $28.
- Resistance: $43-$44
- Support Zone: $28
- Breakdown Trigger: Break below $36
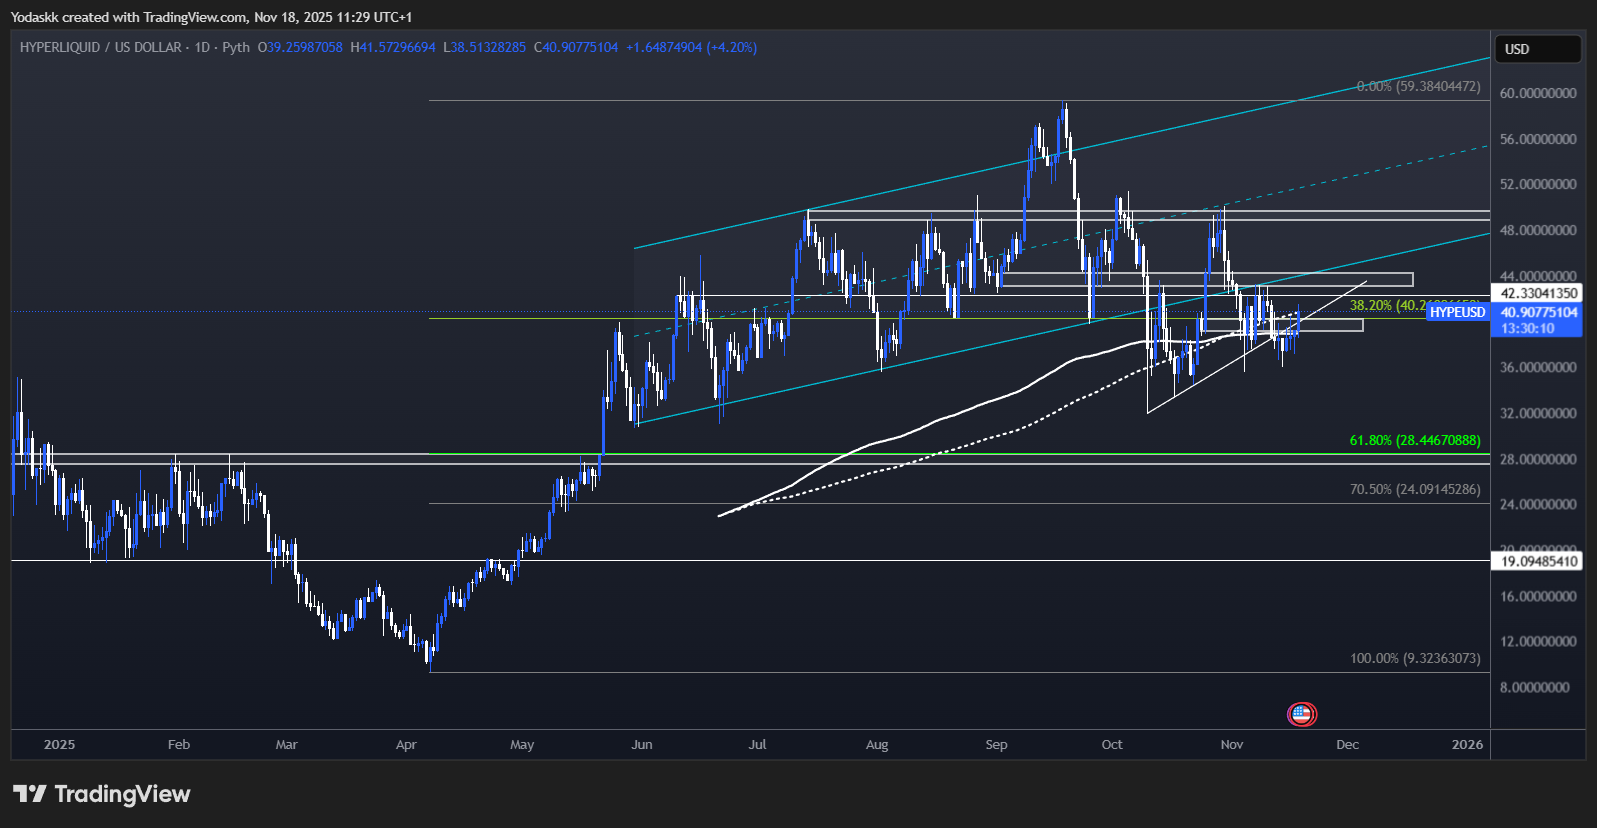
HYPE is around $40 and is consolidating around the 200-Day SMA+EMA after being rejected by the $43-$44 resistance.
A break of resistance around $43-$44 and we would target mid-channel around $49- $50 again.
A close below $36 would give more credit to the bearish thesis as it could retest the lows, and the next big support would be around $28.
That would be an incredible buy point, as $28 is both an important horizontal support and the 61.8% fibonacci retracement of the entire $9- $59 move (the 61.8% Fibonacci retracement is a key technical level marking a strong potential reversal point where price tends to bounce or reject within a trend).
AURA
- Price Range: $0.016 – $0.065
- Bias: Neutral
- Wait for $0.065 reclaim or buy $0.029 and $0.016 if given.
- Resistance and Key Level to Reclaim: $0.065
- Support Zone: $0.029
- Breakdown Trigger: Break below $0.027
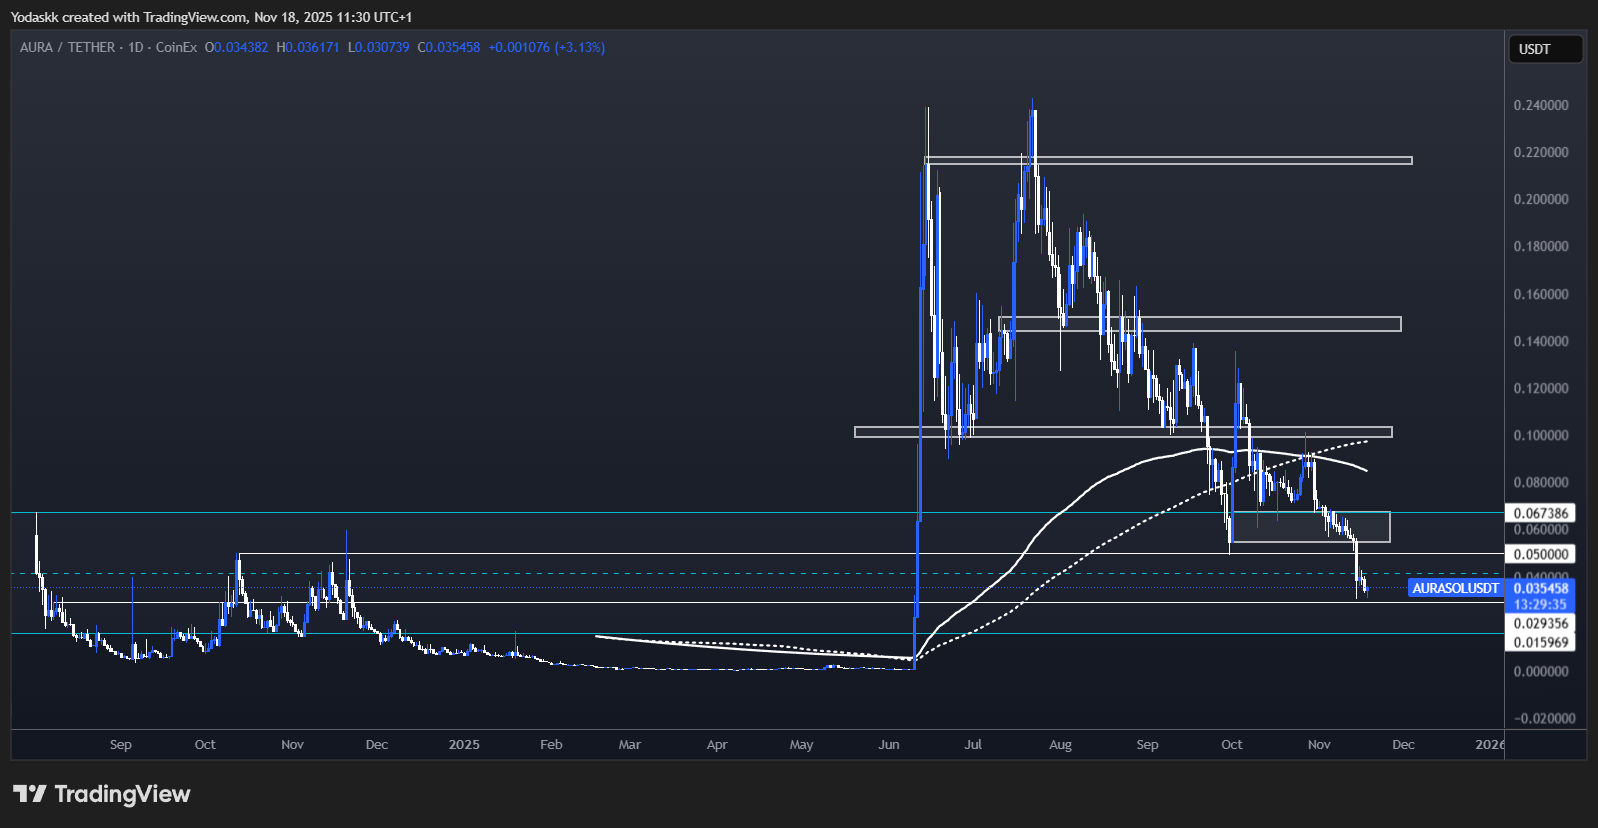
Since the last Market Direction, AURA finally broke the $0.055–$0.065 support zone (daily orderblock support), which invalidates the Adam & Eve pattern.
AURA went directly for the next support after $0.05 which is around $0.03. This presented an attractive buying opportunity as it bounced 20% from the lows.
Reclaiming $0.065 would be the first step to signal a bullish shift. A confirmed breakout above the $0.10 resistance and we would probably move fast toward the $0.15 level and beyond.
If AURA breaks below $0.029, next support is the range low around $0.016.
Cryptonary’s Take
Since BTC got rejected at $107.5k by our resistance last week, we got a close below the 50-Week EMA Sunday, which is a change of character for BTC.Since BTC closed below the 50-Week EMA, we're in a more uncertain technical environment than previous cycle dips. The Death Cross analysis suggests we're likely near a local bottom, with a high probability of a bounce to retest the 200-Day SMA over the next 5-12 weeks.
However, as detailed in our Market Update, the 2026 macro setup supports patient accumulation at these levels rather than derisking. Our strategy reflects this: scale into positions at $86k-$93k, take partial profits at $108k-$110k to lock gains, but keep the majority position for 2026 upside. We're not looking to exit entirely unless we see clear invalidation.
After the BTC Death Cross analysis, BTC should be close to a local low (probably between range low around $86k and Yearly Open at $93.5k)
Current assessment: 70% probability the $86k-$93k area lead to a bounce to retest the 200-Day SMA as high as $108-$110k based on:
- Yearly Open at 93K is a Key Level
- 50/200 Daily SMA Death Cross analysis
- 86k-110k range play
Action: Add below Yearly Open, as per our analysis:
- Option A: Wait for a deviation below and reclaim of the Yearly Open at $93k (safest)
- Option B: Buy as close of the range low around $86k-$88k as possible (more aggressive)
- Accumulation Zone (Now): Scale into BTC at $86k-$93k, especially on deviations below Yearly Open
- Partial Profit Zone ($108k-$110k and 200-Day SMA): Take some profits to lock gains if we form a lower high
- Re-Add Zone (Above $110k): If BTC breaks above $110k and 200-Day SMA with volume for 3+ days, add back the profits taken
- Invalidation (Below $84k weekly): Full reassessment required
For institutional flow data, ETF tracking, and macro catalysts: See Market Update published today.
Thanks for reading!
These levels are valid through Sunday, November 23th. Fresh analysis next Friday.
Video Timestamp:
- BTC: 0-11min30
- ETH: 1min30-19min20
- SOL: 19min20-25min50
- HYPE: 25min50-30min20
- Aura: 30min20-end
Continue reading by joining Cryptonary Pro
$1,548 $1,197/year
Get everything you need to actively manage your portfolio and stay ahead. Ideal for investors seeking regular guidance and access to tools that help make informed decisions.
For your security, all orders are processed on a secured server.
As a Cryptonary Pro subscriber, you also get:
3X Value Guarantee - If cumulative documented upside does not reach 300% during your 12-month membership, you can request a full refund. Terms
24/7 access to experts with 50+ years’ experience
All of our top token picks for 2025
On hand technical analysis on any token of your choice
Weekly livestreams & ask us anything with the team
Daily insights on Macro, Mechanics, and On-chain
Curated list of top upcoming airdrops (free money)
3X Value Guarantee
If cumulative documented upside does not reach 300% during your 12-month membership, you can request a full refund.
Our track record speaks for itself
With over 2.4M tokens and widespread misinformation in crypto, we cut through the noise and consistently find winning assets.
Our track record speaks for itself
With over 2.4M tokens and widespread misinformation in crypto, we cut
through the noise and consistently find winning assets.


Frequently Asked Questions
Can I trust Cryptonary's calls?
Yes. We've consistently identified winners across multiple cycles. Bitcoin under $1,000, Ethereum under $70, Solana under $10, WIF from $0.003 to $5, PopCat from $0.004 to $2, SPX blasting past $1.70, and our latest pick has already 200X'd since June 2025. Everything is timestamped and public record.
Do I need to be an experienced trader or investor to benefit?
No. When we founded Cryptonary in 2017 the market was new to everyone. We intentionally created content that was easy to understand and actionable. That foundational principle is the crux of Cryptonary. Taking complex ideas and opportunities and presenting them in a way a 10 year old could understand.
What makes Cryptonary different from free crypto content on YouTube or Twitter?
Signal vs noise. We filter out 99.9% of garbage projects, provide data backed analysis, and have a proven track record of finding winners. Not to mention since Cryptonary's inception in 2017 we have never taken investment, sponsorship or partnership. Compare this to pretty much everyone else, no track record, and a long list of partnerships that cloud judgements.
Why is there no trial or refund policy?
We share highly sensitive, time-critical research. Once it's out, it can't be "returned." That's why membership is annual only. Crypto success takes time and commitment. If someone is not willing to invest 12 months into their future, there is no place for them at Cryptonary.
Do I get direct access to the Cryptonary team?
Yes. You will have 24/7 to the team that bought you BTC at $1,000, ETH at $70, and SOL at $10. Through our community chats, live Q&As, and member only channels, you can ask questions and interact directly with the team. Our team has over 50 years of combined experience which you can tap into every single day.
How often is content updated?
Daily. We provide real-time updates, weekly reports, emergency alerts, and live Q&As when the markets move fast. In crypto, the market moves fast, in Cryptonary, we move faster.
How does the 3X Value Guarantee work?
We stand behind the value of our research. If the documented upside from our published research during your 12-month membership does not exceed three times (3X) the annual subscription cost, you can request a full refund. Historical context: In every completed market cycle since 2017, cumulative documented upside has exceeded 10X this threshold.
TermsRecommended from Cryptonary


