Save 23% ($351) & Get a Free 1-1 Call with our Team ⏰ : 0d 2h 59m 44s
BTC, ETH, and More: Bearish Continuation, Where are the Key Supports?
Despite rate cuts, an end to QT, and fresh optimism from the US-China deal, BTC continues to show weakness. In this week’s Market Direction, we break down the disconnect between macro and market, and highlight the exact levels where conviction returns. Let's dive in...
Hey everyone, BTC has continued its corrective phase following last week’s FOMC meeting. The Fed delivered its second rate cut of 2025, lowering rates by 25 bps, as expected by the market.
However, Powell adopted a relatively hawkish tone during the press conference, cautioning against assuming a steady pace of further easing. He noted that “there were strongly differing views about how to proceed in December. A further reduction in the policy rate at the December meeting is not a foregone conclusion—far from it.”
In response, Polymarket probabilities for an additional 25 bps cut in December declined sharply from 90% to around 70%, showing how the market reacted to his hawkish stance.
Fed also announced it will stop the reduction of its balance sheet as of December 1st, effectively marking the end of Quantitative Tightening (QT). This should have bullish implications for risk assets, as it could help liquidity increase going into 2026.
During the week-end, we also had President Trump officially announcing a "deal on economic and trade relations with China", which also should be bullish for the markets and risk assets.
So, why is BTC still acting weak despite bullish macro catalysts?
For the full macro analysis - including ETF flows, institutional positioning, and what’s driving the current weakness - read our Market Update published today.
This Market Direction report focuses on the specific LEVELS and ZONES to watch, with actionable trading guidance for each asset.
Let’s dive into the charts and find the key levels...
Disclaimer: This is not financial or investment advice. You are responsible for any capital-related decisions you make, and only you are accountable for the results.
TLDR
- Fed has cut rates by 25 bps
- Powell:”A further reduction in the policy rate at the December meeting is not a foregone conclusion”
- Trump officially announcing a "deal on economic and trade relations with China"
- BTC is battling with our support at $108k- $110k and is close to break thus why we are Neutral on BTC, ETH, SOL,HYPE and we'll buy dips if they come our way.
- We remain neutral to bullish on our latest memecoin pick as it's still re-accumulating.
- Institutional buying vs mined supply analysis
- ETF flow data and trends
- Fed positioning and December cut probabilities
- Why BTC is lagging equities
- Medium-term catalysts and invalidation criteria
*These levels are valid through Sunday Nov 9. Fresh analysis next Friday.*
BTC
- Price Range: $100,000 – $116,000
- Bias: Neutral
- HOLD current positions. STRONG BUY $100k-102k if we get there.
- Resistance: $114,000 – $116,000
- Support area: $108,000 – $110,000
- Breakdown Trigger: $106,000- $107,000
BTC is now sitting just below our support area around $108,000 – $110,000. Our support zone could still hold here, but it’s important to note that the more a support is tested, the more likely it is to break.
A break of our support below $106,000- $107,000, and we would target around $100k- $102k as we would expect a reaction from this order block and possible Swing Failure Pattern area (a Swing Failure Pattern occurs when price briefly breaks a previous high or low to trigger stop orders but then reverses sharply in the opposite direction, signaling a potential reversal).
A Break (and close) above our resistance zone at $114,000 – $116,000 would signal the end of the correction.
Closes below $98k-$100k, things get a bit riskier, and it could damage our bullish thesis since it would break the market structure on higher timeframes.
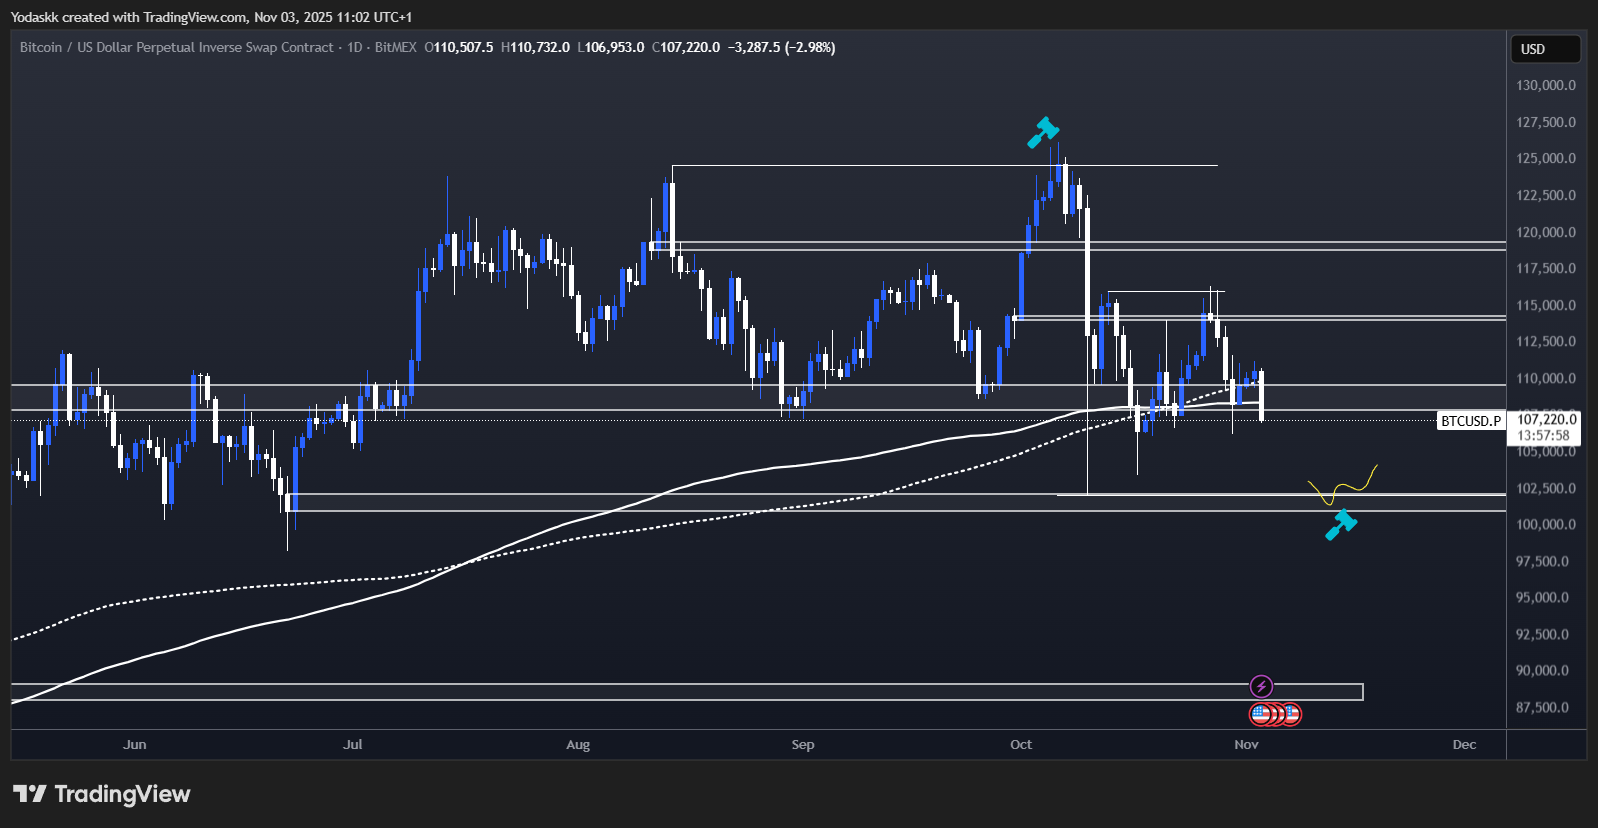
One thing to note, which is on the bullish side, in my opinion, is that BTC started the month directly by going down. Which means that BTC could put the low of the month early (first half) before visiting higher.
Historically, November is the most bullish month of the year in the last 12 years of data. Seasonality for BTC is on the bullish side.

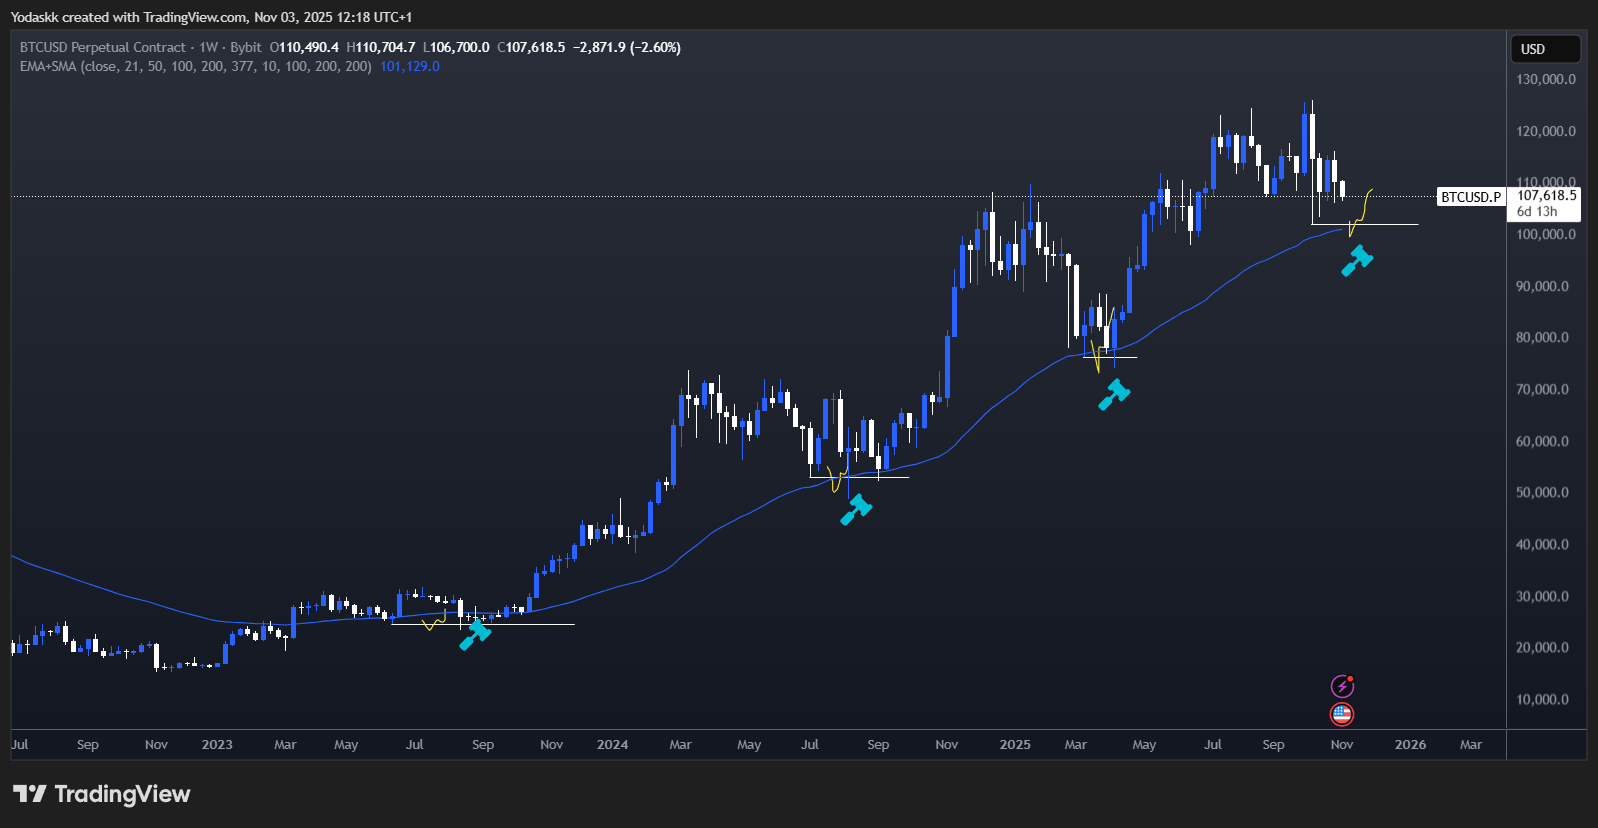
On the weekly chart, the 3 previous big corrections BTC had since its 2022 lows always followed this playbook:
1- Form a low
2- SFP (Swing Failure Pattern) of the previous low while retest the Weekly 50 EMA
3- Continuation of the uptrend
This is why a retest of the $100k- $102k area, if we get it, should be an awesome opportunity.
What Would Invalidate Our Bearish Near-Term View?
We’d reconsider our $100k-$102k target if we see:
*Technical Signals:*
- BTC breaks and closes above $$114k- 116k on daily chart
- Volume confirms breakout (2x average volume)
- ETF inflows turn positive for 3+ consecutive days
- Total inflows exceed $500M/day similar to previous uptrends
- DXY fails to break $100- $101 and reverses lower
- Fed speakers adopt decisively dovish tone
- Government reopens with positive economic data
For detailed flow analysis and what catalysts would bring institutional buyers back, see our Market Update (published today).
Here is a video breakdown if you prefer visual information:
ETH
- Local Price Range: $3,750 – $4,250
- Bias: Neutral
- HOLD. Wait for $4,250 break to add, or $3,400-3,500 dip to buy.
- Resistance: $4,250
- Support Zone: $3,750 – $3,800
- Breakdown Trigger: $3,700
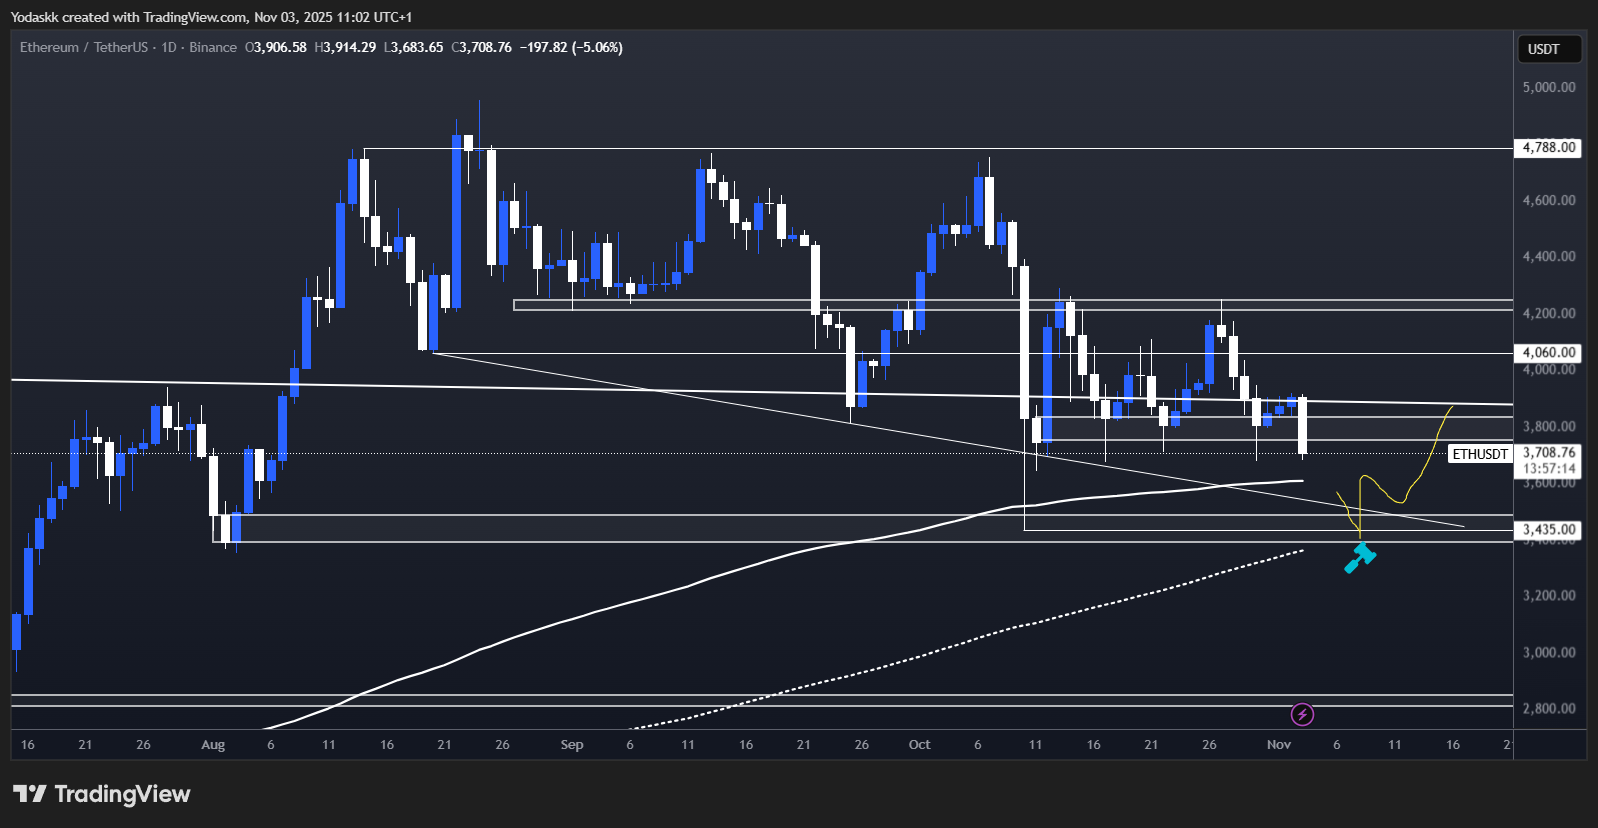
The $4,250 resistance zone once again proved significant, rejecting price again and reinforcing the importance of this key area.
A bullish confirmation would require a decisive reclaim of $4,250, opening the path toward the next upside target around $4,800.
A break below $3,700 would target the $3,400–$3,500 support region, which presents some technical analysis confluence:a daily orderblock, the 200-day SMA (a critical long-term trend indicator), and the October 10th crash low.
A liquidity sweep or Swing Failure Pattern (SFP) in this zone could present an interesting long setup.
A close below $3,400 and next target would be around $2,800, which would damage the bullish thesis.
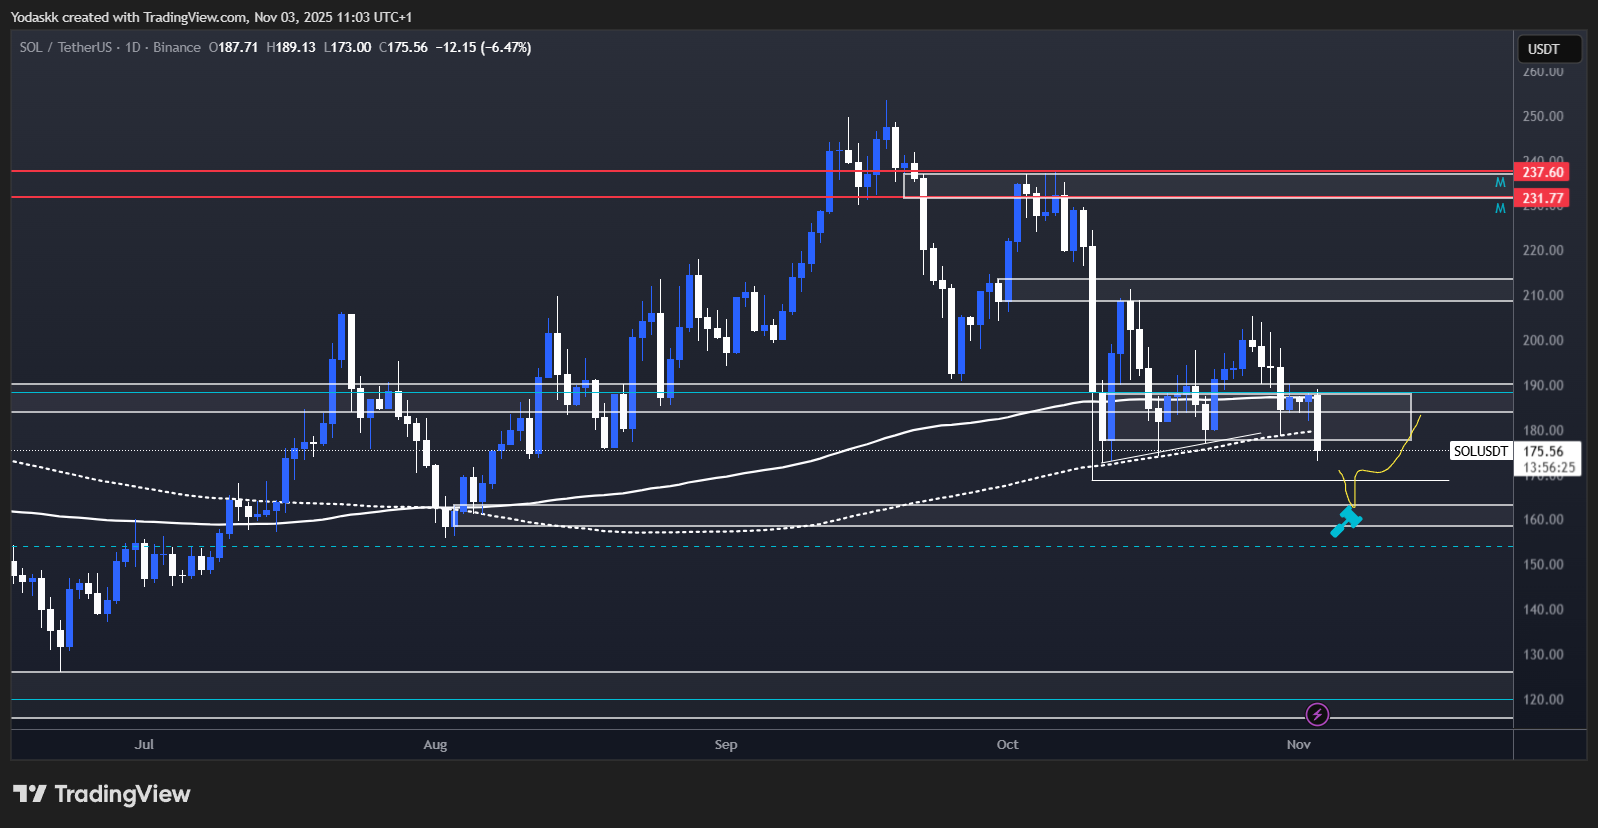
SOL
- Price Range: $178 – $210
- Bias: Neutral
- HOLD. Add if breaks $213, or if dips to $158-162.
- Resistance and Key Level to Reclaim: $213
- Support Zone: $178 – $190
- Breakdown Trigger: Break below $175
SOL is currently weaker than ETH as it didn’t retest its resistance at $213 before rejecting and instead made a lower high.
SOL must break and close above $213 to regain strength, which would confirm a shift in market sentiment and open the path toward $237 and potentially higher targets.
If SOL weakens below $175, people will start looking at the $158-162 orderblock and possibility of a Swing Failure Pattern (SFP) below $169, which would be incredible buying opportunities.
Below the $158-162 daily orderblock would damage the bullish thesis, and next target would be around $120 which is the bottom of the weekly range and also the 200-Week EMA.
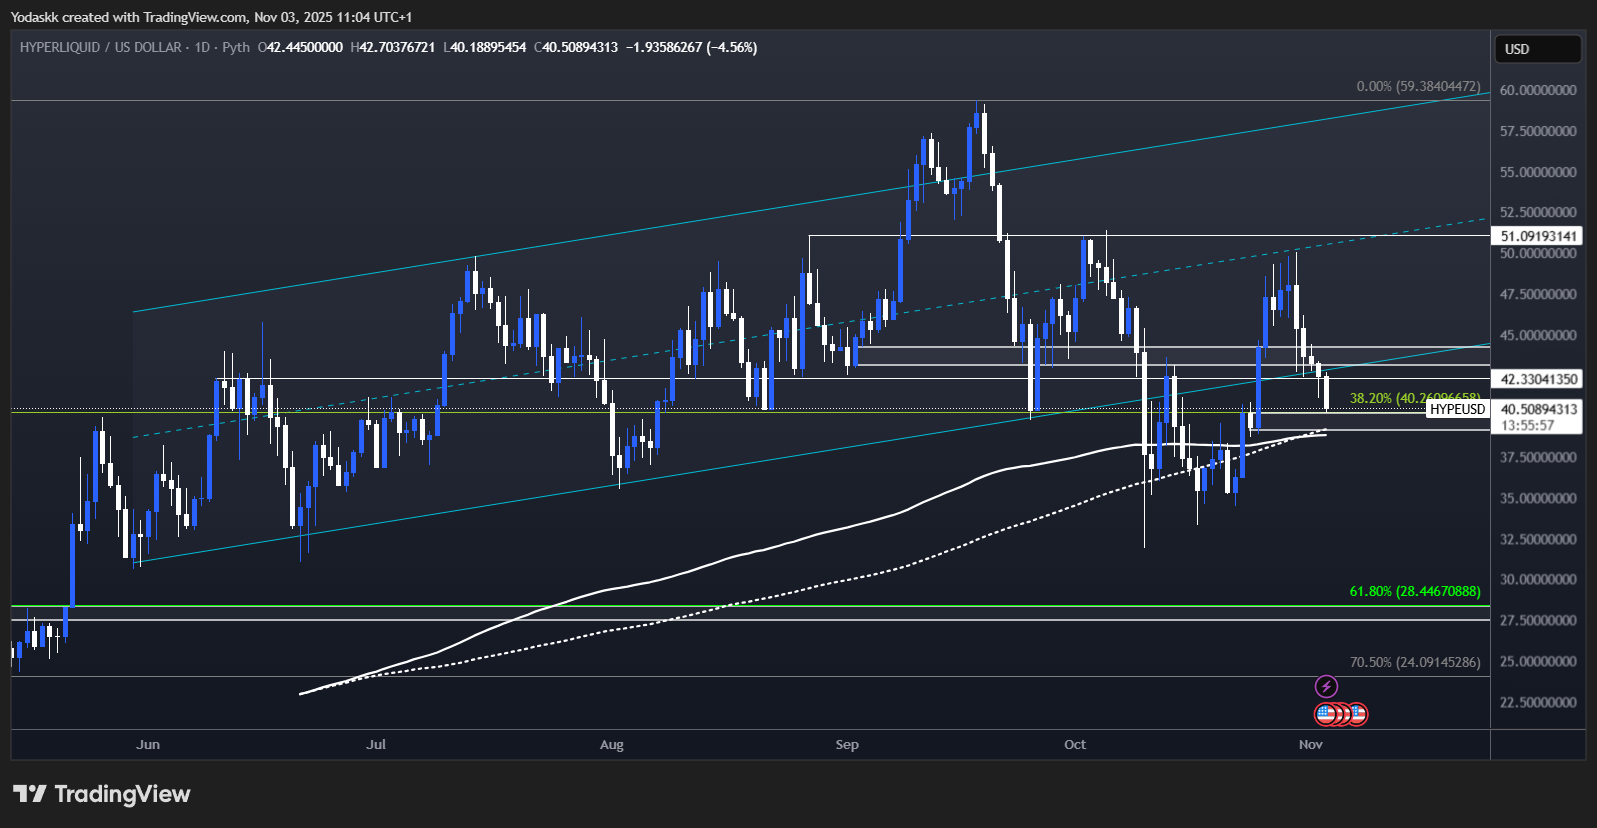
HYPE
- Price Range: $39 – $44
- Bias: Neutral
- HOLD. Add if breaks $51. Strong Buy $28.
- Resistance: $44
- Support Zone: $39- $40
- Breakdown Trigger: Break below $39
HYPE also broke back below the support zone around $43- $44 (both daily Orderblock and bottom of the channel) during the week-end, which is now resistance.
A break of resistance around $43- $44 and we would target mid-channel at $51 again.
HYPE is testing today the support at the daily orderblock around $39- $40.
Below this Orderblock and we would get more neutral as it could retest the lows, and the next big support would be around $28.
That would be an incredible buy point, as $28 is both an important horizontal support and the 61.8% fibonacci retracement of the entire $9- $59 move (the 61.8% Fibonacci retracement is a key technical level marking a strong potential reversal point where price tends to bounce or reject within a trend).
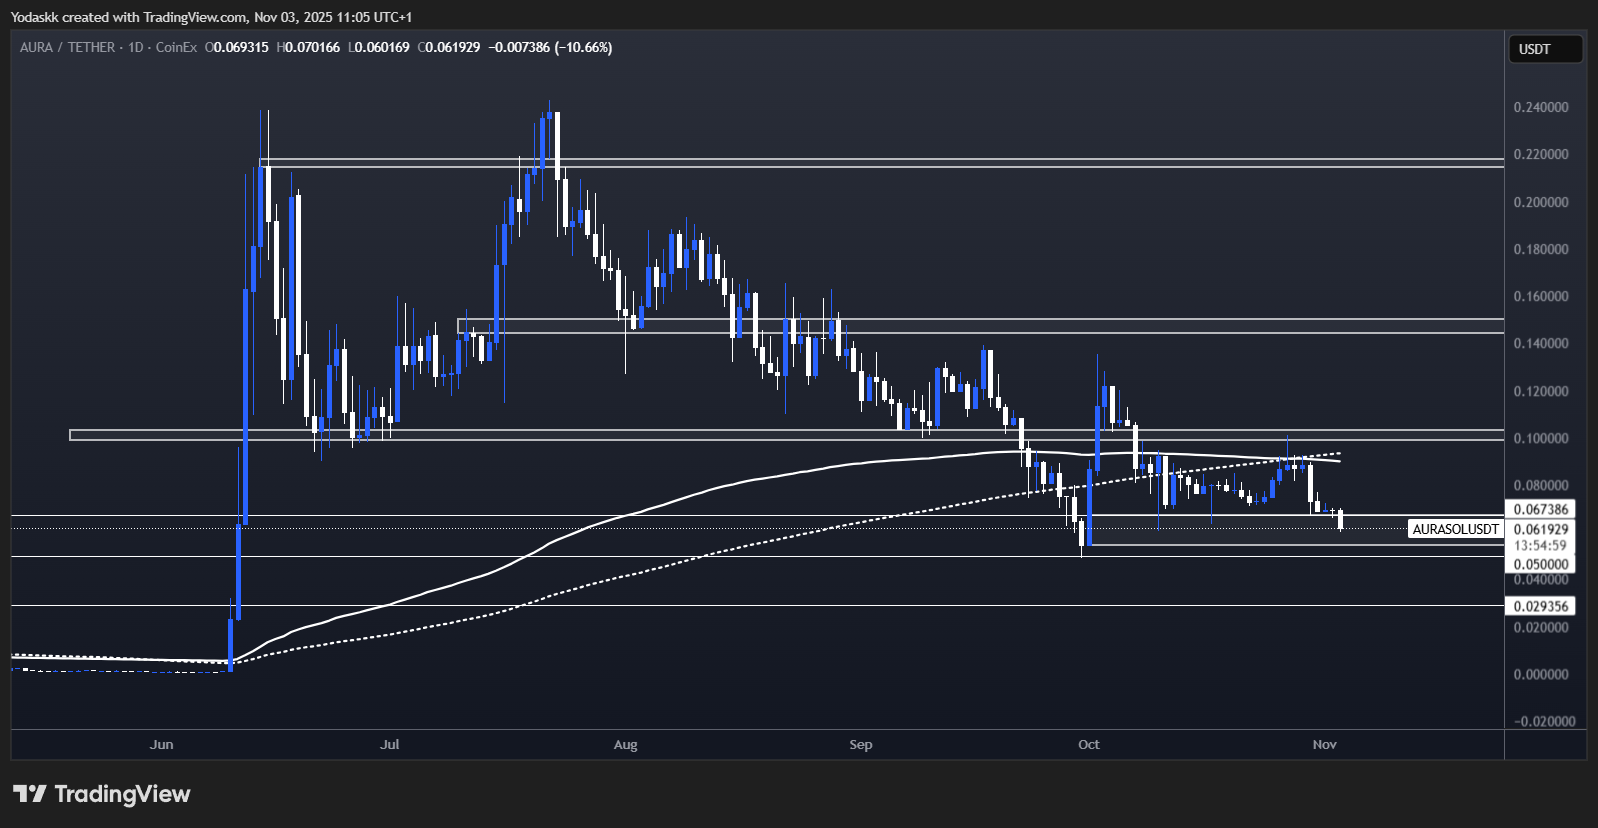
AURA
- Price Range: $0.055 – $0.1
- Bias: Neutral to Bullish
- HOLD. Wait for $0.10 breakout or buy $0.055- $0.065 support.
- Resistance and Key Level to Reclaim: $0.1
- Support Zone: $0.055- $0.065
- Breakdown Trigger: Break below $0.05
Following a local rejection from the 200-Day EMA+SMA (key indicators of long-term trend direction) in recent days, AURA is now retesting the daily orderblock support around $0.055- $0.065.
A decisive breakout above the $0.10 resistance could signal renewed bullish momentum, and we would probably move fast toward the $0.15 level and beyond.
As long as AURA is holding this daily orderblock as support, it still looking like an Adam and Eve bottom, which is a bullish reversal pattern that forms after a downtrend and consists of two consecutive bottoms:
-the first (Adam) is sharp and V-shaped, showing a quick sell-off and rebound
-the second (Eve) is rounded and wider, showing slower, steadier accumulation.
The pattern would confirm on a price break above the resistance at $0.12.
A close below the daily orderblock at $0.055- $0.065 and this pattern would be invalidated.
Even in the event of a temporary dip below $0.05, such a move would likely present an attractive buying opportunity for long-term investors.
Next support after $0.05 is around $0.03 for AURA.
Cryptonary’s Take
Multiple support retests across BTC ($108k-$110k), ETH ($3,750), and SOL ($178) increase the probability of one final flush lower:- BTC: $100k-$102k (orderblock + SFP zone + Weekly 50 EMA)
- ETH: $3,400-$3,500 (orderblock + 200-day SMA + Oct 10th low)
- SOL: $158-$162 (daily orderblock + Oct 10th low)
For the full macro thesis (why institutional demand dried up, what catalysts bring buyers back), see our Market Update published today. The key takeaway: near-term weakness is positioning cleanup, not structural breakdown.
November is BTC’s most bullish month (12-year average: +43.3%). Early-month weakness often forms the low before strong second-half rallies.
The 3 previous major corrections since 2022 all followed the same playbook:
- Form a low
- SFP below that low while testing Weekly 50 EMA
- Explosive continuation upward
Current Scenario Probabilities:
- 45% Bearish - Test $100k-$102k first half of November (best buying opportunity)
- 35% Chop - Range between $108k-$114k into next week
- 20% Bullish - Break $114k-$116k and rally to $120k+
- Current positions: HOLD
- If $100k-$102k: Deploy 25-30% of dry powder (this is the setup we’ve been waiting for)
- If $114k-$116k break: Add 10-15% to positions (breakout on momentum confirmed)
- Below $98k: Reassess thesis (structure break - see Market Update for detailed invalidation criteria)
Patience here should be rewarded in Q4 2025.
This Week’s Key Monitoring Points (Nov 3-9):
Daily Checklist:
□ Is BTC holding $108k or breaking toward $100k?
□ ETF flows - any reversal to positive?
□ S&P 500 & NASDAQ - continues higher or pulls back?
□ DXY - approaching 101 resistance?
Critical Levels This Week:
- BTC below $106k = $100k-$102k target becomes active
- BTC above $114k = bearish thesis invalidated
- ETF flows positive 2+ days = institutions returning (see Market Update for flow analysis)
- DXY above 101 = continued dollar strength headwind
- Fed speaker turns unexpectedly dovish
- Government shutdown resolution
- Major institutional BTC purchase announced
- China stimulus announcement
Thanks for reading!
*These levels are valid through Sunday, November 9th. Fresh analysis next Friday.*
Continue reading by joining Cryptonary Pro
$1,548 $1,197/year
Get everything you need to actively manage your portfolio and stay ahead. Ideal for investors seeking regular guidance and access to tools that help make informed decisions.
For your security, all orders are processed on a secured server.
As a Cryptonary Pro subscriber, you also get:
3X Value Guarantee - If cumulative documented upside does not reach 300% during your 12-month membership, you can request a full refund. Terms
24/7 access to experts with 50+ years’ experience
All of our top token picks for 2025
On hand technical analysis on any token of your choice
Weekly livestreams & ask us anything with the team
Daily insights on Macro, Mechanics, and On-chain
Curated list of top upcoming airdrops (free money)
3X Value Guarantee
If cumulative documented upside does not reach 300% during your 12-month membership, you can request a full refund.
Our track record speaks for itself
With over 2.4M tokens and widespread misinformation in crypto, we cut through the noise and consistently find winning assets.
Our track record speaks for itself
With over 2.4M tokens and widespread misinformation in crypto, we cut
through the noise and consistently find winning assets.


Frequently Asked Questions
Can I trust Cryptonary's calls?
Yes. We've consistently identified winners across multiple cycles. Bitcoin under $1,000, Ethereum under $70, Solana under $10, WIF from $0.003 to $5, PopCat from $0.004 to $2, SPX blasting past $1.70, and our latest pick has already 200X'd since June 2025. Everything is timestamped and public record.
Do I need to be an experienced trader or investor to benefit?
No. When we founded Cryptonary in 2017 the market was new to everyone. We intentionally created content that was easy to understand and actionable. That foundational principle is the crux of Cryptonary. Taking complex ideas and opportunities and presenting them in a way a 10 year old could understand.
What makes Cryptonary different from free crypto content on YouTube or Twitter?
Signal vs noise. We filter out 99.9% of garbage projects, provide data backed analysis, and have a proven track record of finding winners. Not to mention since Cryptonary's inception in 2017 we have never taken investment, sponsorship or partnership. Compare this to pretty much everyone else, no track record, and a long list of partnerships that cloud judgements.
Why is there no trial or refund policy?
We share highly sensitive, time-critical research. Once it's out, it can't be "returned." That's why membership is annual only. Crypto success takes time and commitment. If someone is not willing to invest 12 months into their future, there is no place for them at Cryptonary.
Do I get direct access to the Cryptonary team?
Yes. You will have 24/7 to the team that bought you BTC at $1,000, ETH at $70, and SOL at $10. Through our community chats, live Q&As, and member only channels, you can ask questions and interact directly with the team. Our team has over 50 years of combined experience which you can tap into every single day.
How often is content updated?
Daily. We provide real-time updates, weekly reports, emergency alerts, and live Q&As when the markets move fast. In crypto, the market moves fast, in Cryptonary, we move faster.
How does the 3X Value Guarantee work?
We stand behind the value of our research. If the documented upside from our published research during your 12-month membership does not exceed three times (3X) the annual subscription cost, you can request a full refund. Historical context: In every completed market cycle since 2017, cumulative documented upside has exceeded 10X this threshold.
TermsRecommended from Cryptonary


