Save 23% ($351) & Get a Free 1-1 Call with our Team ⏰ : 0d 2h 59m 43s
BTC, ETH and More: Bitcoin and Ethereum Tap Key Supports
A lot has happened in a short amount of time. Downside liquidity has been swept across majors, and we’re now trading inside a high-importance reaction zone. In this update, we’ll focus on what needs to hold, what needs to reclaim, and how to position with patience. Let's dive in...

Disclaimer: This is not financial or investment advice. You are responsible for any capital-related decisions you make, and only you are accountable for the results.
Quick bridge from earlier this week…
On Tuesday, earlier this week, we held a neutral-bearish bias on Bitcoin and Ethereum, with a neutral stance on Solana and a neutral-bullish bias on Hyperliquid. Bitcoin and Ethereum both tapped their respective downside liquidity levels at $83,790 and $2,717, and while prices are reacting from these zones, there is still no confirmed reversal yet.For Solana, we highlighted that a break below $121 would open a move toward $112, which played out. Despite that, the stance remained neutral due to Solana sitting near higher-timeframe support, and that context still holds. Hyperliquid continued to outperform, with the bullish divergence confirmation leading to a strong extension above $34, well beyond where we last covered it earlier this week.
Bitcoin dominance has also started to roll over from resistance, which is an important development to track going forward. We’ve already seen Hyperliquid react aggressively to this shift, and the focus now is whether broader alt strength follows. With that context in place, let’s move into today’s analysis and see how price action develops from here.
So let's dive in!
TLDR
- Bitcoin: Downside liquidity at 83,790 is done and price is reacting near the November 2025 local low level at 80,500. Bias turns neutral, watching whether this area holds or breaks toward 74K on a weekly close.
- Ethereum: Downside targets are met with price reacting from 2,717 near weekly 200 EMA. Bias stays neutral unless ETH reclaims 2,794 followed by continuation.
- Solana: Solana broke below $121 and tagged the next downside level near $112. Price is still around 200 EMA on the weekly, so bias stays neutral while we watch for either a hold or a deeper deviation.
- Hyperliquid: Bullish divergence fully played out with a strong 23.5 to 34+ expansion. Pullbacks are viewed as retracements, bias neutral-bullish.
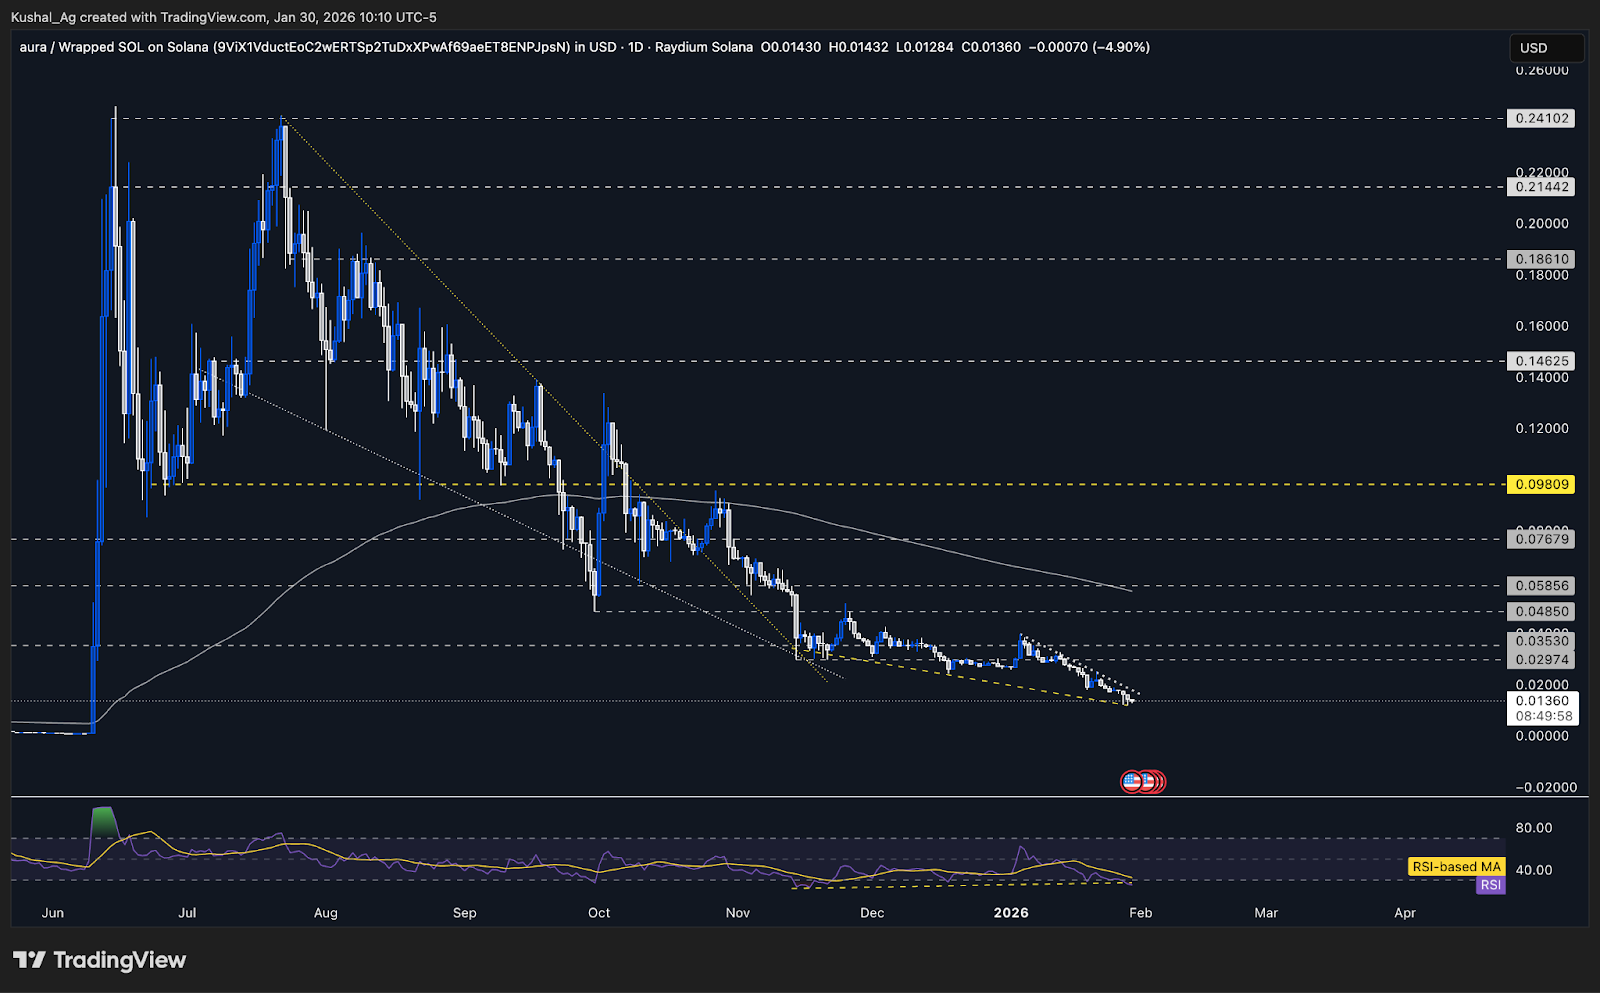
- Aura: Still weak alongside Solana, but bullish divergence continues to form. No confirmation yet, awaiting Solana to show strength.
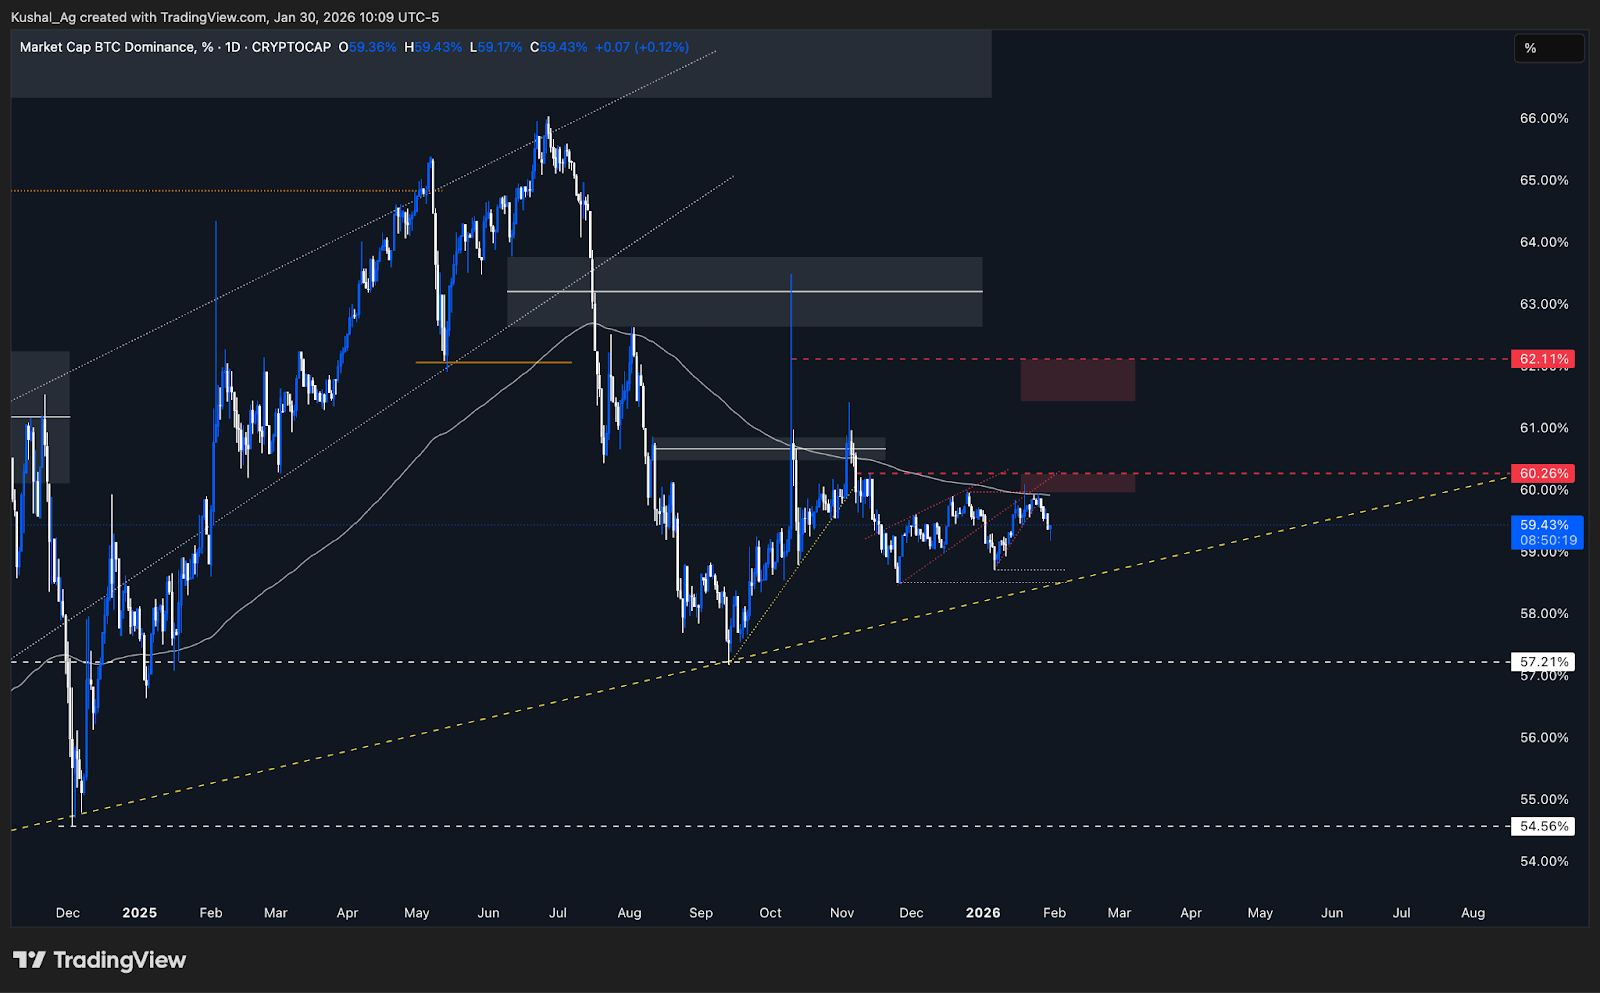
- Bitcoin Dominance: Rejected from 59.95% and starting to roll over. A break below 58.7% could support alt outperformance.
Bitcoin
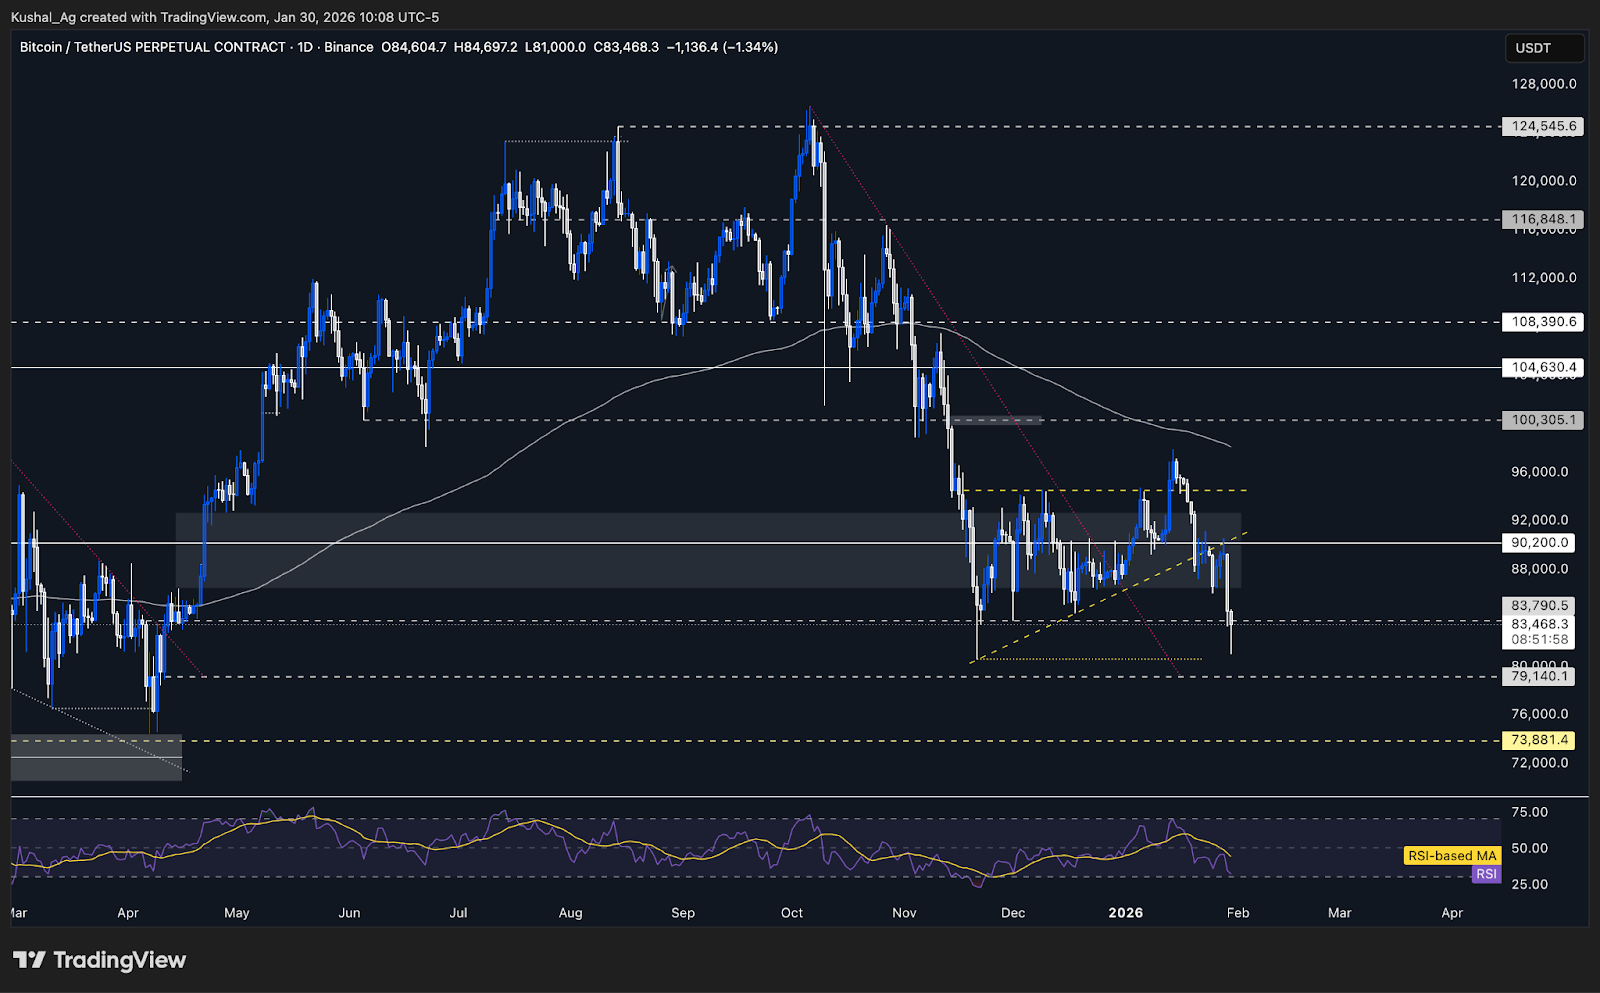
TABitcoin is trading at a critical zone after taping multiple downside liquidity targets. Following repeated rejections from the $90,200 resistance and the lost upward facing trendline, price cleanly broke below $86,400 and moved directly into the next major liquidity pocket at $83,790.
After taking out $83,790, Bitcoin extended further on the downside and printed a local low around $81,000, bringing price very close to the $80,500 external range liquidity, the November 2025 swing low. This entire $80,500-$83,790 zone is now a high importance reaction area where the majority of downside liquidity has already been grabbed.
From a structure perspective, downside momentum is still present, but the market is no longer in a clean continuation phase. With multiple liquidity targets met, the risk reward for aggressive downside continuation has reduced.
From here, two important scenarios matter. If Bitcoin holds $80,500 or shows a deviation below it followed by acceptance back above (basically a good manipulation), a local bottom might start forming in this region. That would shift the market into a stabilisation phase and open the door for a broader relief move.
However, if Bitcoin loses $80,500 with a confirmed weekly close below it, the structure breaks further and opens the path toward the next major downside liquidity at $74,000. This is not the base case yet, but it remains a valid bearish continuation scenario if $80,500 fails decisively.
The 200 EMA on the daily timeframe continues to slope downward around $98,000, confirming higher timeframe pressure. RSI is near 31 with average at 43, suggesting heavy weakness and increasing the probability of short-term relief, though confirmation must come from price behaviour around $80,500.
Key Levels
- Next Support: $80,500
- Next Resistance: $90,200
- Direction: Neutral
- Upside Target: $94,500
- Downside Target: $74,000 (only if $80,500 loses on a weekly close)
Cryptonary’s Take
Bitcoin has now done a large part of the downside work by clearing $86,400 and $83,790, bringing price into a historically significant liquidity zone near $80,500. With RSI deeply oversold and price approaching external range lows, this is no longer a high confidence short area.The bias shifts to neutral here. How Bitcoin behaves around $80,500 will decide the next major move. A rejection, deviation, or strong defence of this level can mark the start of a broader base, also a new low below $80,500 would potentially put in a potential bullish divergence on the daily timeframe for BTC. Conversely, a clean “weekly” close below $80,500 would invalidate stabilisation and reopen deeper downside toward $74,000.
Ethereum
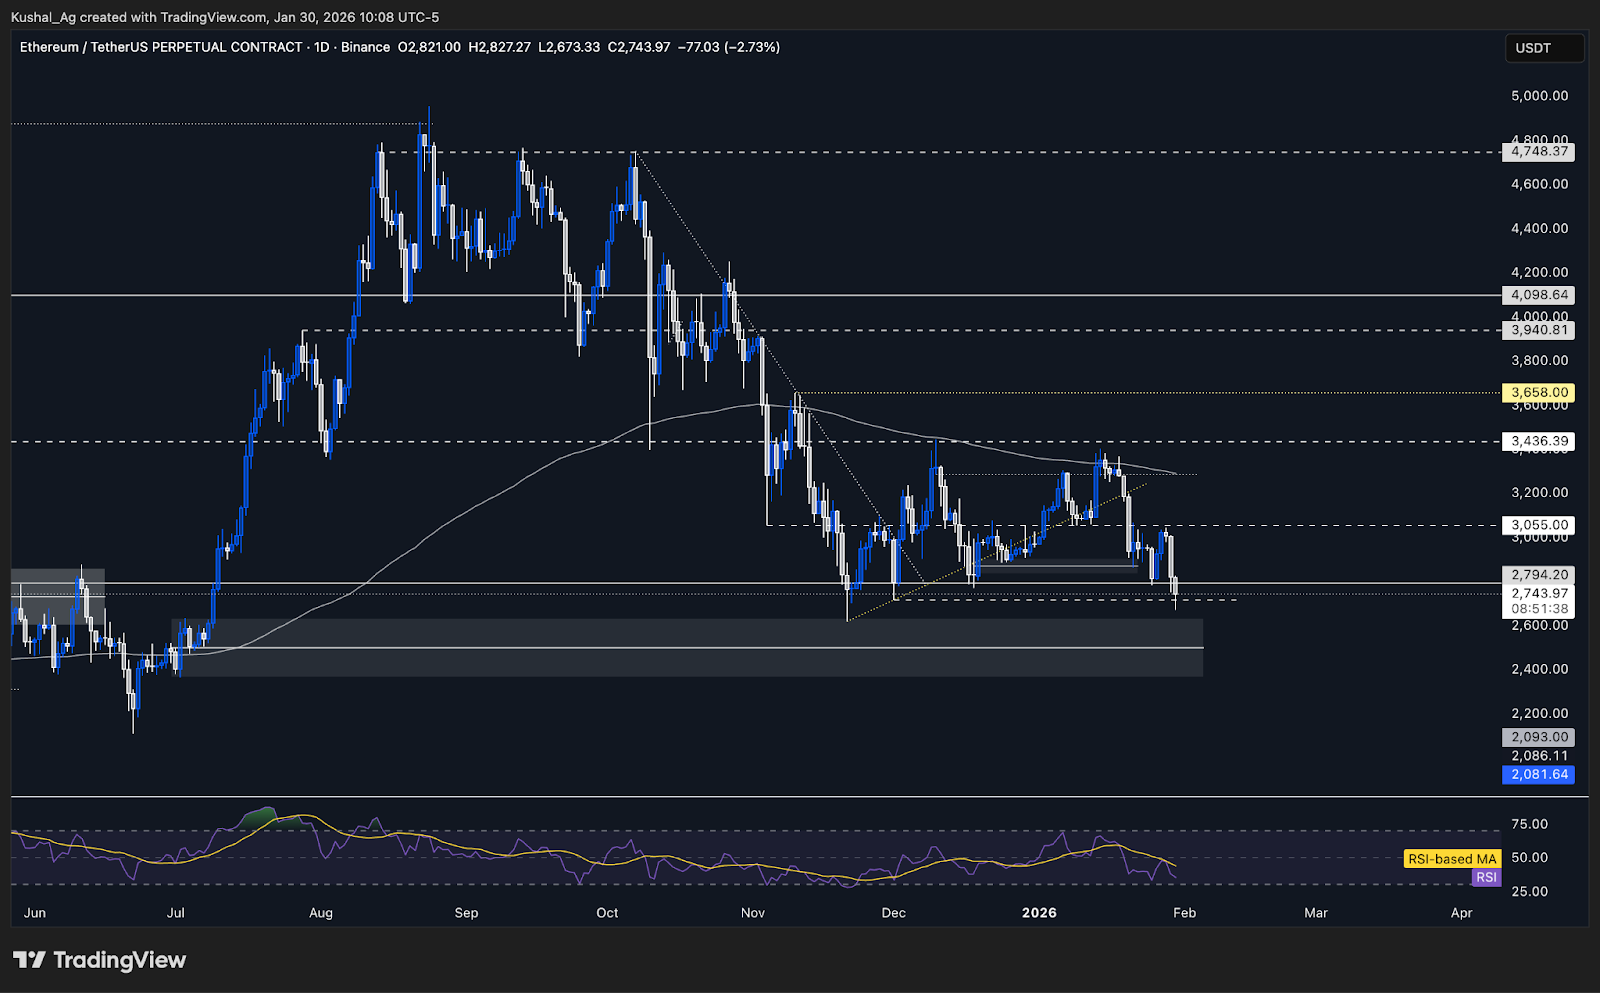
TAEthereum has now reached the key downside external liquidity target at $2,717, which we had highlighted well in advance. This move closely mirrored Bitcoin’s liquidity sweep, with ETH following through to its own downside targets and beginning to react from this zone.
While price has bounced off $2,717, the reaction so far has been muted and not impulsive, indicating that buyers are present but not yet aggressive. This keeps Ethereum in a wait and watch phase and not a confirmed reversal phase at this stage.
Structurally, it’s important to note that all major downside liquidity targets on the weekly timeframe have now been met. In addition, the 200 EMA on the weekly timeframe sits just below at $2,635, making the broader $2,600-$2,720 region a high-importance higher timeframe support cluster. Short term deviations or wicks below this zone are possible, but this is an area where Ethereum can begin base building if the market stabilises.
On the daily timeframe, Ethereum’s recent path remains technically clean. After bouncing from $2,794 to $3,055, price rejected sharply from $3,055, broke back below $2,794, and moved directly into $2,717, exactly as outlined. With $2,717 now tagged, the next downside liquidity only opens if this level fails, in which case $2,620 (November 2025 swing low) becomes the next target.
The 200 EMA on the daily timeframe is rolling over near $3,291, reinforcing broader bearish pressure. RSI is near 34 with average around 44, reflecting exhaustion but not yet showing a confirmed momentum reversal.
Key Levels
- Next Support: $2,717
- Next Resistance: $2,794
- Direction: Neutral
- Upside Target: $3,055
- Downside Target: $2,620
Cryptonary’s Take
Ethereum has done what it needed to do on the downside by tapping $2,717, aligning with weekly liquidity and higher-timeframe support. This shifts ETH out of a clean bearish continuation phase and into a reaction and stabilisation zone, similar to Bitcoin near $80,500.For now, bias stays neutral. Ethereum needs to either show stronger acceptance above $2,717 or reclaim $2,794 to confirm base formation. Failure to hold this zone would expose $2,620 next, but unless that happens, this is no longer an area to press downside aggressively.
Solana
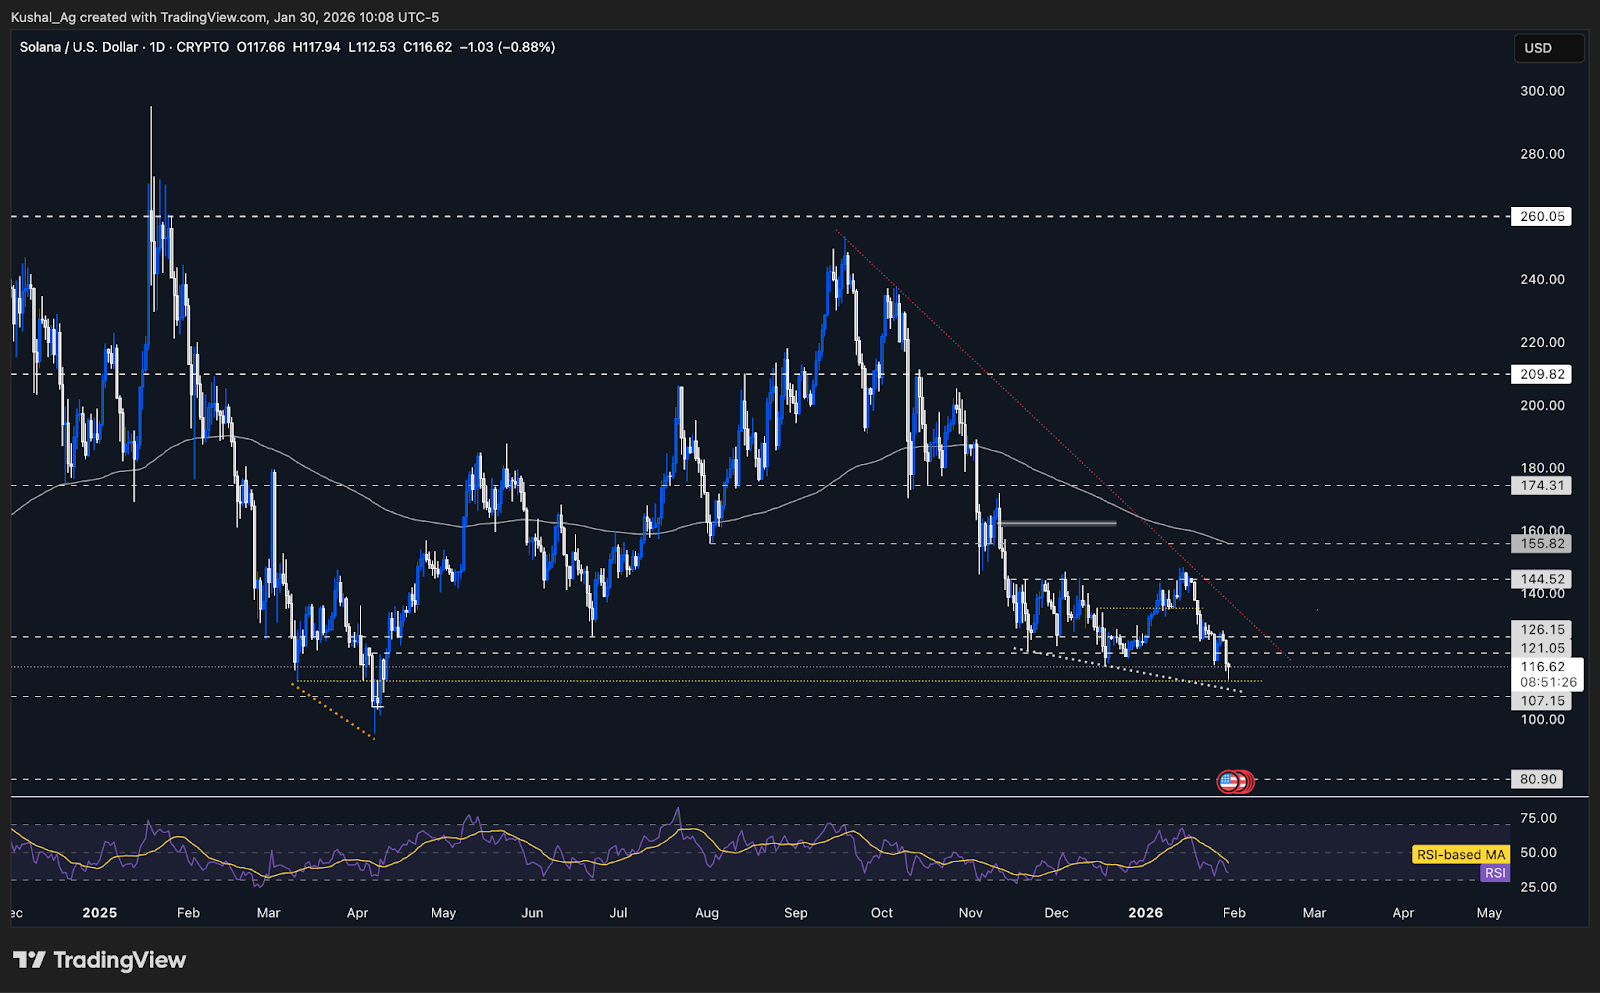
TAWhen we last analysed Solana, price was consolidating between $121 and $126, and we had clearly outlined that a failure to hold $121 could open a quick move toward the $112 region. That scenario played out as Bitcoin swept downside liquidity, with Solana breaking below $121 and printing a local low near $112.6, just shy of the $112.2 level we had marked.
Despite that breakdown, Solana’s reaction has been orderly. The move into $112.6 appears more like a liquidity-driven deviation and not a structural breakdown, especially given the broader context of Bitcoin tapping its own downside liquidity around $80.5K.
Our stance remains neutral primarily because Solana is still operating around a major higher-timeframe support zone. The weekly 200 EMA sits near $123, and although price deviated below this level, it has not shown sustained acceptance below it. Being outright bearish at a higher-timeframe support cluster like this is not optimal without confirmation.
At this stage, Solana’s direction will remain highly dependent on Bitcoin’s behaviour around its own key support. If Bitcoin stabilises, Solana has room to range and potentially rebuild structure. If Bitcoin resumes downside continuation, Solana could revisit lower supports.
If $112.2 fails to hold with acceptance, the next important level on the downside is $107, which is the final meaningful support before the psychological $100 zone. Below $100, structural support only re-emerges much lower, near the $80 region, a scenario that is not the base case, but still one to be aware of.
The 200 EMA on the daily timeframe continues to slope down currently around $155.8, and RSI is holding in the low-30s at 35 with its average at 42, reflecting exhaustion in bearish pressure.
Key Levels
- Next Support: $112.2
- Next Resistance: $121
- Direction: Neutral
- Upside Target: $126.15
- Downside Target: $107.15
Cryptonary’s Take
Solana has done what it needed to do by flushing below $121 and reacting near $112, in line with broader market liquidity dynamics. As long as price continues to hold this zone without acceptance lower, Solana remains in a neutral, base-building phase.Directional conviction will only come once Bitcoin shows clarity around its own support. Until then, Solana is best treated as a range bound asset at higher timeframe support, with risk defined below $112 and patience required for confirmation.
Hyperliquid
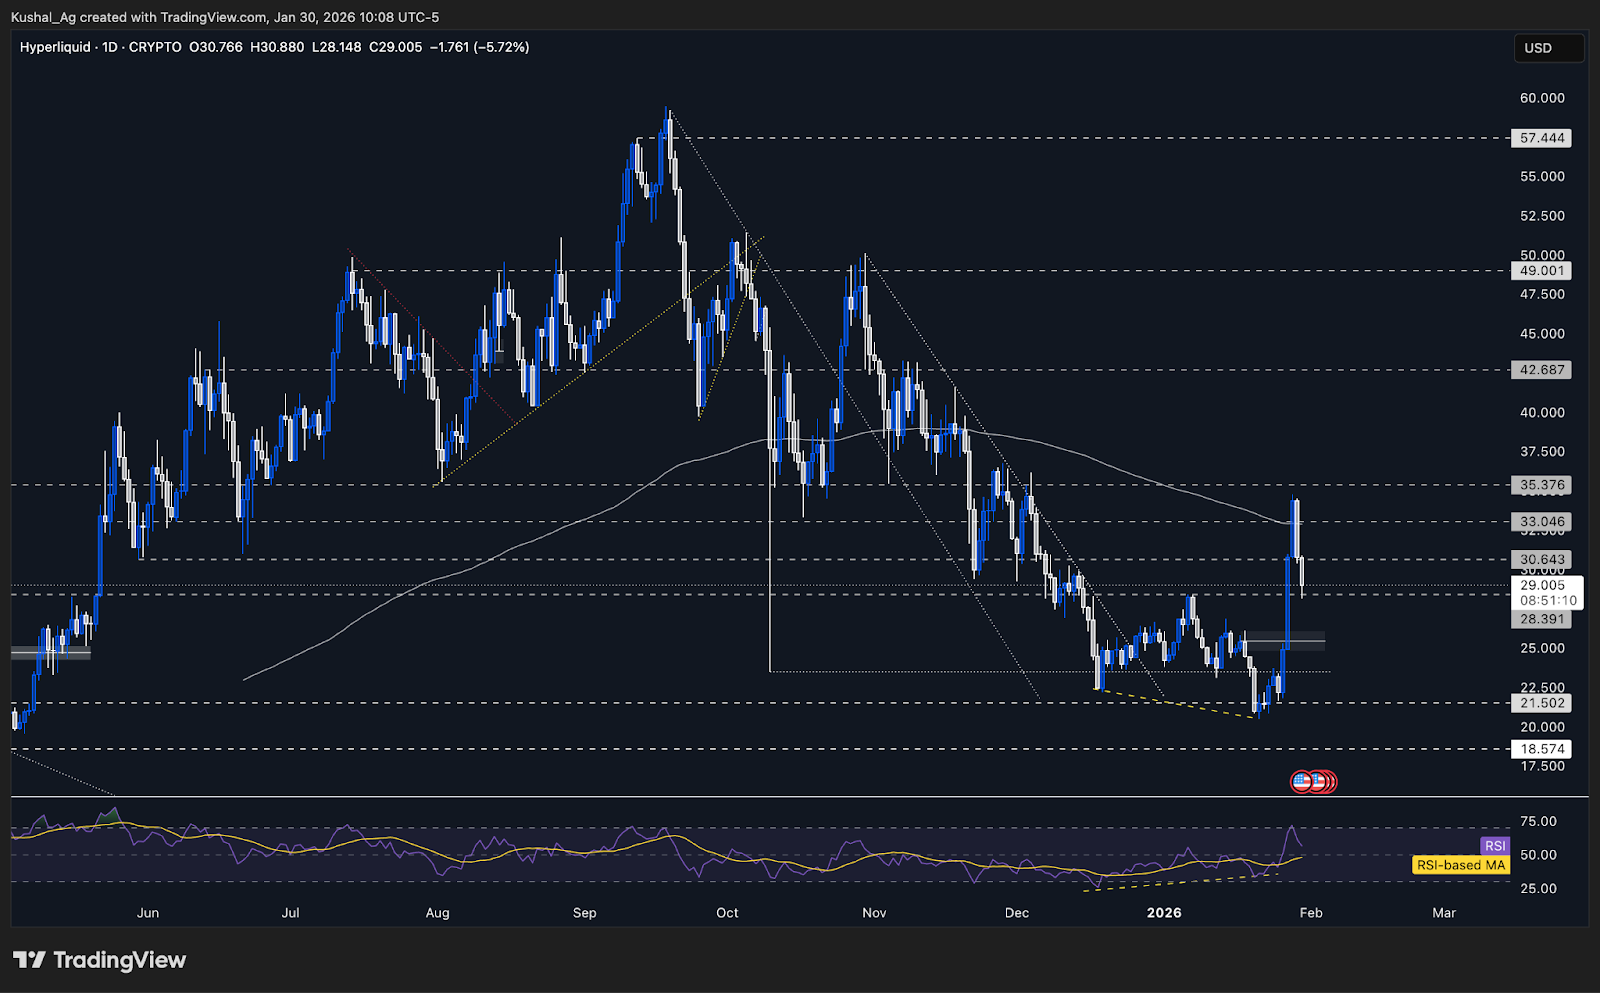
TAHyperliquid has delivered a clean, momentum driven rally ever since confirming its RSI bullish divergence and reclaiming $23.5, a level we had clearly defined as the trigger for follow-through. From there, price moved almost unimpeded, accelerating through prior resistance zones and reaching a local high near $34.79.
The first meaningful rejection has now come in around the $34-35 region, which aligns closely with the daily 200 EMA ($32.9). This is a level Hyperliquid had not tested since November, so some rejection and cooling off here is structurally healthy.
Importantly, the rally has flipped multiple former resistance levels into support. Price is currently holding above $28.39, which now acts as immediate structural support. Below that sits the untested breaker block between $24.7-$26.15, with a midpoint around $25.45, which remains a logical retracement zone if price pulls back further.
Momentum has reset without breaking structure, RSI has cooled from overbought (72) back into the mid-50s around 58 with average at 48, while the daily 200 EMA has started to flatten near 32.8, suggesting trend pressure is easing.
Given broader market conditions, we maintain a neutral-bullish stance, treating pullbacks as retracements unless structure is lost. A clean reclaim and acceptance above the daily 200 EMA would be the trigger to reassess toward a full bullish bias.
Key Levels
- Next Support: $28.39
- Next Resistance: $30.64
- Direction: Neutral-Bullish
- Upside Target: $33.0
- Downside Target: $25.45
Cryptonary’s Take
Hyperliquid has done exactly what a strong asset should do after a divergence confirmation, expand aggressively, flip structure, and only then pause at a higher timeframe moving average. The current pullback phase looks corrective.As long as price holds above the $28.39 region, dips remain constructive, with the $25.45 breaker block acting as the ideal higher timeframe reset zone. A reclaim of the daily 200 EMA would be the final confirmation needed to shift from neutral-bullish into a fully bullish continuation stance.
Aura
TAAura continues to face selling pressure, largely in line with broader Solana weakness and not any coin specific breakdown. This is visible across the meme complex, where most assets are still correcting together after Solana failed to hold key supports.
Price remains compressed near the lower end of its recent range, suggesting ongoing distribution. This keeps Aura still in a waiting phase.
The broader context matters here. A large portion of downside liquidity across majors has already been tapped, and any stabilisation or strength in Solana, particularly a reclaim of $126, could quickly spill over into meme coins like Aura.
From an indicator perspective, conditions are stretched. The daily 200 EMA is hovering around 0.056, still well above price, while RSI is deeply oversold near 27 with average at 32.
- Direction: Bullish
- Action Plan: DCA and Raid
Cryptonary’s Take
Aura isn’t weak in isolation, it’s behaving exactly how high beta meme assets tend to behave during broader market stress. Fear and compression are part of the process, not a signal to panic. If Solana begins to stabilise and reclaim lost levels, Aura is well positioned to respond sharply from these oversold conditions.
Bitcoin Dominance
TABitcoin dominance has started to roll over after rejecting from the predefined red supply zone between 59.95% and 60.26%, an area aligned with the daily 200 EMA and a key liquidity pocket. This rejection was anticipated and marks the first structural sign of potential downside continuation.
Dominance is now trading around 59.3%, and the immediate focus shifts to the 58.7%-58.49% region. A clean breakdown below this zone would confirm continuation lower and open the door for faster downside expansion in dominance.
If this breakdown materialises, dominance could accelerate toward the next downside objectives at 57.1%, followed by 54.58%, levels that historically align with periods of strong relative outperformance in select altcoins.
On the upside, any corrective bounce is expected to face resistance again near the daily 200 EMA (59.9%), with the upper boundary of the current red box at 60.26% acting as the first rejection zone.
Failure there would keep the bearish structure intact, while only a sustained move beyond this area would shift focus toward the higher resistance band at 61.4%-62.1%.
Bitcoin Dominance Chart:
Cryptonary’s Take
The rejection from the 60% region is a constructive development for the broader market. As long as Bitcoin dominance remains capped below the 200 EMA and continues to make lower highs, the probability of selective altcoin expansion increases.The key trigger to watch is a confirmed breakdown below 58.5%. If that happens, dominance could unwind quickly, creating favourable conditions for rotation into alts.
Closing Thoughts
Bitcoin and Ethereum have now tapped their downside liquidity targets, with Bitcoin reacting just above the $80,500 level, the November 2025 swing low, a key structural area. How Bitcoin behaves around $80,500 is critical from here. A weekly breakdown below this level would open the door toward $74,000, while a manipulation below $80,500 followed by a reclaim would be a constructive signal and could set the stage for higher prices post deviation.Ethereum and Solana are also sitting just above important higher timeframe levels, making this a decisive zone for both. Whether these levels hold or fail will largely depend on how Bitcoin resolves its current structure.
Hyperliquid continues to stand out with clear relative strength, moving independently of the broader majors. Pullbacks in HYPE are now best viewed as retracements, and the focus remains on whether this strength can sustain while other majors attempt to base.
Bitcoin dominance has started to roll over after rejecting from the 200 EMA near 59.9%, and continued downside in dominance would be supportive for broader alt participation in the weeks ahead. From here, Bitcoin’s reaction around $80,500 remains the key decider for market direction going forward.
Cryptonary, OUT!
Continue reading by joining Cryptonary Pro
$1,548 $1,197/year
Get everything you need to actively manage your portfolio and stay ahead. Ideal for investors seeking regular guidance and access to tools that help make informed decisions.
For your security, all orders are processed on a secured server.
As a Cryptonary Pro subscriber, you also get:
3X Value Guarantee - If cumulative documented upside does not reach 300% during your 12-month membership, you can request a full refund. Terms
24/7 access to experts with 50+ years’ experience
All of our top token picks for 2025
On hand technical analysis on any token of your choice
Weekly livestreams & ask us anything with the team
Daily insights on Macro, Mechanics, and On-chain
Curated list of top upcoming airdrops (free money)
3X Value Guarantee
If cumulative documented upside does not reach 300% during your 12-month membership, you can request a full refund.
Our track record speaks for itself
With over 2.4M tokens and widespread misinformation in crypto, we cut through the noise and consistently find winning assets.
Our track record speaks for itself
With over 2.4M tokens and widespread misinformation in crypto, we cut
through the noise and consistently find winning assets.


Frequently Asked Questions
Can I trust Cryptonary's calls?
Yes. We've consistently identified winners across multiple cycles. Bitcoin under $1,000, Ethereum under $70, Solana under $10, WIF from $0.003 to $5, PopCat from $0.004 to $2, SPX blasting past $1.70, and our latest pick has already 200X'd since June 2025. Everything is timestamped and public record.
Do I need to be an experienced trader or investor to benefit?
No. When we founded Cryptonary in 2017 the market was new to everyone. We intentionally created content that was easy to understand and actionable. That foundational principle is the crux of Cryptonary. Taking complex ideas and opportunities and presenting them in a way a 10 year old could understand.
What makes Cryptonary different from free crypto content on YouTube or Twitter?
Signal vs noise. We filter out 99.9% of garbage projects, provide data backed analysis, and have a proven track record of finding winners. Not to mention since Cryptonary's inception in 2017 we have never taken investment, sponsorship or partnership. Compare this to pretty much everyone else, no track record, and a long list of partnerships that cloud judgements.
Why is there no trial or refund policy?
We share highly sensitive, time-critical research. Once it's out, it can't be "returned." That's why membership is annual only. Crypto success takes time and commitment. If someone is not willing to invest 12 months into their future, there is no place for them at Cryptonary.
Do I get direct access to the Cryptonary team?
Yes. You will have 24/7 to the team that bought you BTC at $1,000, ETH at $70, and SOL at $10. Through our community chats, live Q&As, and member only channels, you can ask questions and interact directly with the team. Our team has over 50 years of combined experience which you can tap into every single day.
How often is content updated?
Daily. We provide real-time updates, weekly reports, emergency alerts, and live Q&As when the markets move fast. In crypto, the market moves fast, in Cryptonary, we move faster.
How does the 3X Value Guarantee work?
We stand behind the value of our research. If the documented upside from our published research during your 12-month membership does not exceed three times (3X) the annual subscription cost, you can request a full refund. Historical context: In every completed market cycle since 2017, cumulative documented upside has exceeded 10X this threshold.
TermsRecommended from Cryptonary


