Save 23% ($351) & Get a Free 1-1 Call with our Team ⏰ : 0d 2h 59m 44s
BTC, ETH and More: Bitcoin Breakout Fades
The breakout phase is done. Now the market has to prove it. Bitcoin, Ethereum, and Solana have all delivered on their upside setups, but early signs of exhaustion are starting to show. With macro risks still elevated, this is where continuation either confirms… or fails. Let's dive in...

Disclaimer: This is not financial or investment advice. You are responsible for any capital-related decisions you make, and only you are accountable for the results.
Quick bridge from last week…
Last week, we maintained a neutral-bullish stance on Bitcoin, Solana, and Hyperliquid, while Ethereum remained neutral with clear conditions for a shift. Since then, price action played out pretty decently, Bitcoin and Solana delivered their breakouts, Ethereum validated the conditional thesis and hit its upside targets, and Hyperliquid reached the $39.9 upside target as well. With these moves now completed, today’s analysis shifts toward post-breakout behaviour, while also incorporating stablecoin dominance, which is sitting at a critical point and could help define the next directional move across the market.Bitcoin – Key levels and rejection from $76,000:
On the macro front, markets continue to react to the ongoing Middle East conflict, keeping oil elevated and financial conditions tight. Alongside this, the FOMC meeting on March 17-18 becomes a key near-term catalyst, where rate guidance and projections could drive volatility across risk assets. With this in mind, a degree of caution is warranted in the near term, as macro-driven moves may override short-term technical setups. For a deeper breakdown of these developments, refer to yesterday’s market update.
Disclaimer: This content is for informational and educational purposes only. It does not constitute financial advice, and should not be relied upon as a basis for making investment decisions. Virtual assets are volatile and may lose their value in full. Past performance does not indicate future results. Always do your own research.
TLDR
- Bitcoin: BTC saw a sharp rejection after reclaiming $73,800, bringing the structure back into uncertainty. The stance is now neutral, with a sustained move above $74,800 required for continuation, while failure to reclaim opens the path toward $70,500.
- Ethereum: ETH has already delivered its breakout move and upside targets, and is now trading at resistance again. The stance remains neutral, with a confirmed close above $2,385 required for continuation toward $2,500-$2,600.
- Solana: SOL has broken above and is holding the $93.18 level as support. The stance remains neutral-bullish, with continuation toward $100-$106.9 likely as long as this level holds.
- Hyperliquid: HYPE has reclaimed and is holding above $39.97 after hitting the target. The stance remains neutral-bullish, with $43.29 as the next resistance and continuation level, while loss of $39.97 would weaken the structure.
- Aura: AURA continues to consolidate within its broader range, with no structural breakout yet. The stance remains neutral, with any upside likely dependent on continued strength in Solana and the broader ecosystem.
- USDT.D + USDC.D: Stablecoin dominance is testing the key 10.39% level. A breakdown below this confirms downside in dominance (bullish for crypto), while a reclaim and move higher signals renewed downside pressure across the market.
Bitcoin
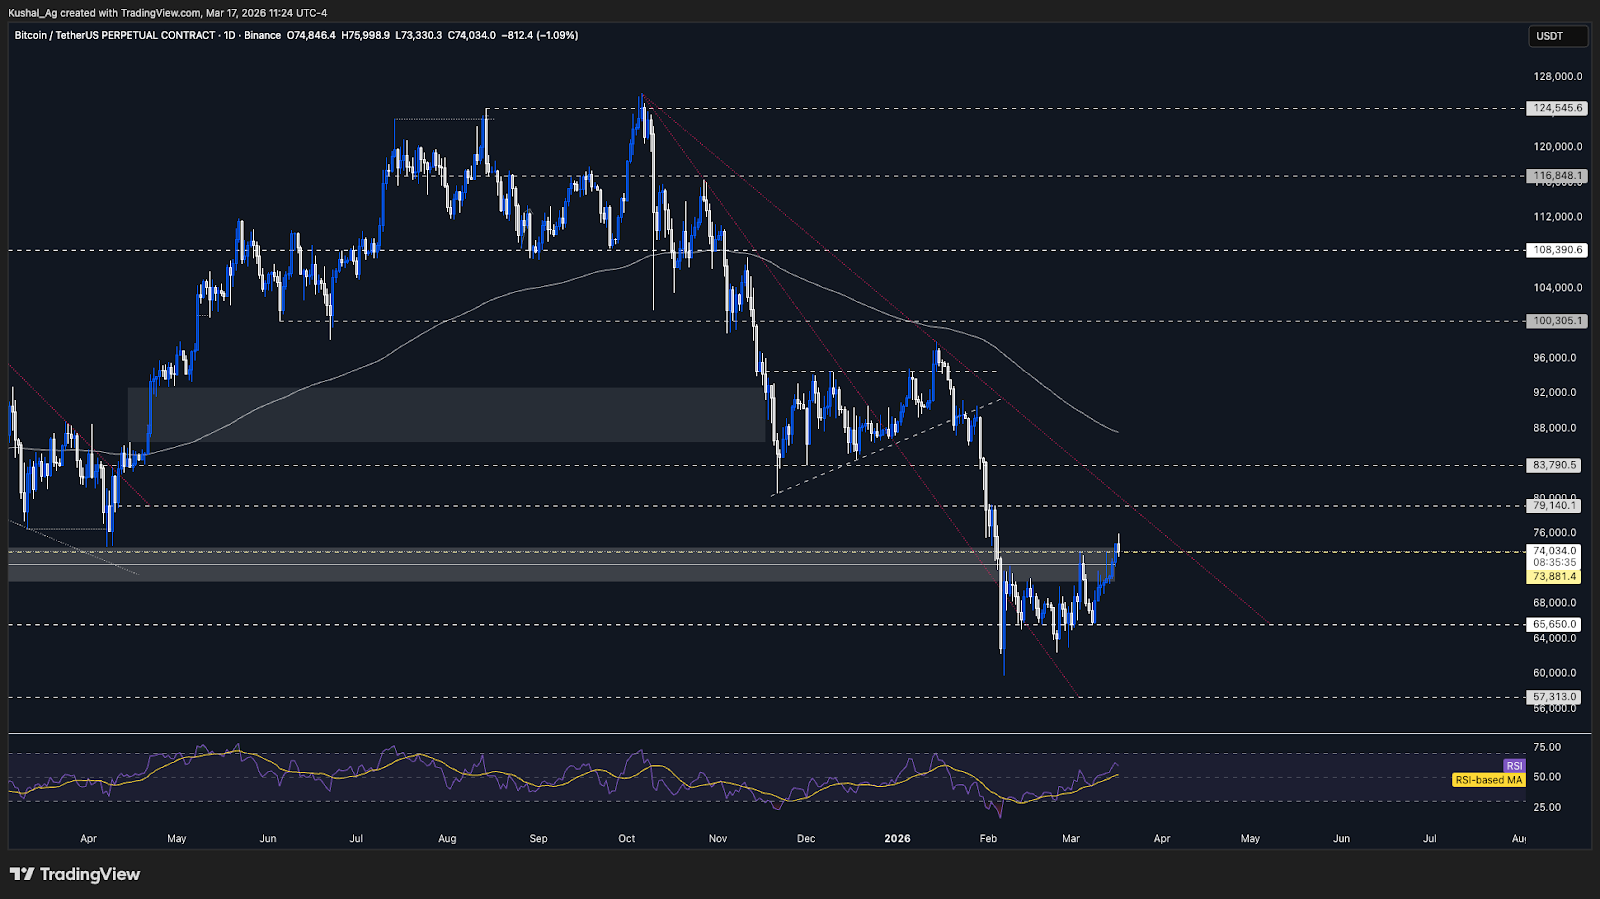
TABitcoin delivered the daily close above the $73,800 level that we had been tracking, confirming the initial breakout from the range. However, the follow-through has been weak, with the current daily candle showing a rejection after wicking toward the $76,000 region, which introduces caution into the short-term structure.
This rejection from the previous day’s high ($74,800) is a key development. Price has now moved back below the breakout level, and if the current daily candle closes in this form, it would suggest that the breakout may have been a deviation, increasing the probability of a reversal back into the range.
As a result, we are pivoting back to a neutral stance for now and waiting for confirmation. A strong daily close back above the $74,800 region (previous day’s high) would re-establish bullish continuation and open the path toward the $79,140 upside target.
On the flip side, continued acceptance below $73,800, especially with a weak daily close, would strengthen the case for a reversal, with price likely rotating back toward the $70,500 region as the initial downside target. This would effectively confirm the recent move above range highs as a deviation.
The 200 EMA on the daily timeframe is currently hovering around $87,500 and continues to slope slightly downward, although it is beginning to flatten. RSI remains relatively strong at 59 with average at 52, showing that momentum is still constructive, but price action at resistance remains the key factor to watch.
Key Levels:
- Support: $73,800
- Resistance: $76,000
- Direction: Neutral
- Upside Target: $79,140
- Downside Target: $70,500
Cryptonary’s Take:
Bitcoin is currently at a point where the market needs to decide whether the breakout above $73,800 was genuine or simply a deviation. The rejection from the $76,000 region adds uncertainty, and the current daily close will be important in confirming the next directional move.A reclaim of the previous day’s high would put Bitcoin back on track for continuation toward $79,140, while failure to do so would likely lead to a rotation back into the range, with $70,500 as the first key downside level to watch. For now, the stance remains neutral until clearer confirmation emerges.
Ethereum – Breakout and new resistance:
Ethereum
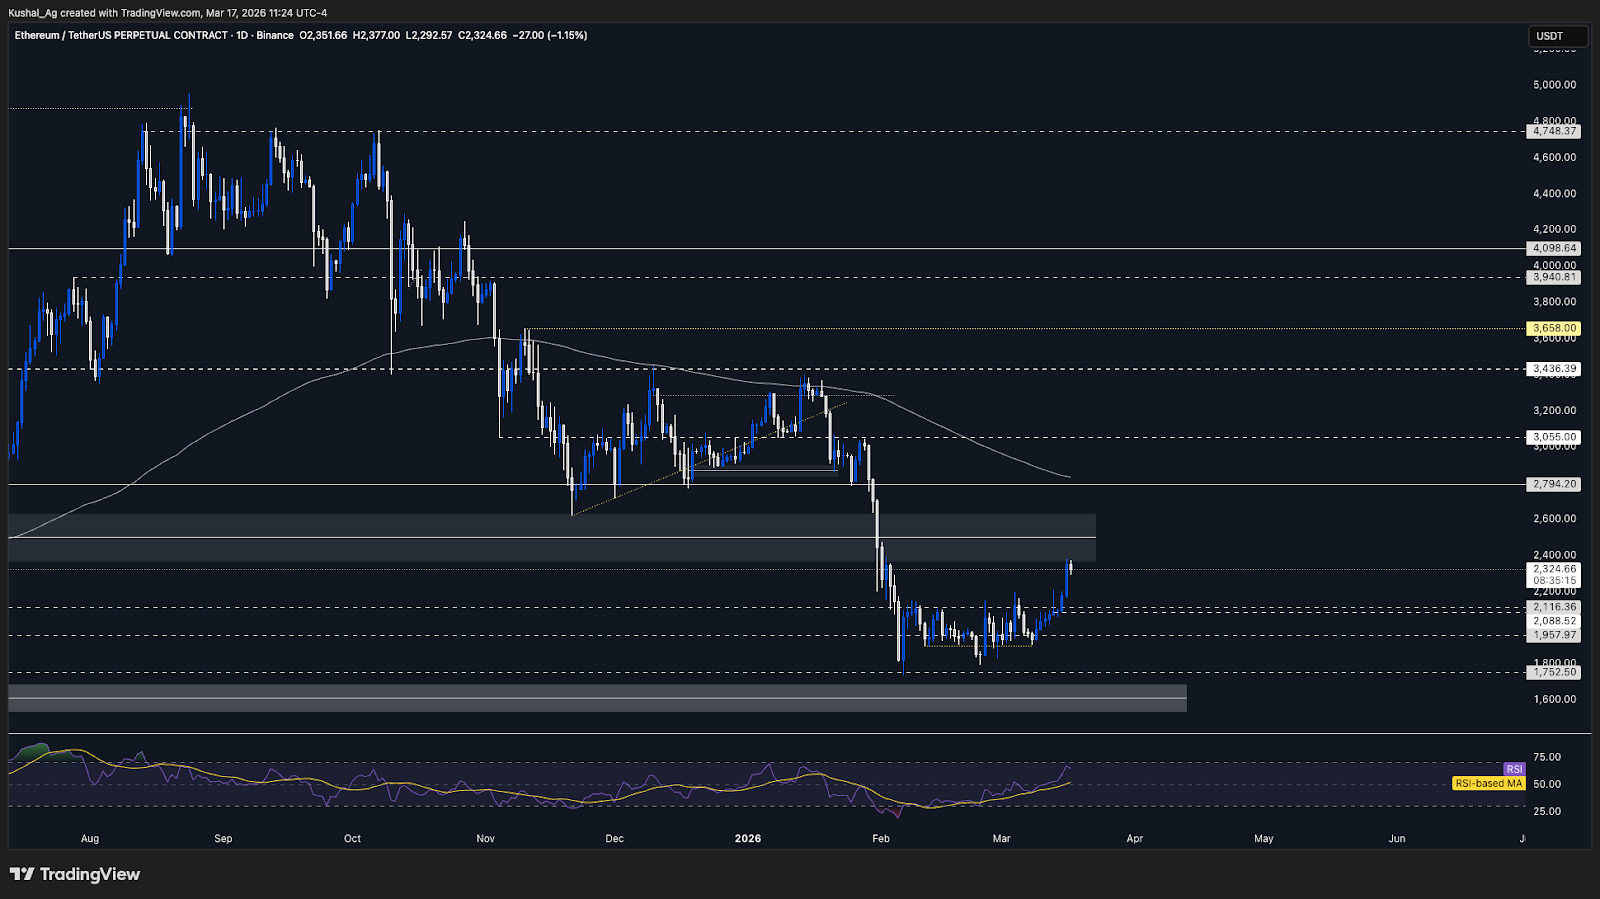
TAEthereum has played out the previous bullish setup almost perfectly, with price delivering a clean breakout above the $2,116-$2,150 region and following through toward the upside. Post-breakout, Ethereum rallied into the $2,367 resistance zone, effectively completing the move we had been tracking.
Price is now reacting from this resistance region, which is expected given this was the next major supply zone. With the initial breakout move already played out, Ethereum is once again sitting at a decision point, where continuation or consolidation will be determined by how price behaves around this level.
For continuation, the key level to watch is a daily close above $2,385 (previous day’s high). If Ethereum is able to secure acceptance above this region, we would expect a continuation toward $2,500 initially, followed by $2,590-$2,600 as the next upside targets.
However, if price fails to hold above $2,367 and continues to reject, we could see Ethereum move into a consolidation phase or a short-term pullback, with the next support sitting around $2,270, followed by $2,116 as the broader support level.
The 200 EMA on the daily timeframe is beginning to flatten and is currently around $2,831, indicating some stabilization in the higher timeframe structure. RSI is currently around 65 with an average near 52, showing strong momentum, although not yet in overbought territory, leaving room for further upside if continuation confirms.
Key Levels:
- Support: $2,270
- Resistance: $2,367
- Direction: Neutral
- Upside Target: $2,500-$2,600
- Downside Target: $2,116
Cryptonary’s Take:
Ethereum has already completed the breakout move we were tracking, with price reacting from the $2,367 resistance zone. This move was also supported by the ETH/BTC ratio, where the 0.029 level held and price broke above 0.03, a level we had highlighted as key for Ethereum outperformance. That scenario has now played out cleanly, with Ethereum outperforming Bitcoin and reaching its upside targets, while Bitcoin continues to struggle at resistance. This reinforces the importance of tracking relative strength pairs like ETH/BTC for early signals.With the primary upside move now delivered, Ethereum is entering a phase of decision around resistance. A confirmed breakout above $2,385 would re-establish continuation toward $2,500 and $2,600, while failure to sustain above this region could lead to short-term consolidation or a pullback. For now, this justifies maintaining a neutral stance as we wait for the next directional confirmation.
Solana – Confirmed breakout and new support:
Solana
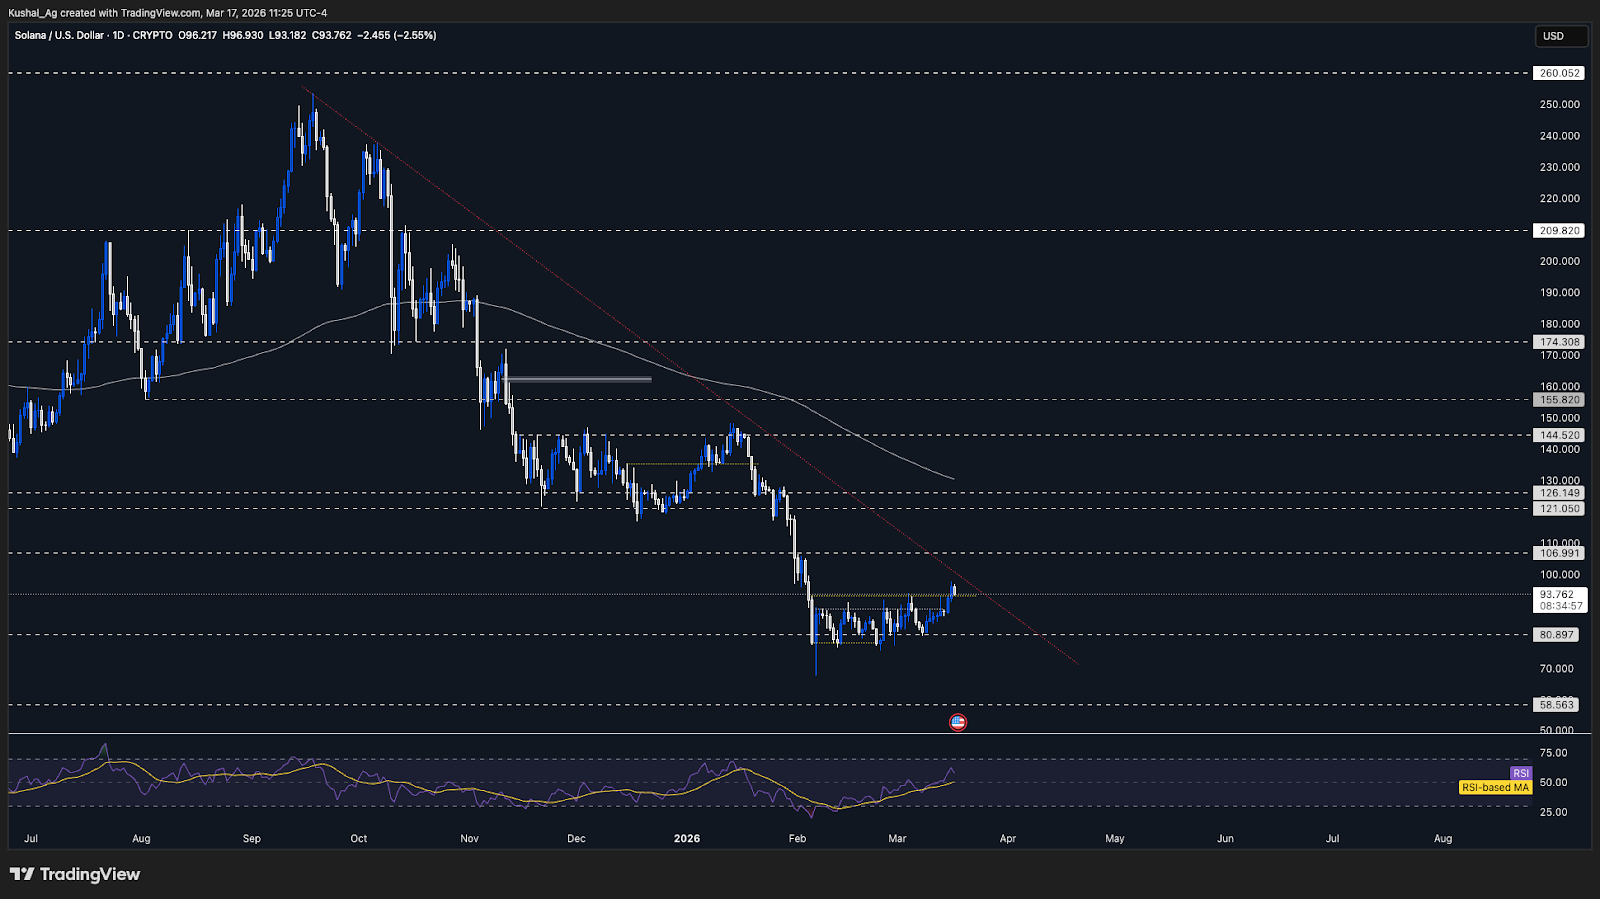
TASolana has now delivered a clean breakout above the $93.18 resistance, which was the key level we had been tracking. Not only did price close above this level on the daily timeframe, but it has also started to retest this region as support, marking an important structural shift in the short term.
The focus now shifts to whether $93.18 is able to hold as support. As long as price continues to maintain above this level, the structure remains constructive, and we can expect continuation toward higher targets. This level now becomes the key pivot for maintaining the current bullish structure.
With this breakout, we continue to hold a neutral-bullish stance on Solana. If the support holds, the next upside levels to watch are $100 initially, followed by the broader target at $106.9 in the short to medium term.
On the downside, a loss of $93.18 would weaken the current setup and likely lead to a rotation back toward the $88-$89 region, which previously acted as resistance and may now act as the next support zone. This would effectively invalidate the immediate bullish continuation thesis.
The 200 EMA on the daily timeframe continues to slope downward and is currently around $130.3, indicating that the broader higher-timeframe trend is still under pressure. RSI is around 60 with an average near 50, showing healthy momentum and supporting the current short-term strength in price action.
Key Levels:
- Support: $93.18
- Resistance: $100
- Direction: Neutral-Bullish
- Upside Target: $106.9
- Downside Target: $88
Cryptonary’s Take:
Solana has now successfully reclaimed a key level at $93.18, which shifts the short-term structure into a more constructive phase. As long as this level continues to hold as support, the market remains positioned for further upside continuation toward $100 and $106.9.However, this remains a level that needs to be respected. A failure to hold above $93.18 would likely push Solana back into its prior range, making this the key level to watch for validation of the current neutral-bullish stance.
Hyperliquid – Short-term strength above $39.97:
Hyperliquid
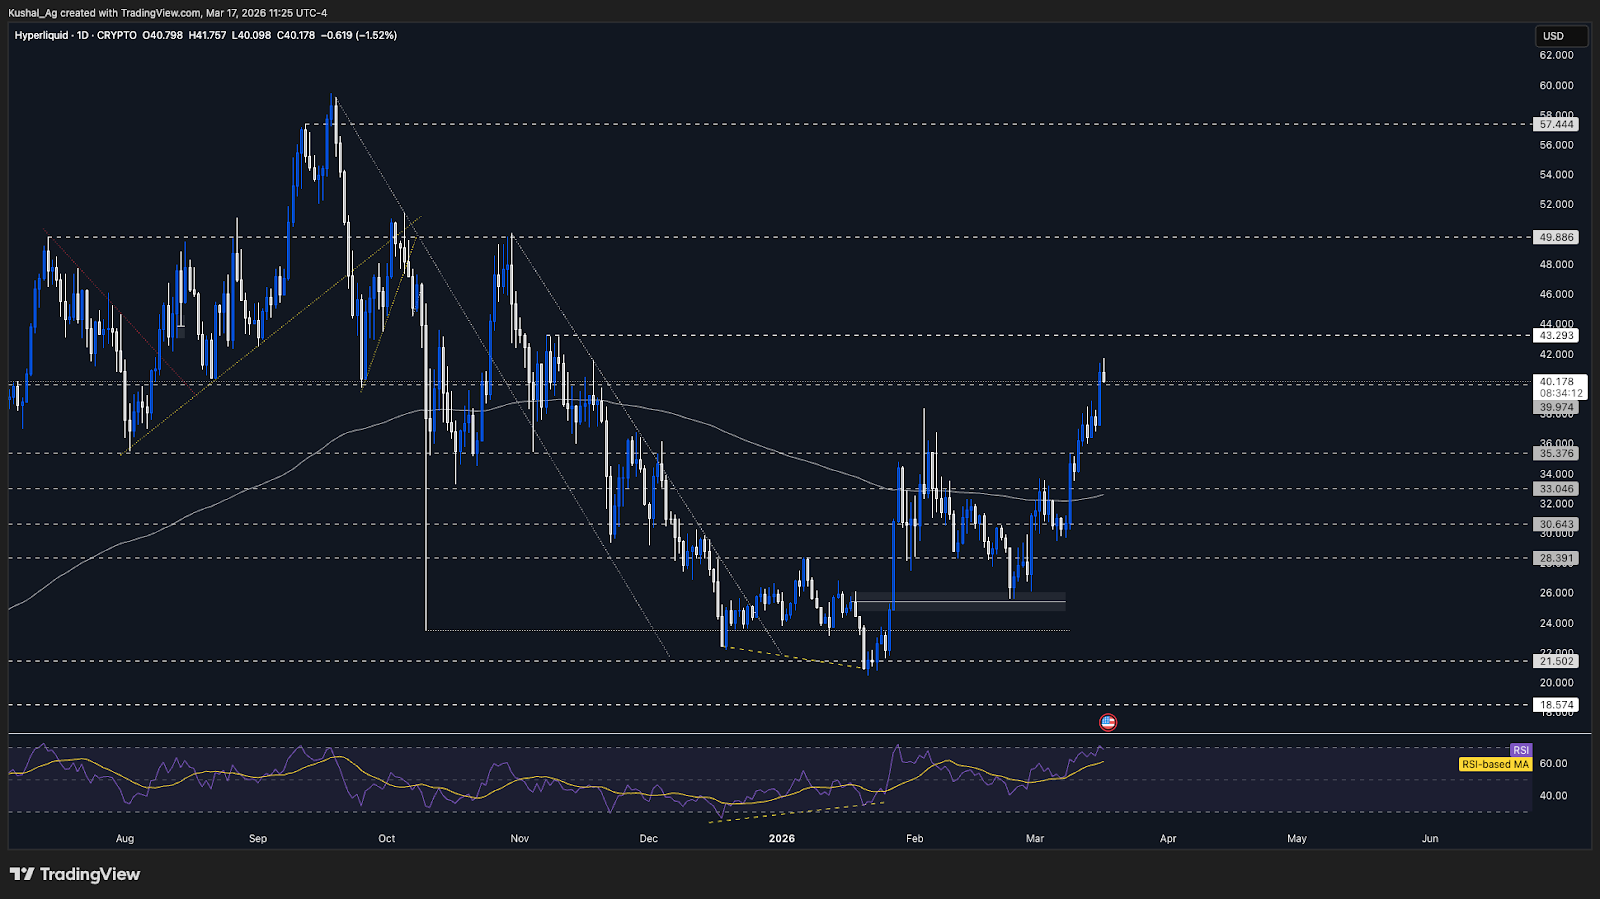
TAHyperliquid has delivered the $39.97 target we had been tracking and has now even broken above it, confirming continued strength in the short term. Price is currently holding above this level, although it has not yet properly retested $39.97 as support, which becomes an important factor to monitor going forward.
The key focus now is how price behaves around the $39.97 region, which has flipped from resistance into support. A successful hold above this level would keep the structure constructive and allow for further upside continuation.
As long as $39.97 holds, we continue to maintain a neutral-bullish stance on Hyperliquid. The next resistance and immediate upside target sits at $43.29, which is the next key level to watch in the current structure.
If Hyperliquid is able to break and close above $43.29, we would then look toward the next upside target around $49.8-$50, marking the next major liquidity zone on the chart.
On the downside, a daily close below $39.97 would weaken the current structure and likely shift the stance back toward neutral or neutral-bearish, opening the path toward the $35.37 support region as the next downside target.
The 200 EMA on the daily timeframe is relatively flat around $32.6, suggesting stabilization in the broader structure. RSI is currently around 70 with an average near 62, indicating strong momentum, although nearing overbought conditions, which could lead to short-term cooling.
Key Levels:
- Support: $39.97
- Resistance: $43.29
- Direction: Neutral-Bullish
- Upside Target: $49.8
- Downside Target: $35.37
Cryptonary’s Take:
Hyperliquid continues to show strong follow-through after reclaiming $39.97, and as long as this level holds as support, the structure remains favorable for further upside toward $43.29.However, the lack of a proper retest of this level means that $39.97 remains a key validation point. A failure to hold above it would likely trigger a pullback toward $35.37, while continued acceptance above it keeps the current neutral-bullish structure intact.
Aura – Waiting for breakout:
Aura
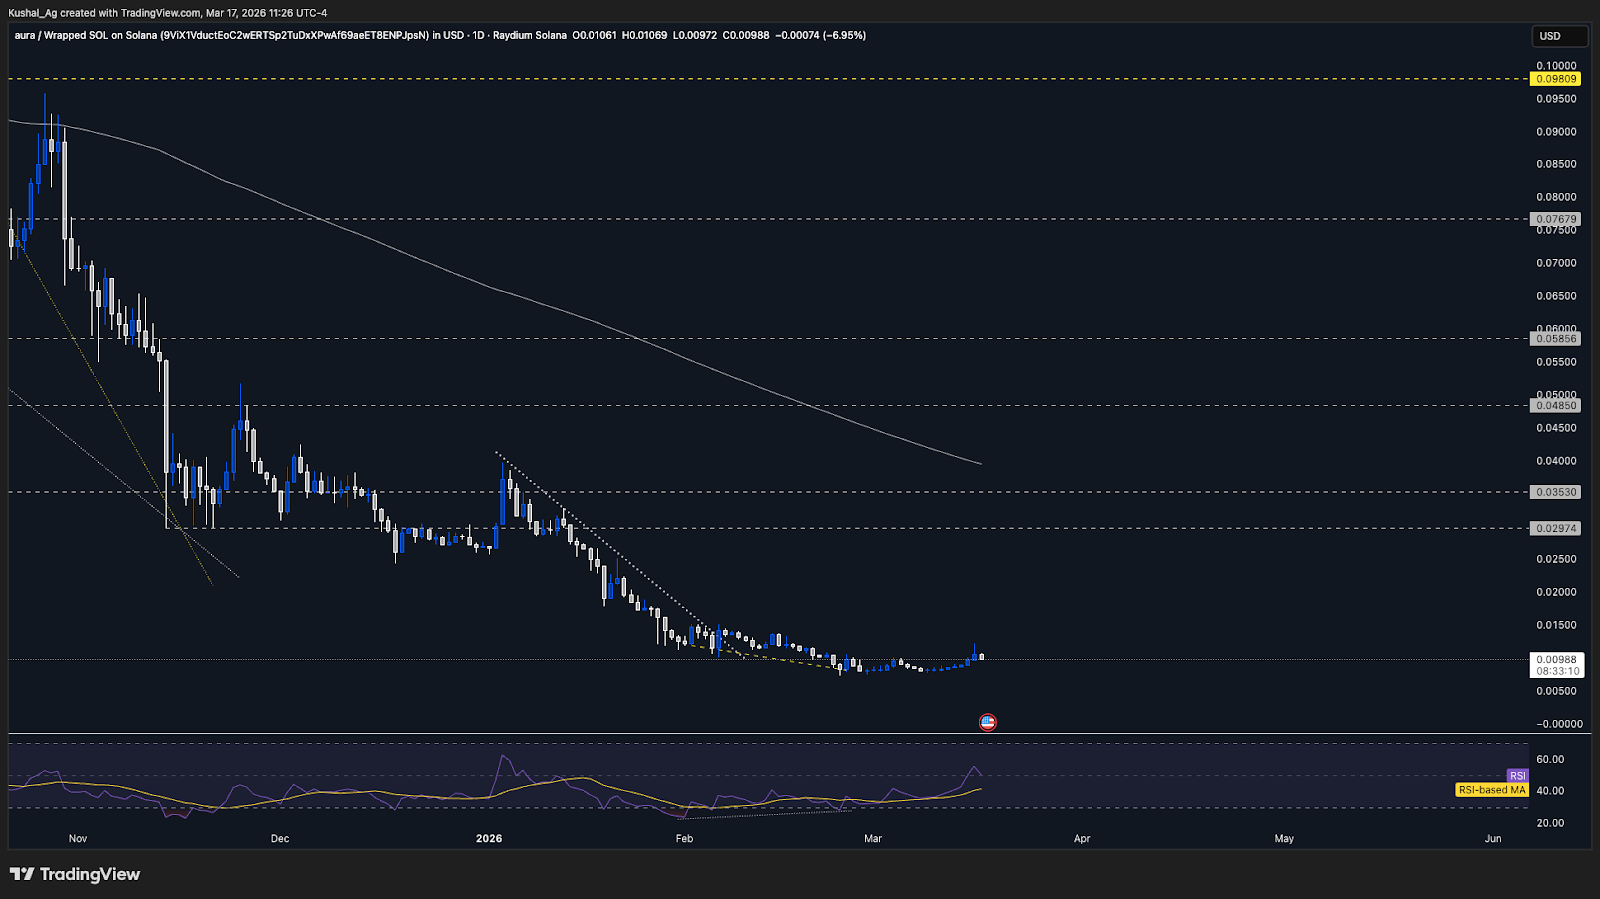
TAAura continues to remain in a wider consolidation range, continuing to trade sideways within the same broader zone.
We did see a short-term pickup in momentum as Solana broke out of its resistance, which led to a brief reaction in Aura as well, aligning with the expectation of spillover strength into higher beta assets.
However, this move has not yet translated into a structural breakout, and price continues to hold within the consolidation, suggesting that the asset is still waiting for a stronger directional catalyst.
The 200 EMA on the daily timeframe continues to slope downward around 0.039, while RSI is around 51 with an average near 41, indicating some recovery in momentum but no strong directional bias yet.
Cryptonary’s Take:
Aura continues to remain in a waiting phase, with price largely driven by broader ecosystem dynamics, especially solana. The recent strength in Solana did translate into some short-term upside here, and if that momentum continues, we could see further spillover into Aura. However, until we see a clear breakout from the current consolidation, the asset remains in a range-bound structure with no confirmed directional bias.Stablecoin Dominance (USDT.D + USDC.D) – Decision zone:
USDT.D + USDC.D (Stablecoin Dominance)
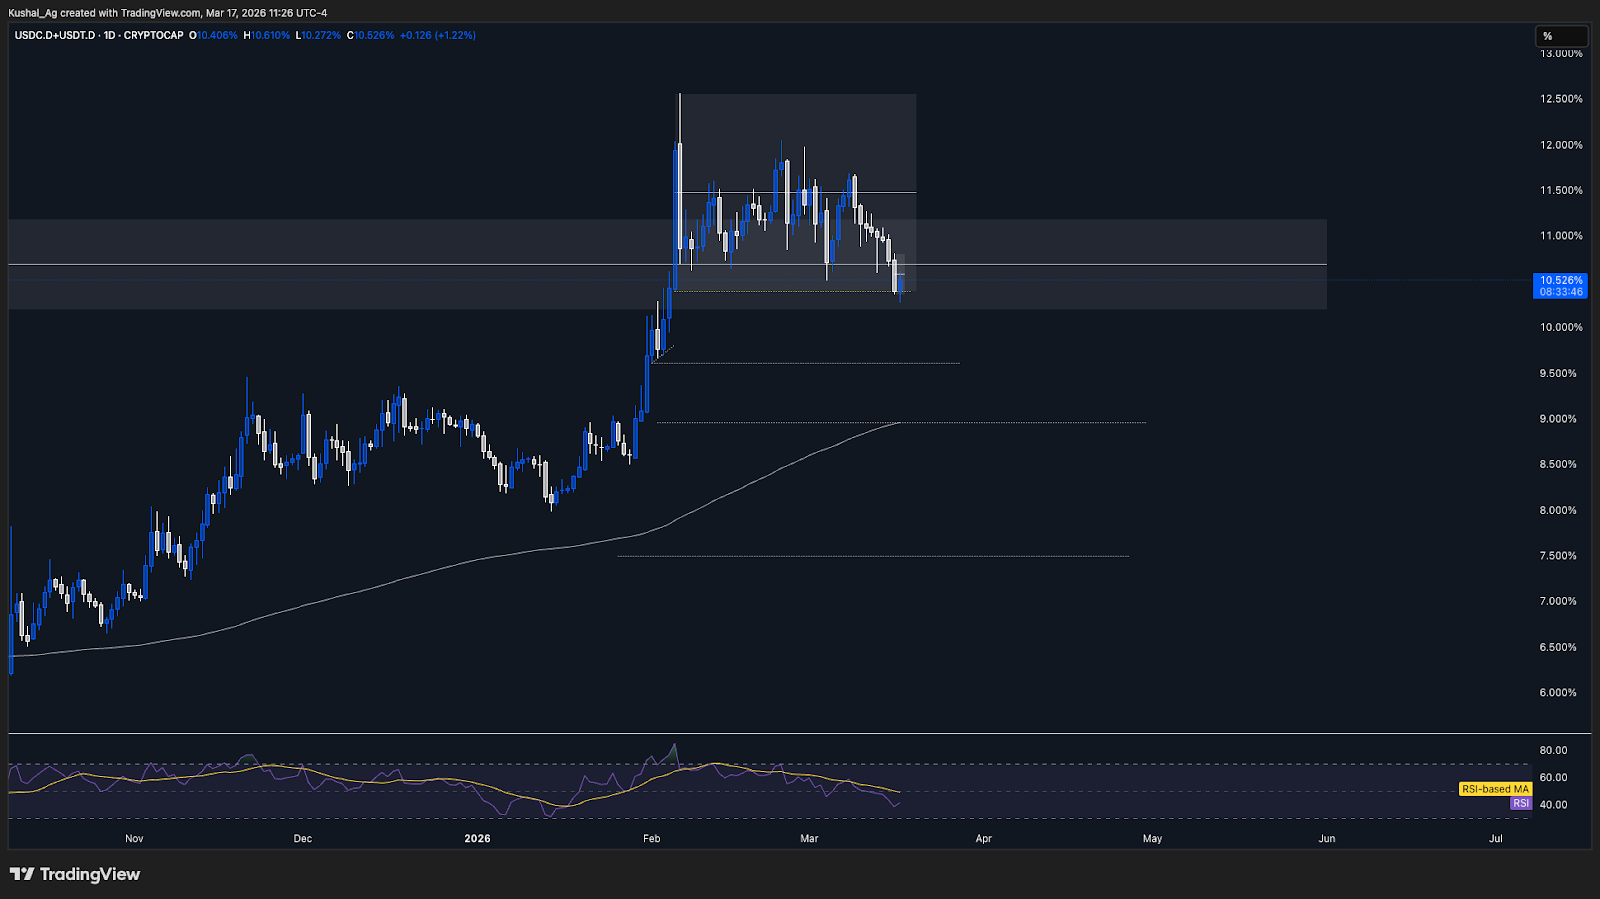
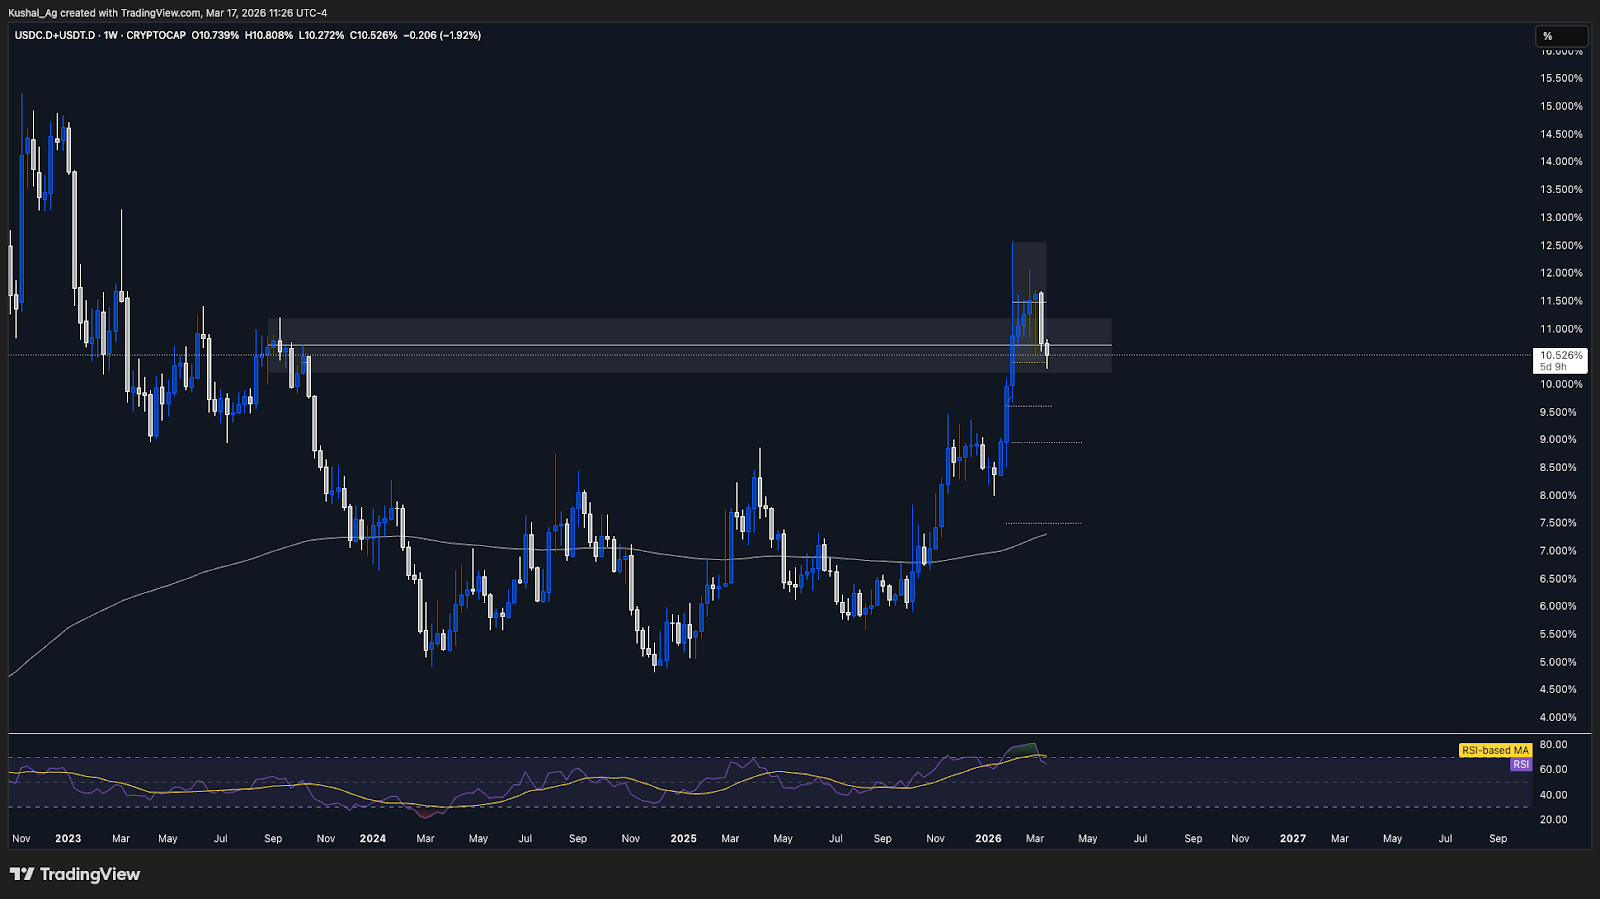
TAStablecoin dominance has approached the key 10.39% level, which corresponds to the low of the previously identified daily order block (5th Feb candle), making this a critical decision zone for market direction.
Price has wicked into 10.39% and reacted immediately, currently attempting to move higher on the daily timeframe, indicating that buyers are still defending this level for now.
A daily close above current levels (holding above 10.39%) would suggest that the order block is still unconfirmed, opening the door for further upside in dominance, which typically translates to downside pressure across crypto assets.
On the flip side, a clean daily close below 10.39% would confirm the order block breakdown, likely initiating a multi-week downtrend in dominance, with targets at 9.6%, 9%, and potentially 7.5%, a structurally bullish outcome for the broader crypto market.
The 200 EMA stands at 8.96% on the daily timeframe and 7.29% on the weekly timeframe, both acting as strong downside support zones if dominance begins to roll over, aligning with the lower target levels.
Cryptonary’s Take:
This is a high-impact inflection point for the market. Stablecoin dominance is sitting at a level that will likely dictate the next directional move across crypto. A sustained hold above 10.39% would indicate risk-off conditions continuing, with capital flowing into stablecoins and pressure on prices. However, a confirmed breakdown below this level would signal a shift back into risk assets, setting up a broader upside phase for the market over the coming weeks. The daily close here is critical, this is where direction gets decided.Closing Thoughts
We have reassessed the market structure today, shifting our neutral-bullish stance on Bitcoin back to neutral, as recent price action shows signs of rejection and uncertainty at higher levels. Ethereum also stays neutral, as the previously defined upside thesis has already played out cleanly and price is now sitting at resistance again, requiring fresh confirmation for further continuation.On the other hand, Solana and Hyperliquid continue to hold their neutral-bullish stance, as both assets are sustaining above key flipped support levels. As long as these levels hold, the structure remains constructive and allows for potential continuation on the upside.
The key variable right now is stablecoin dominance, which is sitting at a critical breaker zone around 10.39%. A clean daily close below this level would confirm downside continuation in dominance, supporting a broader upside across crypto markets. However, a wick below followed by a strong green close above would indicate a reclaim, likely leading to a bounce in dominance and downside pressure across crypto. This level is pivotal, and the direction from here could define the market over the next few weeks, we will be watching this closely and give out more frequent updates around this script.
Continue reading by joining Cryptonary Pro
$1,548 $1,197/year
Get everything you need to actively manage your portfolio and stay ahead. Ideal for investors seeking regular guidance and access to tools that help make informed decisions.
For your security, all orders are processed on a secured server.
As a Cryptonary Pro subscriber, you also get:
3X Value Guarantee - If cumulative documented upside does not reach 300% during your 12-month membership, you can request a full refund. Terms
24/7 access to experts with 50+ years’ experience
All of our top token picks for 2025
On hand technical analysis on any token of your choice
Weekly livestreams & ask us anything with the team
Daily insights on Macro, Mechanics, and On-chain
Curated list of top upcoming airdrops (free money)
3X Value Guarantee
If cumulative documented upside does not reach 300% during your 12-month membership, you can request a full refund.
Our track record speaks for itself
With over 2.4M tokens and widespread misinformation in crypto, we cut through the noise and consistently find winning assets.
Our track record speaks for itself
With over 2.4M tokens and widespread misinformation in crypto, we cut
through the noise and consistently find winning assets.


Frequently Asked Questions
Can I trust Cryptonary's calls?
Yes. We've consistently identified winners across multiple cycles. Bitcoin under $1,000, Ethereum under $70, Solana under $10, WIF from $0.003 to $5, PopCat from $0.004 to $2, SPX blasting past $1.70, and our latest pick has already 200X'd since June 2025. Everything is timestamped and public record.
Do I need to be an experienced trader or investor to benefit?
No. When we founded Cryptonary in 2017 the market was new to everyone. We intentionally created content that was easy to understand and actionable. That foundational principle is the crux of Cryptonary. Taking complex ideas and opportunities and presenting them in a way a 10 year old could understand.
What makes Cryptonary different from free crypto content on YouTube or Twitter?
Signal vs noise. We filter out 99.9% of garbage projects, provide data backed analysis, and have a proven track record of finding winners. Not to mention since Cryptonary's inception in 2017 we have never taken investment, sponsorship or partnership. Compare this to pretty much everyone else, no track record, and a long list of partnerships that cloud judgements.
Why is there no trial or refund policy?
We share highly sensitive, time-critical research. Once it's out, it can't be "returned." That's why membership is annual only. Crypto success takes time and commitment. If someone is not willing to invest 12 months into their future, there is no place for them at Cryptonary.
Do I get direct access to the Cryptonary team?
Yes. You will have 24/7 to the team that bought you BTC at $1,000, ETH at $70, and SOL at $10. Through our community chats, live Q&As, and member only channels, you can ask questions and interact directly with the team. Our team has over 50 years of combined experience which you can tap into every single day.
How often is content updated?
Daily. We provide real-time updates, weekly reports, emergency alerts, and live Q&As when the markets move fast. In crypto, the market moves fast, in Cryptonary, we move faster.
How does the 3X Value Guarantee work?
We stand behind the value of our research. If the documented upside from our published research during your 12-month membership does not exceed three times (3X) the annual subscription cost, you can request a full refund. Historical context: In every completed market cycle since 2017, cumulative documented upside has exceeded 10X this threshold.
TermsRecommended from Cryptonary


