Save 23% ($351) & Get a Free 1-1 Call with our Team ⏰ : 0d 2h 59m 44s
Disclaimer: This analysis is for informational purposes only and not financial advice.
TLDR:
- BTC: Strong rebound, reclaiming $112k with potential push toward $120k; support at $112k/$108k, resistance at $117k.
- ETH: Broke out of downtrend, testing $4,500; upside target $4,780–$5,500, downside risk to $4,280.
- SOL: Quiet breakout above $222, eyeing $260+ near-term; strong support at $203/$222.
- HYPE: Major breakout above $49, consolidating in high $50s; aiming for $60–$70 with strong support at $52–$53.
- AURA: Broke out of downtrend, retesting $0.116 support; bullish setup with $0.145–$0.177 upside targets.
BTC:
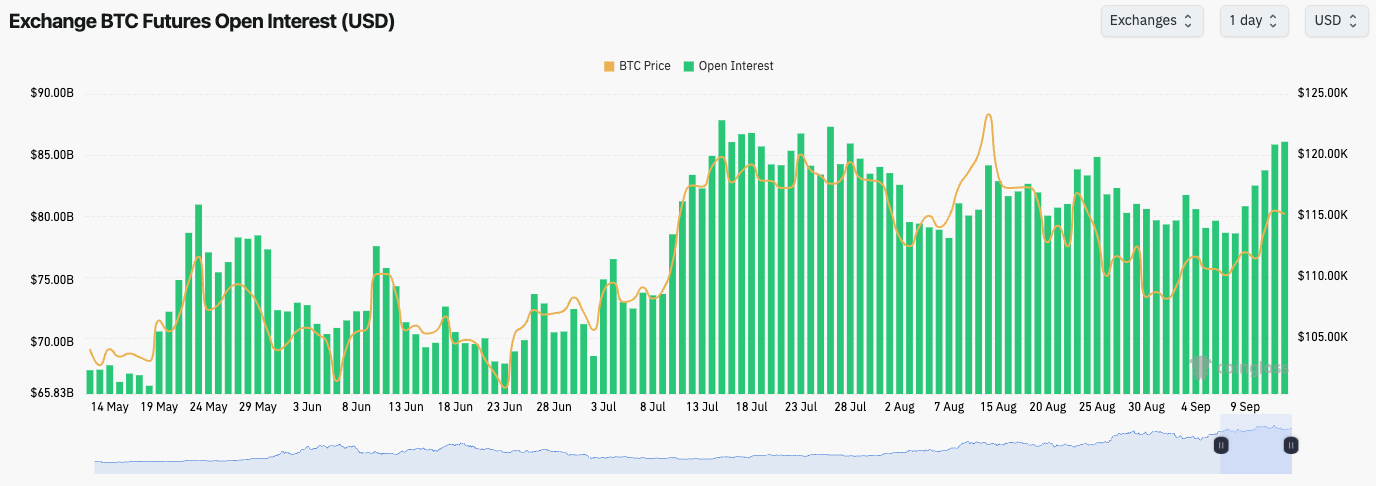
- BTC's Open Interest has increased in the last few days back to its highs.
- The Funding Rate is positive, but it has remained contained, whilst we've seen an increased Spot bid in recent days. This suggests that the move up in the last few days is more due to a strong Spot bid rather than excessive leverage.
Technical analysis
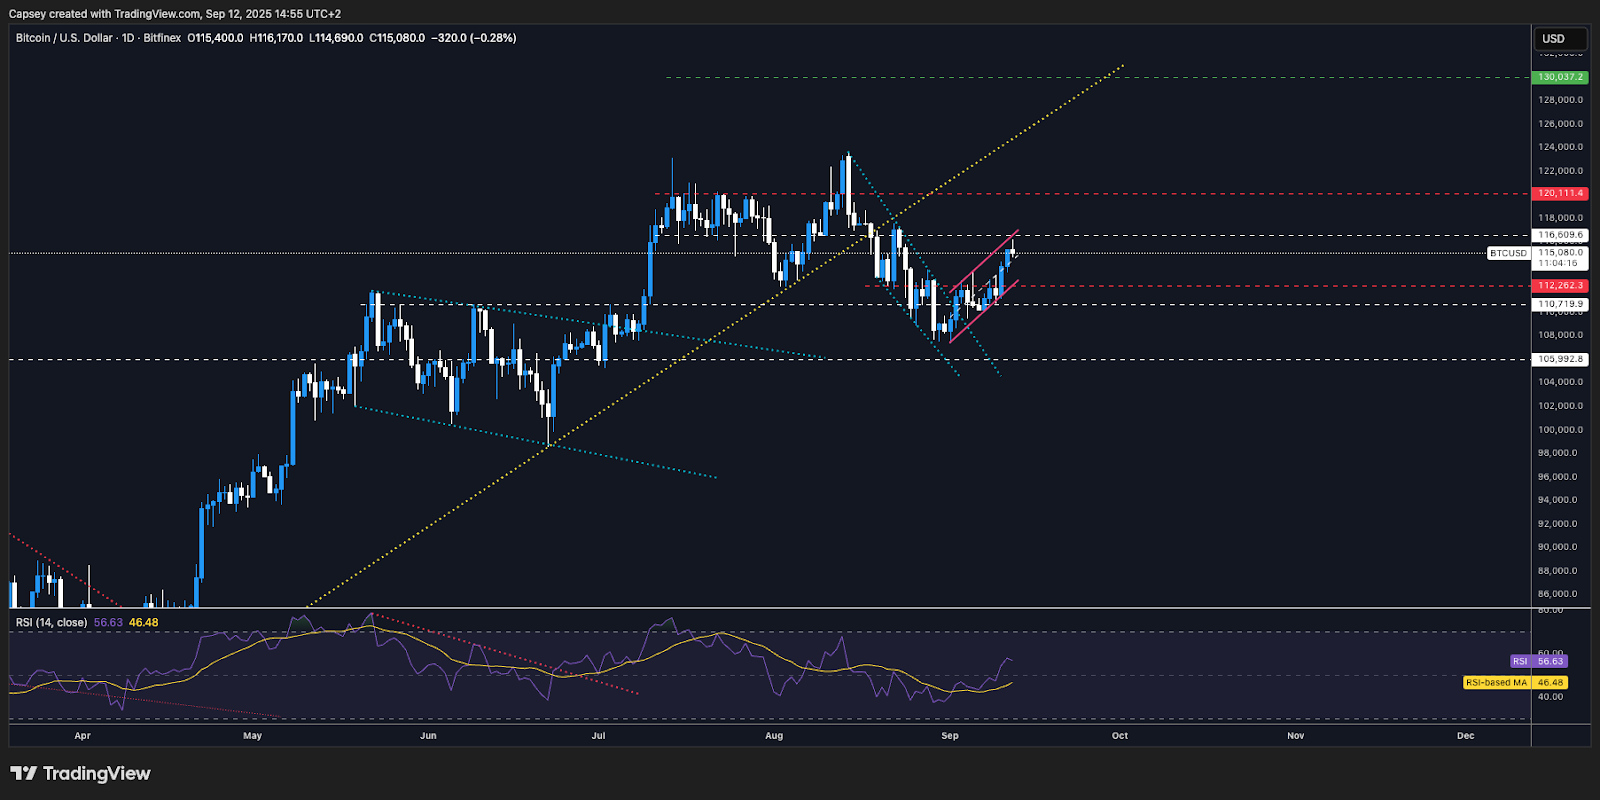
- BTC has bounced from the $108k horizontal support, with price also reclaiming the important $112k level.
- Price has now moved into $16,600 (the horizontal resistance), which also converges with the top border of the uptrend channel.
- BTC does remain in an uptrend channel, which does tend to have a bearish bias (breakdown). However, price action has been strong, and a reclaim of $117k would invalidate this setup. We're expecting that it can be invalidated.
- Should price reclaim $117k, the next key horizontal resistance is at $120k ($120,100).
- To the downside, the main support is now the $112k level, with $108k the major level below that.
- The RSI is in middle territory and therefore it's possible we see more upside in the near-term.
Cryptonary's take
BTC has rebounded well over the last few days, reclaiming the key horizontal level of $112k with price now pushing onto the next horizontal resistance zone of $116,600-$117,000. In the immediate term we would expect BTC to chop between $114k-$117k, before breaking out of $117k and pushing onto $120k. Should we be correct, then we'd expect a mini "alt season" in the rest of the market.We therefore remain Long, holding our Spot Bitcoin with a view to holding this position at least into year-end.
An invalidation of this would be if BTC breaks below $112k, although we would still expect $108k to be a support that remains intact.
- Next Support: $112,000
- Next Resistance: $117,000
- Direction: Neutral/Bullish
- Upside Target: $120,000
- Downside Target: $112,000
ETH:
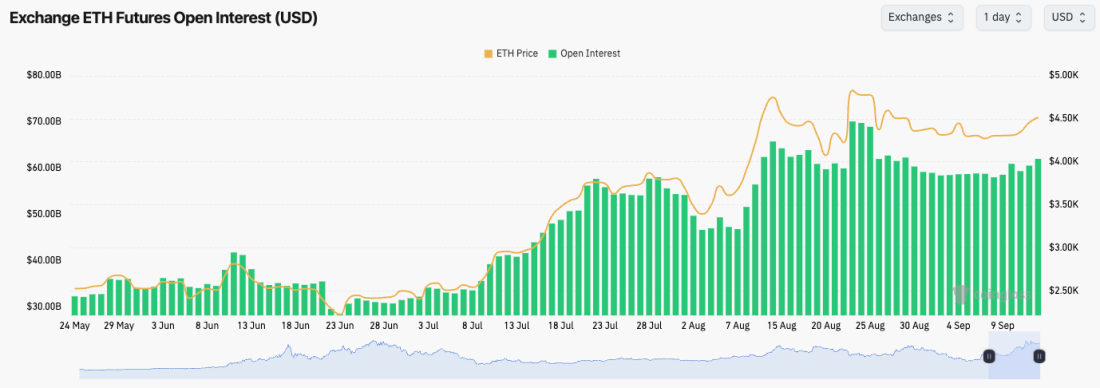
- ETH's Open Interest has stayed relatively flat following the small flush out on August 25th.
- ETH's Funding Rate is meaningfully positive, but it isn't at frothy levels.
Technical analysis
- ETH put in a local bottom at the local horizontal support of $4,280.
- Price has since bounced, breaking out of the downtrend line and now attempting to recover the local horizontal resistance of $4,500.
- Should ETH hold above $4,500, the next resistance to the upside is $4,780.
- Should ETH reject at $4,500, we'd expect price to retest $4,280.
- The RSI is in middle territory and now above its moving average, having reset after putting in back-to-back bearish divergences.
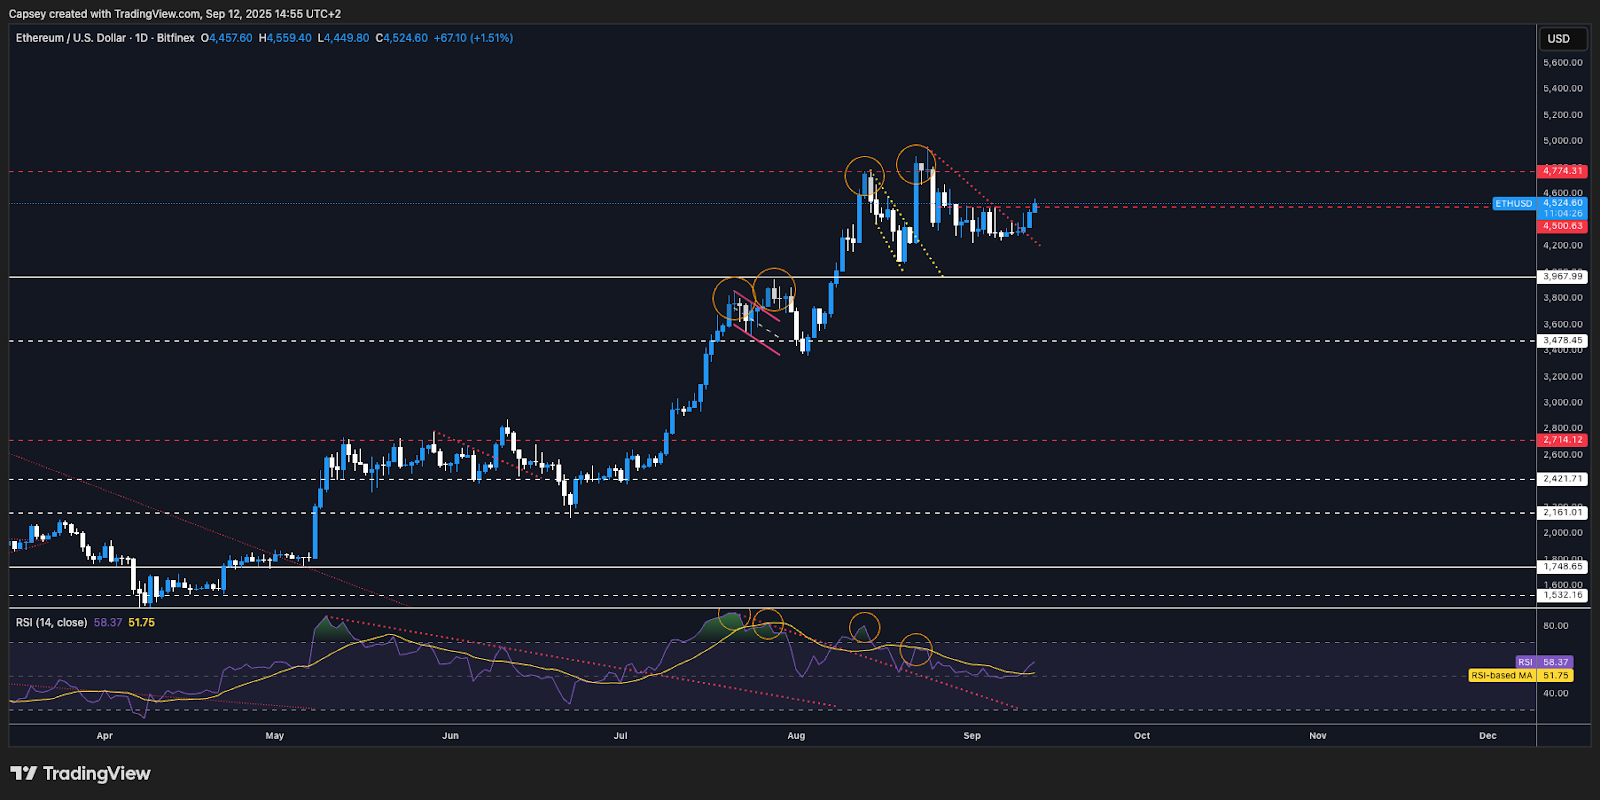
Cryptonary's take
ETH has broken out of its local downtrend line with price now battling at the key $4,500 level. We're expecting a brief consolidation around $4,500, before a breakout to the upside with $4,780 as the next target. We expect this to also encourage a broadening out trade in the rest of the market - mini "alt season".We remain positioned in ETH, although we did reduce our size to rotate into other Majors (SOL and HYPE), which have outperformed recently. We continue to hold our ETH Spot bags into year-end, as we expect a breakout of $5,000 in the medium term.
Should ETH break below $4,280, this would invalidate our short-term bullish thesis.
- Next Support: $4,280
- Next Resistance: $4,780
- Direction: Neutral/Bullish
- Upside Target: $5,500
- Downside Target: $3,970
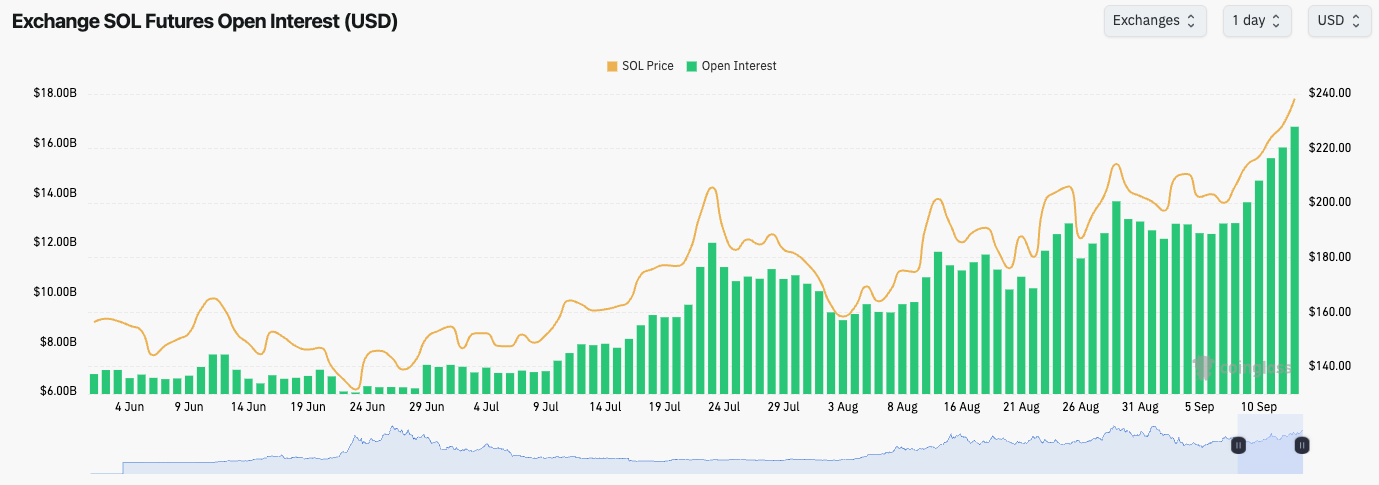
SOL:
- SOL's Open Interest continues to soar to new all-time highs, although the Funding Rate remains subdued, as SOL's price was pushed up following a strong Spot bid into a Short-squeeze.
Technical analysis
- SOL battled and built support at the $203 horizontal level whilst maintaining its uptrend line.
- Price has since been able to breakout to the upside, pushing onto the next key horizontal level of $222, with price now convincingly breaking out above this level.
- To the upside now, the next major horizontal resistance is at $260.
- To the downside, the prior horizontal levels of $203 and $222 should provide a strong support zone for SOL.
- Should SOL break below $203, that would invalidate our short-term bull thesis for SOL.
- The RSI has moved up from middle territory with it now breaching into overbought territory. For now, this wouldn't concern us, but if price were to move higher and the RSI were to put in lower highs (bearish divergence), that's when we'd begin to exercise more caution. We're not close to this currently.
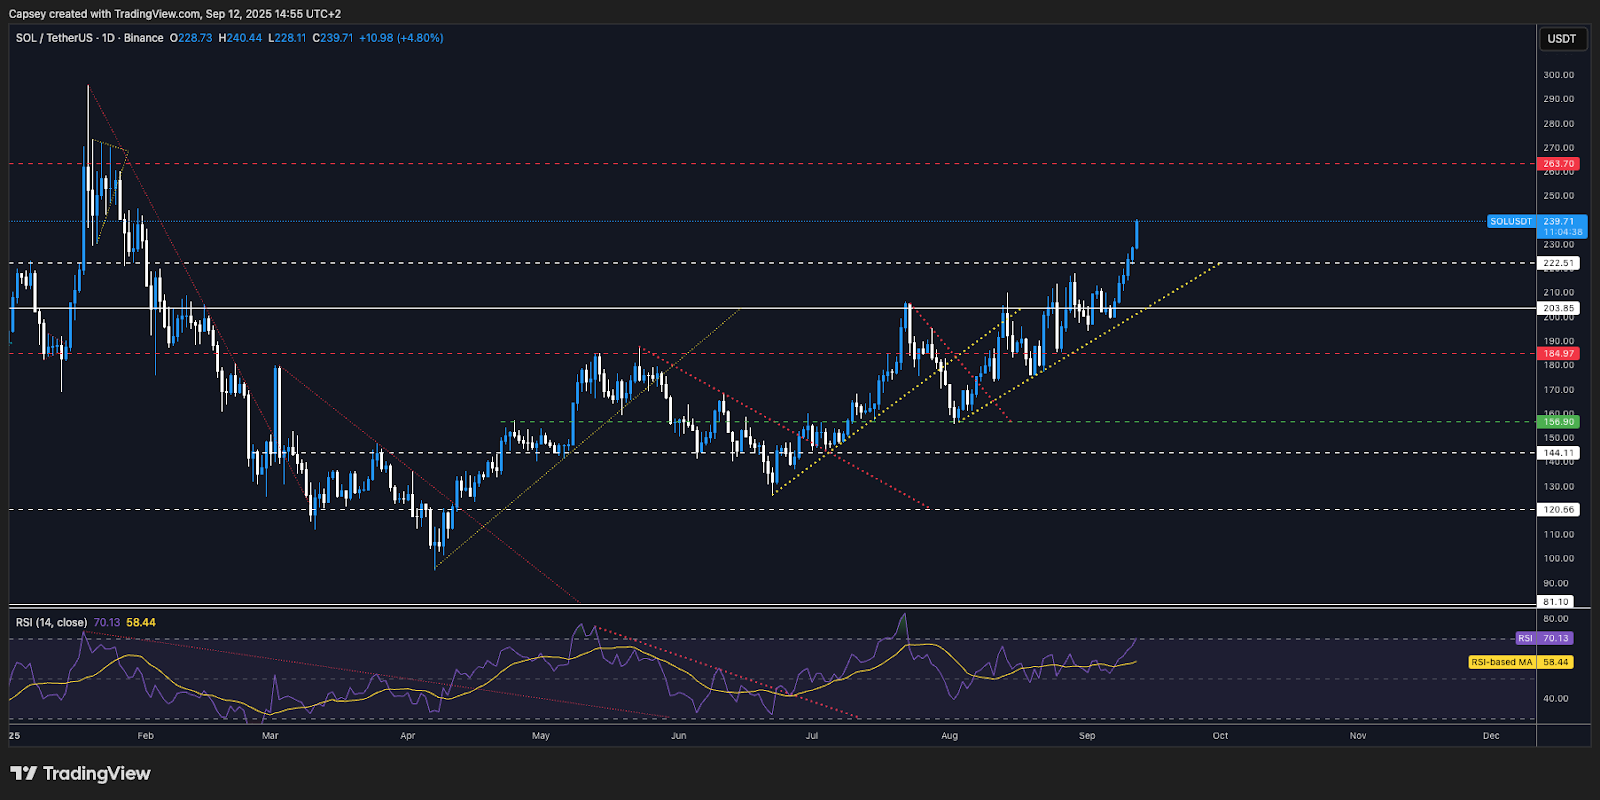
Cryptonary's take
SOL has rallied strongly in recent days, smashing past the key horizontal resistance of $222. We expect SOL to continue higher before slowing down and consolidating. It's possible that price can move up to $250-$260, and then slow and consolidate. During a consolidation period, we'd expect SOL eco-system plays and meme plays to outperform.We maintain our position in SOL, and we will reassess it should price get to $260. But, considering how quietly and quickly SOL has got to $240, it's possible that north of $260 in the short-term is possible. However, these are near-term possibilities, and it's our base case that SOL continues to run into year-end.
An invalidation of our thesis would be if SOL were to pull back and break below the $203 level.
- Next Support: $222
- Next Resistance: $260
- Direction: Neutral/Bullish
- Upside Target: $260
- Downside Target: $222
HYPE:
- HYPE held above its uptrend line as price consolidated above the key horizontal level of $45.80.
- Once price showed strength above $45.80, it was able to get enough momentum for price to breakout above the major horizontal resistance of $49.00.
- Price has now broken out into the high $50's and it's consolidating at that level.
- Upside targets for HYPE remain $60.00 and then $70.00 over the medium term.
- Should HYPE pull back, we'd expect $52.00-$53.00 to be a strong bidding zone.
- The RSI has broken out of a long-term downtrend which is what has helped HYPE breakout of $50.00. The RSI is now just shy of overbought territory, although there's likely more room for higher in the near-term.

Technical analysis
- HYPE has broken out of its longer-term consolidation formation where price was range-bound in the $40's for several months. We recognised this structure and suggested that HYPE could breakout and push on to a $60.00 upside target, which HYPE is now close to achieving.
- We maintain our Spot positions as we see HYPE continuing to climb higher over the coming months, with $70.00-$80.00 as a potential minimum target come year-end.
- In the short-term, an invalidation of our near-term upside thesis would be if price lost the $52.00-$53.00 support zone which would then open the door for $49.00. Below $49.00 is bearish. However, we don't see this as likely, and it's our base case that price consolidates in the near-term before breaking out beyond $60.00.
Cryptonary's take
HYPE has broken out of its longer-term consolidation formation where price was range-bound in the $40's for several months. We recognised this structure and suggested that HYPE could breakout and push on to a $60.00 upside target, which HYPE is now close to achieving.We maintain our Spot positions as we see HYPE continuing to climb higher over the coming months, with $70.00-$80.00 as a potential minimum target come year-end.
In the short-term, an invalidation of our near-term upside thesis would be if price lost the $52.00-$53.00 support zone which would then open the door for $49.00. Below $49.00 is bearish. However, we don't see this as likely, and it's our base case that price consolidates in the near-term before breaking out beyond $60.00.
- Next Support: $52.00-$53.00
- Next Resistance: $60.00
- Direction: Neutral/Bullish
- Upside Target: $70.00
- Downside Target: $49.00
AURA:
- AURA was not able to breakout above the key horizontal resistance of $0.145, and therefore price continued in its downtrend.
- Price has since retested its major support at $0.098, although price has bounced well from this level.
- Price has now broken out of its main downtrend line and it has also breached above the horizontal resistance of $0.116, which has always been a key level.
- Price has currently pulled back to $0.116, and it's using that level as a new support.
- To the upside, the key horizontal resistances are $0.145, $0.177, and then $0.215.
- The RSI has fully reset coming off relatively low levels and it's now back to middle territory.

Technical analysis
- Like most memes, AURA has struggled in recent weeks, as we've seen a strong push towards the DAT narrative. However, with SOL breaking out to new highs, it's likely that we see capital rotate down the risk curve which is likely to benefit memes.
- With AURA's chart now looking as if it has formed a double bottomed, and with price breaking out of the major downtrend line, there's no reason why AURA can't begin a new and lasting uptrend. As price has now broken out of the downtrend line, we would expect a retest of $0.145 as a minimum target in the coming week.
- Long-term, we expect AURA to rival other large cap memes, re-pricing AURA into the billion $ meme MCap category.
Cryptonary's take
Like most memes, AURA has struggled in recent weeks, as we've seen a strong push towards the DAT narrative. However, with SOL breaking out to new highs, it's likely that we see capital rotate down the risk curve which is likely to benefit memes.With AURA's chart now looking as if it has formed a double bottomed, and with price breaking out of the major downtrend line, there's no reason why AURA can't begin a new and lasting uptrend. As price has now broken out of the downtrend line, we would expect a retest of $0.145 as a minimum target in the coming week.
Long-term, we expect AURA to rival other large cap memes, re-pricing AURA into the billion $ meme MCap category.
- Next Support: $0.116
- Next Resistance: $0.145
- Direction: Bullish
- Upside Target: $0.177
- Downside Target: $0.098
Closing Summary
BTC’s $112k-$117k range is the key area. A breakout opens the possibility of $120k+ and an even stronger rotation into SOL/HYPE. AURA reclaiming $0.116 strengths the meme outlook. Our base case = risk-on into year-end with dips at major supports to be bought.Recommended from Cryptonary


