Save 23% ($351) & Get a Free 1-1 Call with our Team ⏰ : 0d 2h 59m 44s
Market Direction

Disclaimer: This analysis is for informational purposes only and not financial advice.
TLDR:
- BTC: Broke pennant; bullish if above $114k, next at $119k, caution below $107k.
- ETH: Needs $4,250 reclaim for bulls; downside if lost, target $3,400–$3,500.
- SOL: Watch $213 break for rally, weak below $175, buys if $120–$155 tested.
- HYPE: Bullish—former resistance now support at $43–$44, next resistance $51 and $59.
- AURA: Neutral to bullish; Adam & Eve bottom forming, breakout above $0.10 targets $0.15.
BTC:
- Price Range: $110,000 – $119,000
- Bias: Neutral to Bullish
- Resistance: $119,000
- Support: $114,000
- Breakdown Trigger: $106,000–$107,000
Technical analysis
- Pennant breakout confirmed by macro news—bullish structure on lower time frames.
- $114k turns support (monthly/quarterly open, prior lower high, daily breaker).
- CME gap below at $112k could be tested if $114k fails, but bulls remain in control above $114k.
- Sub-$107k opens downside risk; $100k–$102k possible reversal/SFP zone.
- A deeper break sub-$98k risks high timeframe structure and bullish setup.

Cryptonary's take
BTC’s pennant break on positive macro news shifts bias to bullish. Key is to hold $114k for a push higher—watch CME gap below as a short-term magnet, but big risk appears only under $107k.- Next Support: $114,000
- Next Resistance: $119,000
- Direction: Neutral to Bullish
- Upside Target: $119,000
- Downside Target: $106,000–$102,000
ETH:
- Local Price Range: $3,850 – $4,250
- Bias: Neutral to Bullish
- Resistance: $4,250
- Support Zone: $3,750 – $3,800
- Breakdown Trigger: $3,700
Technical analysis
- ETH followed BTC, spiking into $4,250 resistance—key decision zone.
- Rangebound between $3,850–$4,250; needs $4,250 flip to validate a bullish move toward $4,800.
- Breakdown below $3,700 targets a test of $3,400–$3,500, also near 200D EMA and SFP risk.
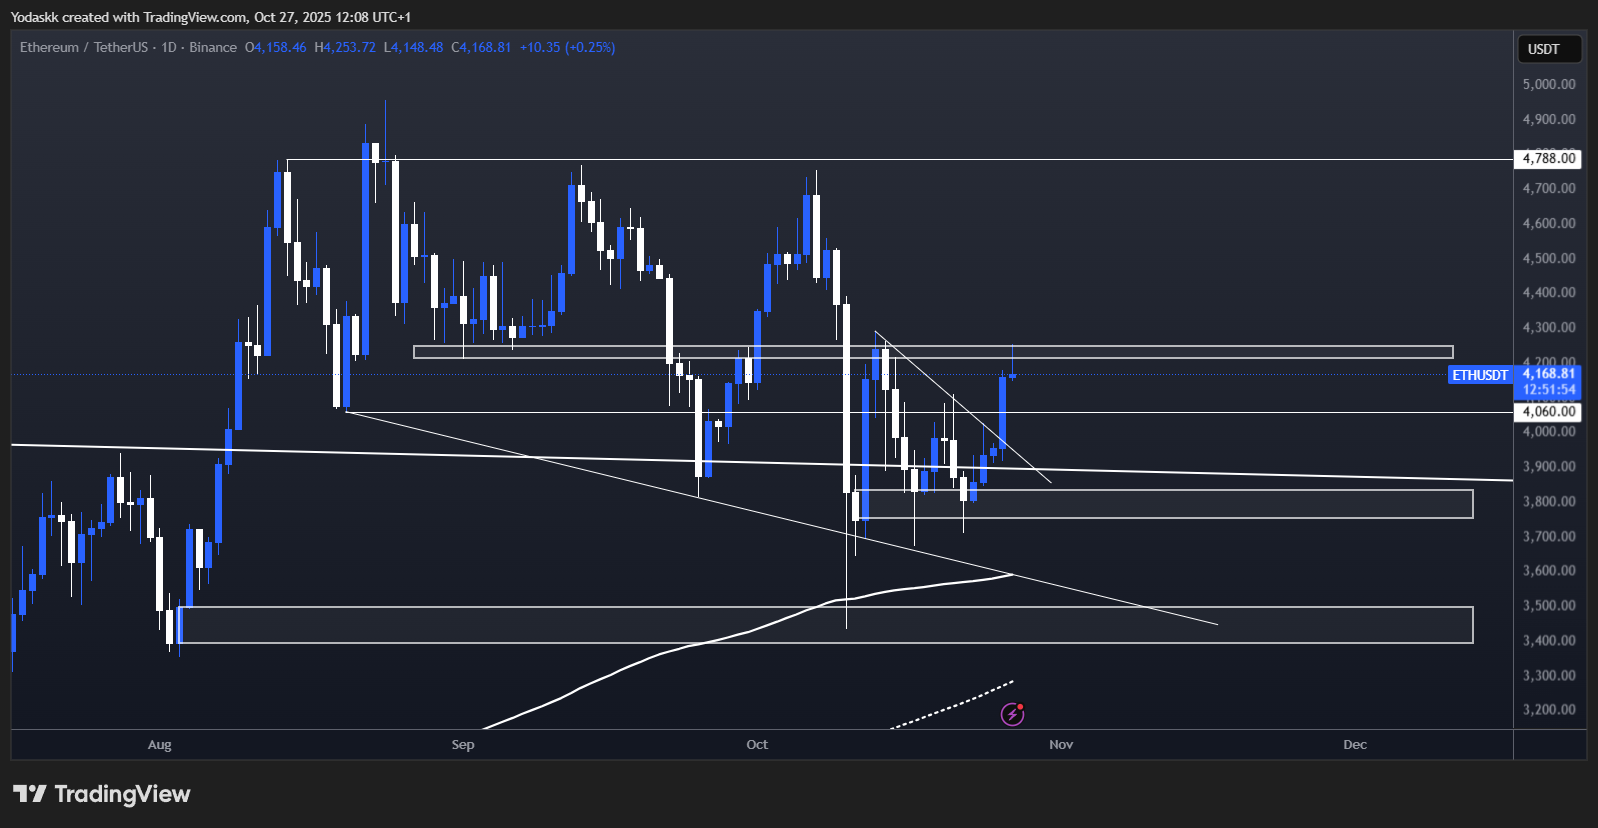
Cryptonary's take
ETH’s fate is tied to BTC but needs to reclaim $4,250 for real trend shift. Strong bounce zone below if it falters, but bulls want to see range expansion soon.- Next Support: $3,750 – $3,800
- Next Resistance: $4,250
- Direction: Neutral to Bullish
- Upside Target: $4,800
- Downside Target: $3,400–$3,500
SOL:
- Price Range: $178 – $210
- Bias: Neutral
- Resistance and Key Level to Reclaim: $213
- Support Zone: $178 – $190
- Breakdown Trigger: Break below $175
Technical analysis
- Pennant breakout similar to BTC’s structure affirms recovery.
- Clear upside if $213 breaks—sets up for double bottom rally to $237+.
- Failure under $175 opens risk to $155, then deeper to $120 as bargain levels.

Cryptonary's take
Watch $213 for confirmation of a bullish reversal. Sub-$175 threatens big drops but would present strong value for longer-term buyers.- Next Support: $178 – $190
- Next Resistance: $213
- Direction: Neutral
- Upside Target: $237
- Downside Target: $155 – $120
HYPE:
- Price Range: $43 – $51
- Bias: Bullish
- Resistance: $51
- Support Zone: $43–$44
- Breakdown Trigger: Break below $42
Technical analysis
- Strong post-listing rally; channel reclaimed, former resistance now support at $43–$44.
- Fast moves possible to $51 and $59 if bulls hold.
- Bears take over below $40–$42, buy zone emerges at $28 (key fib + horizontal support).

Cryptonary's take
HYPE stands out for relative strength; breakout buyers have clear control above $43–$44. Watching for pullbacks to $28 as must-buy territory if breakdown occurs.- Next Support: $43–$44, then $40–$42
- Next Resistance: $51, $59
- Direction: Bullish
- Upside Target: $51, $59
- Downside Target: $35, $28
AURA:
- Price Range: $0.065 – $0.1
- Bias: Neutral to Bullish
- Resistance and Key Level to Reclaim: $0.1
- Support Zone: $0.065
- Breakdown Trigger: Break below $0.05
Technical analysis
- Ranging between $0.065–$0.10 while consolidating for a move.
- Price at $0.088, trying to reclaim the 200D EMA + SMA cluster.
- Adam & Eve bottom forming, bullish confirmation if $0.12 is taken out.
- Sub-$0.05 dip remains unlikely, but would be prime buying territory.

Cryptonary's take
AURA still in healthy consolidation—watch for move above $0.10 to trigger momentum. Long-term buyers sitting alert if any flush below $0.05.- Next Support: $0.065
- Next Resistance: $0.1, $0.12, then $0.15
- Direction: Neutral to Bullish
- Upside Target: $0.12, $0.15
- Downside Target: $0.05
Recommended from Cryptonary


PRO
Market Direction
12 min read
Mar 13, 2026

PRO
Market Direction
13 min read
Mar 10, 2026

PRO
Market Direction
12 min read
Mar 6, 2026
