Save 23% ($351) & Get a Free 1-1 Call with our Team ⏰ : 0d 2h 59m 44s
BTC, ETH and More: Bullish Divergence Setups Develop
Recent price action confirms a transition from consolidation into continuation. Breakdowns across Bitcoin, Ethereum, and high-beta assets signal persistent underlying weakness, while macro conditions continue to limit risk appetite. This report evaluates the current structural landscape and the key triggers that will define the next market phase...
Disclaimer: This is not financial or investment advice. You are responsible for any capital-related decisions you make, and only you are accountable for the results.
Quick bridge from last week…
Last Friday’s stance played out almost exactly as mapped. Bitcoin and Ethereum rotated into their respective support levels and, as expected, those supports failed to hold, confirming continuation lower. Solana moved cleanly from range mid back toward the $78 range lows, aligning with the continued chop thesis. Hyperliquid delivered the clearest technical execution, the lower high below $30.64 was followed by a decisive breakdown into $25.4, nearly to the dollar. Structurally, last week unfolded in line with expectations across all majors.The broader takeaway is that breakdowns occurred in an environment where bounces lacked strength, reinforcing underlying pressure. This aligns with the macro tone we’ve been highlighting, risk remains elevated and liquidity conditions are not meaningfully improving. For a deeper dive into the macro drivers currently shaping market conditions, including tariffs, rate path developments, Nvidia earnings and geopolitical dynamics, refer to yesterday’s Market Update.
Disclaimer: This content is for informational and educational purposes only. It does not constitute financial advice, and should not be relied upon as a basis for making investment decisions. Virtual assets are volatile and may lose their value in full. Past performance does not indicate future results. Always do your own research.
TLDR
Risk Posture: Defensive- Bitcoin (BTC): Broke below $65.6K and rotated into $62K support, neutral-bearish while below $65.6K, with $59.8K-$57.3K next unless bullish divergence confirms.
- Ethereum (ETH): Lost $1,957 support and nearing $1,752, neutral-bearish unless divergence confirms, with $1,618 as downside targets if weakness persists.
- Solana (SOL): Deviating below $78 range low, neutral at inflection point, breakdown opens $67.7, divergence + reclaim revives $89-$97.7.
- Hyperliquid (HYPE): Clean breakdown to $25.4; bearish below $30.64, with $23.5 next if current support fails.
- Aura (AURA): Under pressure but forming potential another bullish divergence, needs RSI hold and strength confirmation.
Bitcoin
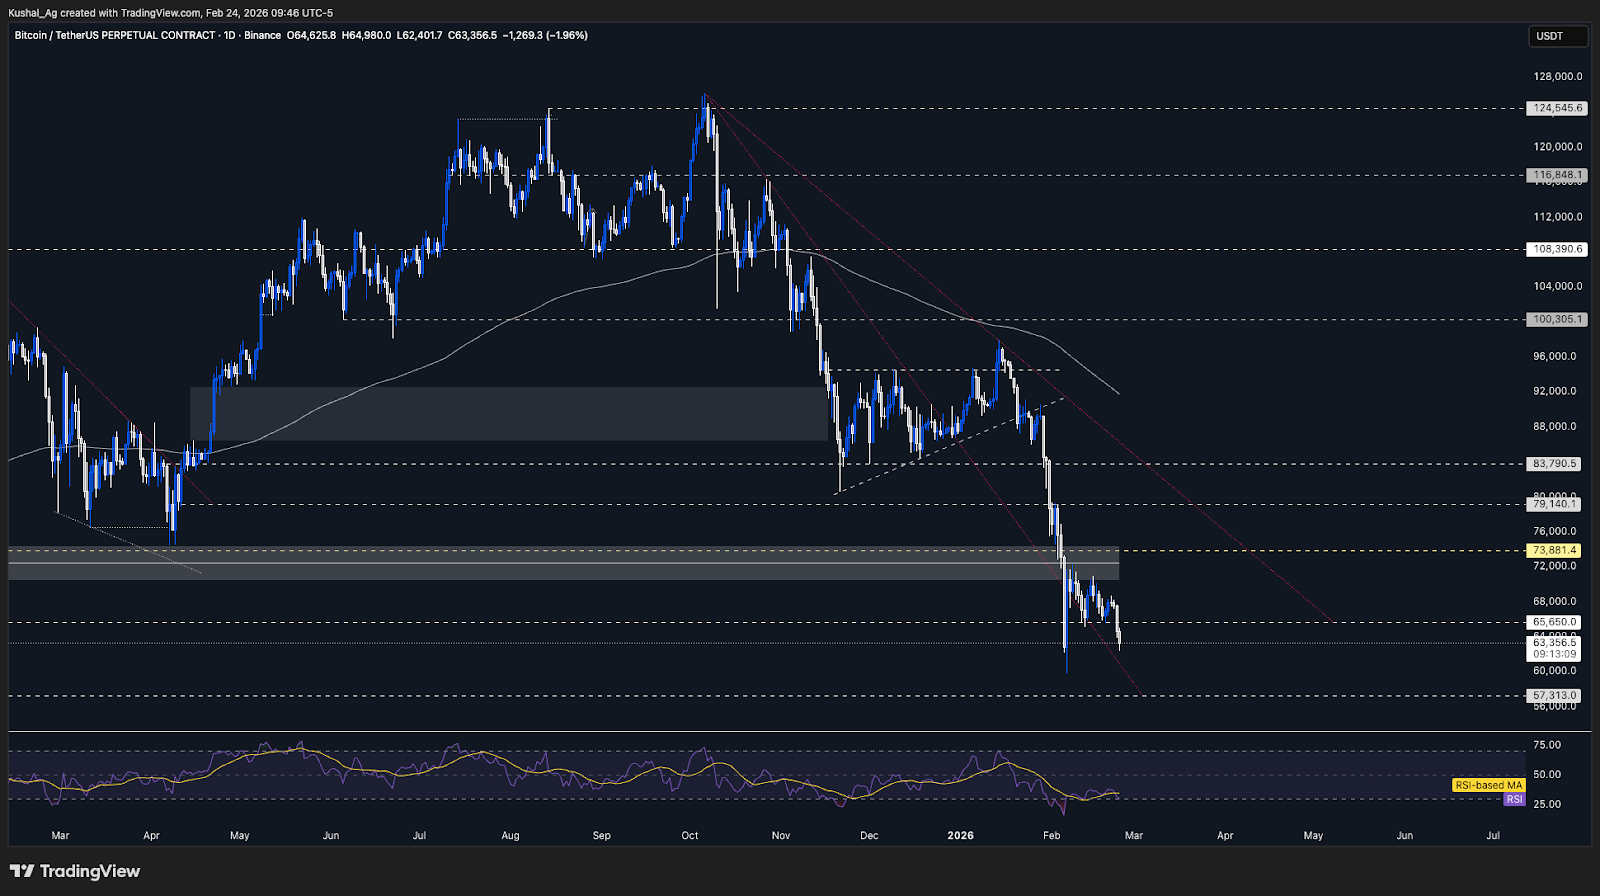
TABitcoin’s neutral-bearish base case has played out as expected. Price broke below $65,650 and rotated cleanly into the $62,000-$62,500 region, tapping the next downside levels. Structure continues to print lower highs within consolidation, reinforcing the broader weakening trend.
The breakdown below $65,650 now flips that level into resistance, while $62,000 acts as immediate support. Price action since the break has been reactive, suggesting sellers remain in control unless we see a strong reclaim of this lost levels.
From a structural standpoint, Bitcoin is about to go for a retest of the broken downtrend line without showing any strength post breakout previously. If $62,000 fails to hold on a daily closing basis, the next levels in play sit at $59,800 followed by $57,300 which could potentially align with the retest of the dotted red downtrend trendline.
A potential bullish divergence scenario remains on the table. If Bitcoin prints a daily close below $62,800 (the 5th February low) and RSI holds above prior swing lows near the 30 region (or high 20s), followed by a strong reclaim, that would open the door to a divergence-based relief rally. Until that confirmation appears, continuation lower remains the base case.
RSI is hovering around 30 with an average near 34, still on the weaker side. The 200 EMA on the daily timeframe continues to slope downward near $90,700, reinforcing broader bearish pressure. On the weekly timeframe, Bitcoin is currently trading below its 200 EMA ($68,700), reflecting higher-timeframe weakness.
Key Levels
- Support: $62,000
- Resistance: $65,650
- Direction: Neutral-Bearish
- Upside Target: $70,500
- Downside Target: $59,800 (followed by $57,300)
Cryptonary’s Take
The structure remains heavy. We are seeing breakdowns hold, and repeated support tests are occurring with progressively weaker reactions. Macro conditions are not providing relief either, rate path uncertainty following hot inflation data, tariff reintroduction under Section 122, and elevated geopolitical risk keep broader risk appetite contained. ETF flows remain muted and liquidity conditions are not meaningfully improving yet.Our base case remains a retest of $59.8K, with the possibility of $57.3K if pressure accelerates.
The counter-case would require a clear bullish divergence confirmation combined with macro relief, such as easing geopolitical tensions, a dovish shift in Fed communication, or a strong risk-on catalyst from equities. Until that combination appears, the path of least resistance still remains lower.
Ethereum
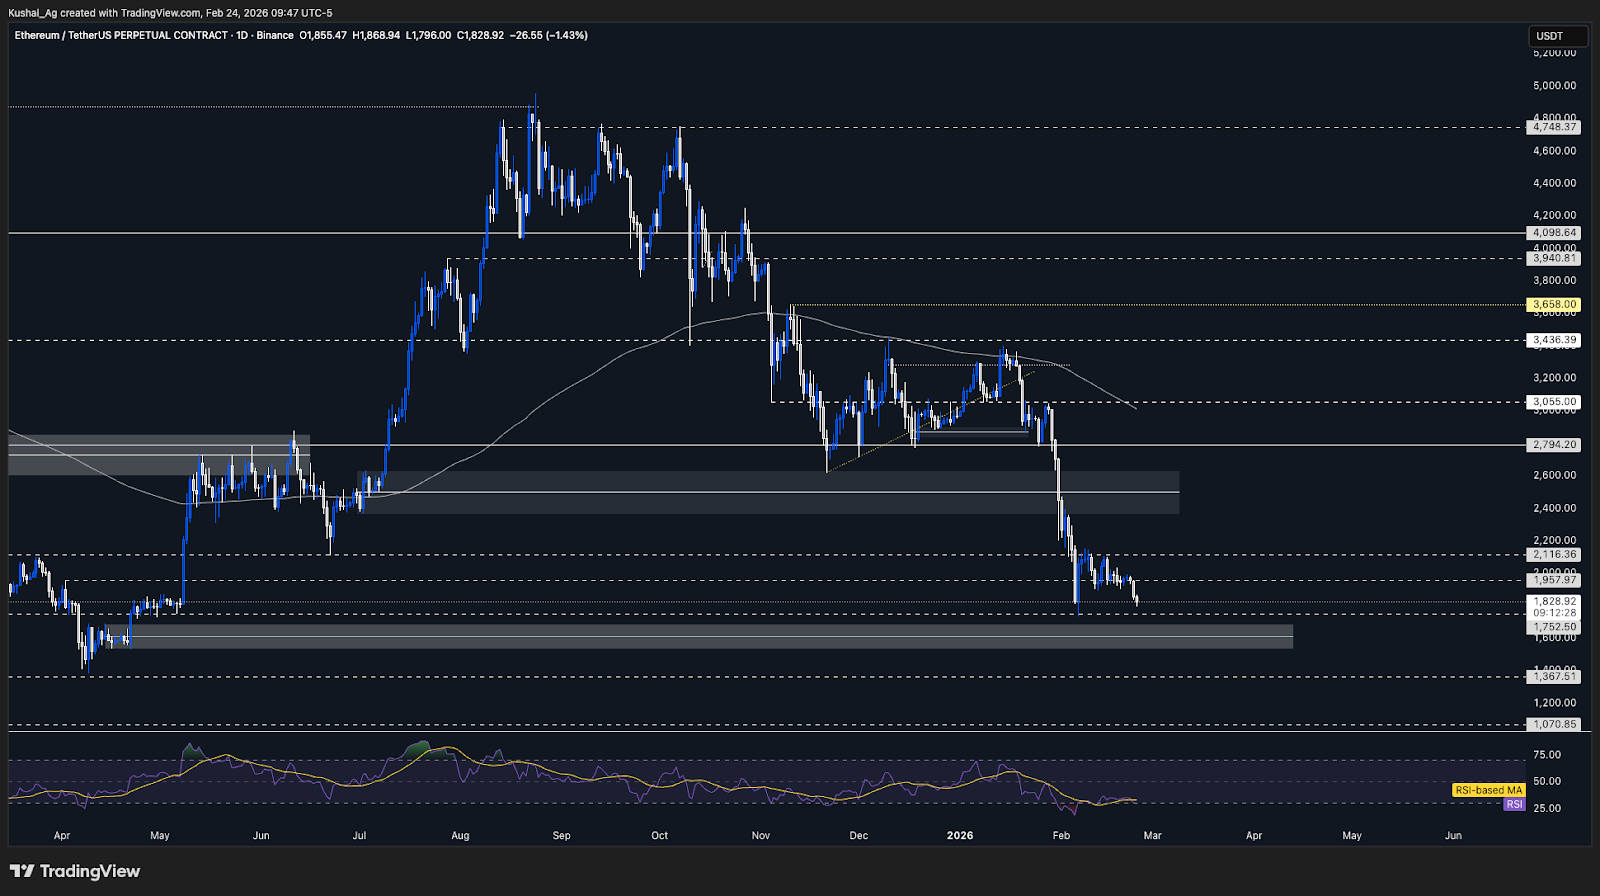
TAEthereum has now broken below the $1,957 support level that it had been compressing around for several sessions. That breakdown confirms the neutral-bearish thesis, with price rotating lower toward the next structural level near $1,752.
The break below $1,957 and the inability to reclaim it quickly signals that former support has now flipped into resistance. Price is currently hovering near the 5th February close around $1,823, which becomes an important short-term pivot for momentum and structure.
A potential bullish divergence scenario is developing but not confirmed. If Ethereum prints a daily close below $1,823 while RSI holds in the upper-20s to low-30s region and we subsequently see strength with reclaim of lost levels, that would open the door for a divergence-based relief rally. Without confirmation and follow-through strength, this remains only a watchlist setup.
Below $1,752, the next meaningful downside objective sits around $1,618, the midpoint of the weekly order block formed in April 2025 before the major impulsive rally. As long as $1,957 remains un-reclaimed, structure favors continuation lower.
RSI is hovering around 30 with an average near 33, reflecting sustained downside pressure. The 200 EMA on the daily timeframe continues to slope downward near $3,016, reinforcing broader bearish conditions.
Key Levels
- Support: $1,752
- Resistance: $1,957
- Direction: Neutral-Bearish
- Upside Target: $2,116
- Downside Target: $1,618
Cryptonary’s Take
Price structure is cleanly under pressure here. The $1,957 breakdown held, and Ethereum is now rotating toward deeper liquidity pockets. Unless we see a confirmed bullish divergence with strong reclaim of lost support, $1,752 and potentially $1,618 remain the higher-probability path.The ETH/BTC ratio is hovering near the 0.029 region, a critical structural area. If this level holds, Ethereum could stage a short-term relative bounce. However, a breakdown below 0.029 would likely open the door toward 0.026, signaling continued relative underperformance.
For ETH to stabilize meaningfully, we need to see the ratio hold and reverse, otherwise, downside pressure remains dominant.
Solana
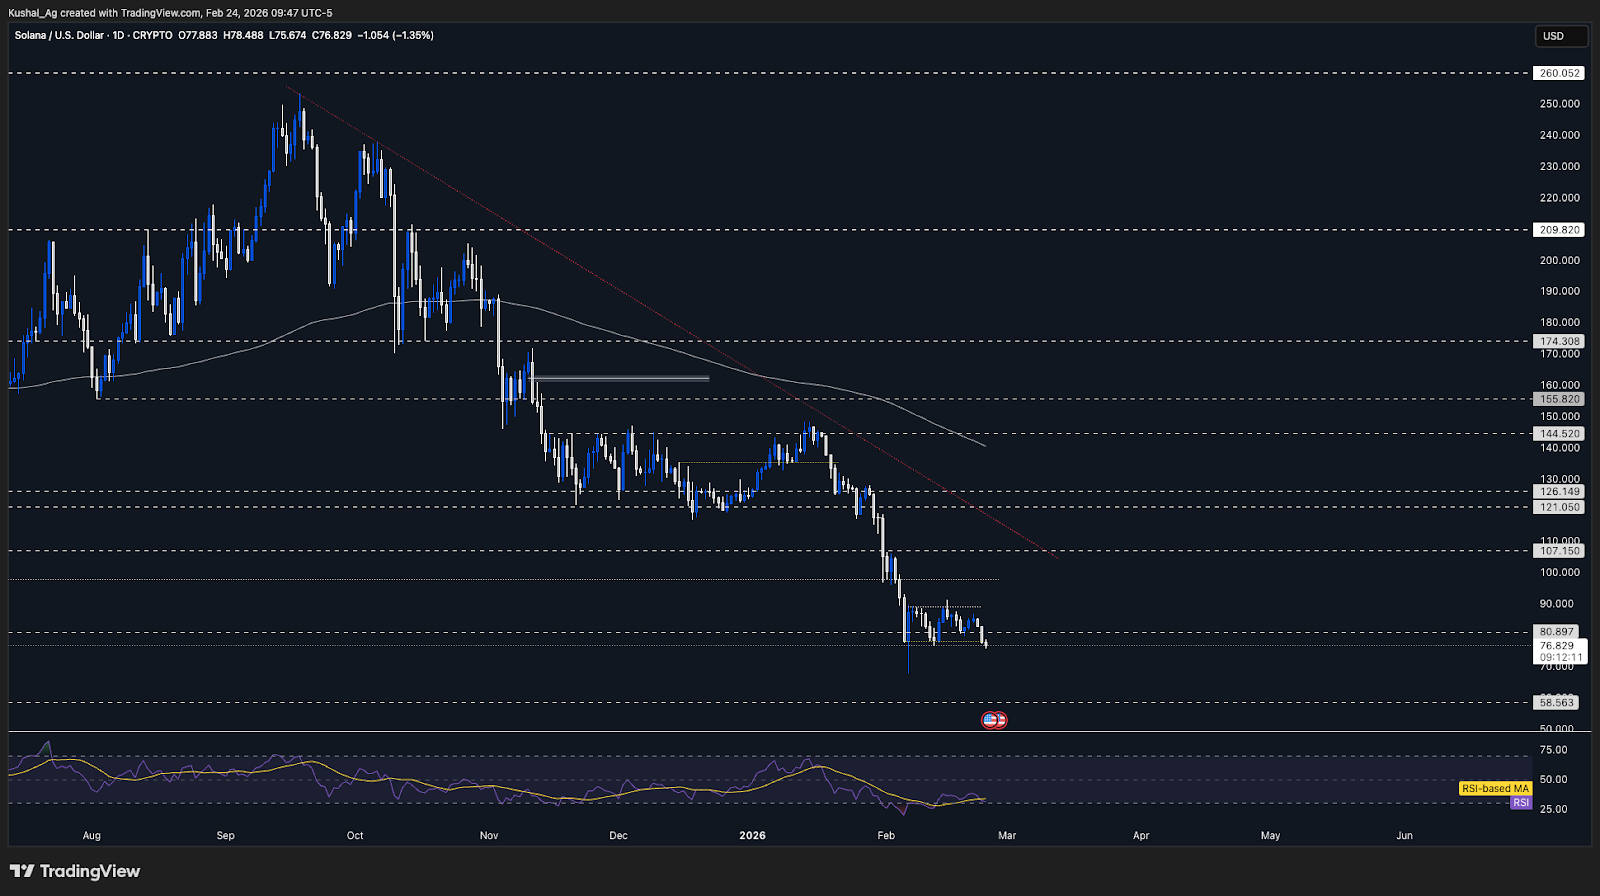
TASolana previously held relatively better than the other majors and rotated cleanly from the $80.89 intermediate support toward the range highs near $89 (swing high around $87), as expected. That relief move stalled just below resistance and rolled over, keeping the broader $78-$89 range intact.
Price has now rotated back to the lower boundary of the range and has slightly deviated below the $78 support. This places Solana at a critical point. A sustained breakdown below $78 would confirm range failure and open the path toward the 6th February wick low near $67.7.
If downside pressure accelerates across majors, $67.7 becomes the immediate downside objective, with $58.56 as the deeper structural level in a broader flush scenario (these prices would be good for long-term accumulation for Solana if/when we get there). Until that breakdown confirms with acceptance below $78, the structure technically remains in a late-stage consolidation.
A potential bullish divergence is developing. RSI is hovering near 31 with an average around 34. If price continues lower or sweeps below $78 while RSI holds in the upper-20s/low-30s region and we then see strength with reclaim of lost levels, that would confirm a divergence-based reversal setup. Without strength and reclaim, continuation lower remains valid.
The 200 EMA on the daily timeframe continues to slope downward near $140.45, reinforcing the broader bearish backdrop despite short-term range behavior.
Key Levels
- Support: $78
- Resistance: $89
- Direction: Neutral
- Upside Target: $97.7
- Downside Target: $67.7 (followed by $58.56 in extended weakness)
Cryptonary’s Take
Solana is now at an active tipping point. The range has held for weeks, but price is now pressing into the lower boundary with a slight deviation below $78. This is where structure resolves, either we see confirmation of a bullish divergence with strength and reclaim, or the range fails and opens $67.7 quickly.Unlike BTC and ETH, Solana still has a technical case for a divergence-led bounce. However, that requires confirmation through both RSI stability and strong reclaim behavior. Until that happens, neutrality remains appropriate, but the next few daily closes will likely determine whether SOL shifts into breakdown mode or reversal mode.
Hyperliquid
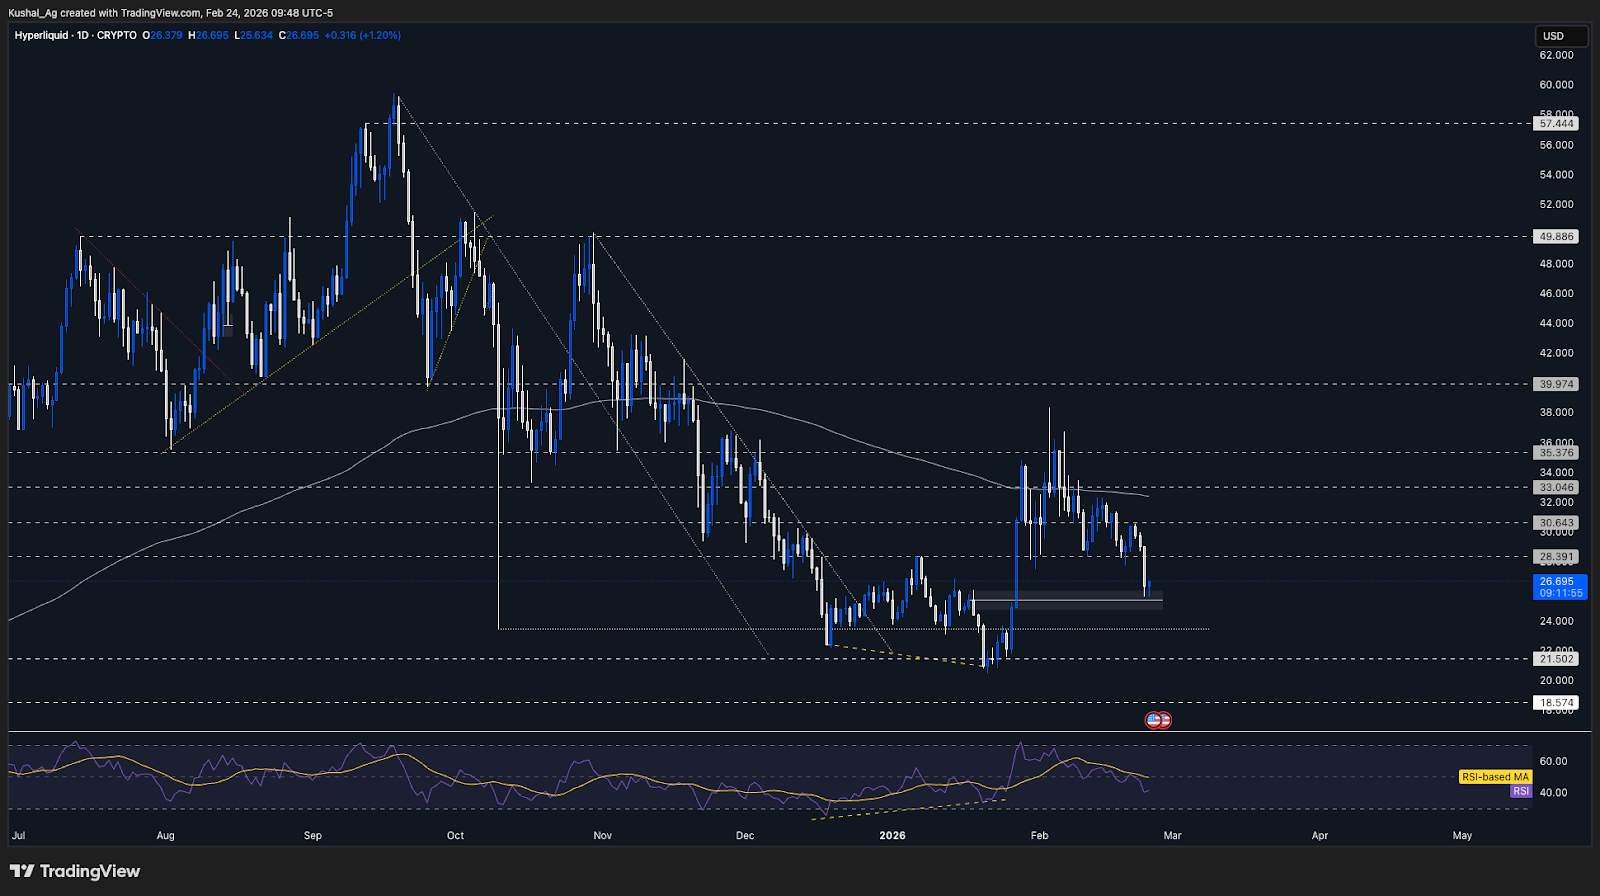
TAHyperliquid has followed the bearish roadmap precisely. After bouncing from $28.39 previously, we expected a lower high below $30.64 followed by another rotation into support, and that is exactly what played out. Price topped at $30.55, rolled over, and broke cleanly below $28.39.
The breakdown was impulsive. A large downside candle pushed price directly into the $25.4 region, printing a low at $25.6, just shy of the mapped support. That confirms the lower-high, breakdown sequence and validates the bearish structure.
For now, $25.4 acts as short-term support. If this level fails to produce a meaningful reclaim and continuation, the next downside objective sits at $23.5. On the upside, $28.39 has now flipped into resistance, with $30.64 remaining the structural ceiling.
RSI has broken below the 50 level and is now hovering around 40 with an average near 49, reflecting clear momentum deterioration. The 200 EMA on the daily timeframe remains flattened near $32.3, signaling stalled upside structure and broader weakness.
Key Levels
- Support: $25.4
- Resistance: $28.39
- Direction: Bearish
- Upside Target: $30.64
- Downside Target: $23.5
Cryptonary’s Take
Hyperliquid has been the cleanest technical setup across the board. The lower high below $30.64 followed by an impulsive break of $28.39 confirms structural weakness. While $25.4 may provide temporary relief, the burden of proof now lies with buyers to reclaim lost structure.Until we see a strong reclaim and sustained acceptance back above resistance, rallies should be treated as corrective. The path remains lower toward $23.5 unless structure shifts.
Invalidation: Now moved lower, sustained hold above $30.64. Until then, bearish bias remains.
Aura
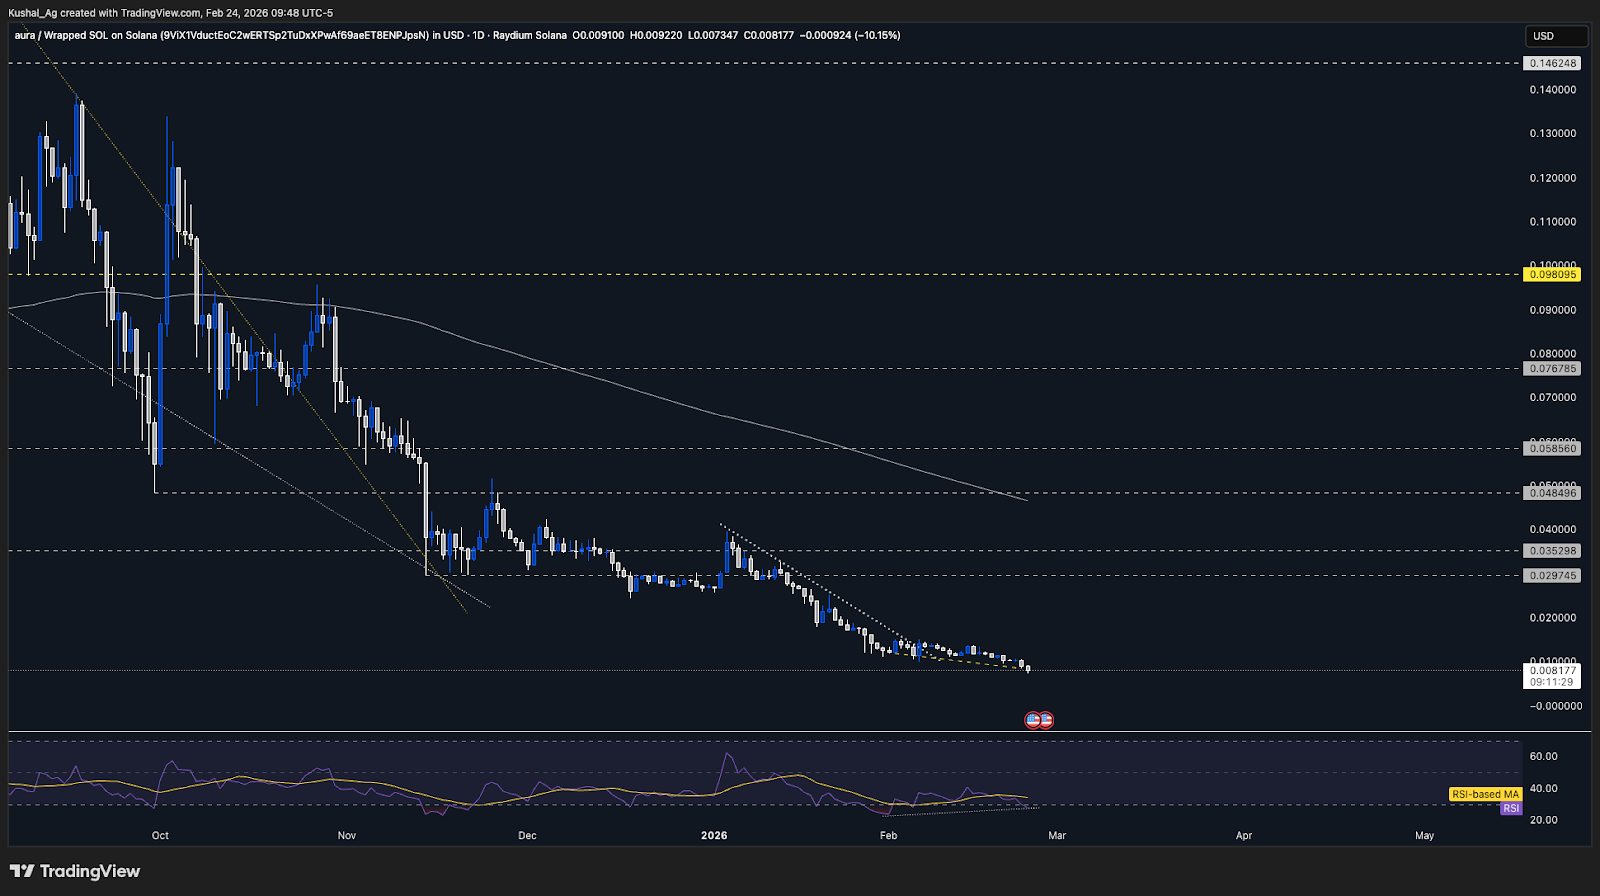
TAAura remains under pressure, with price continuing to grind lower in line with broader high-beta weakness. Structure has not meaningfully shifted yet, and downside pressure is still present.
A secondary potential bullish divergence is developing from the 1st February low to the current low. On 1st February, RSI printed near 24, while the current RSI low is around 28. If price makes equal or slightly lower lows while RSI holds above prior swing lows, this would confirm a bullish divergence setup.
However, confirmation is key. For the divergence to validate, RSI must hold above the mid-20s region and price must show strength with a reclaim of nearby levels. Without strength and follow-through, the setup remains invalid and downside pressure can persist.
The 200 EMA on the daily timeframe continues to slope downward near 0.046, reflecting the broader downtrend. RSI is currently around 28 with an average near 34, sitting in oversold territory but not yet showing confirmed momentum reversal.
Aura Daily Chart:
Cryptonary’s Take
Aura is structurally weak but technically interesting. The developing bullish divergence mirrors what we are monitoring in Solana, and if confirmed alongside strength in SOL, it could create a spillover bid into Aura. Selling at these low levels might not turn out to be the best decision in the medium-long term. That said, Aura remains dependent on broader high-beta sentiment and Solana’s resolution. Confirmation brings opportunity.Closing Thoughts
Our stance has largely played out as expected, and we continue to maintain the same framework we’ve carried over the past few sessions and weeks. Key downside levels in Bitcoin and Ethereum were tapped, and subsequent breakdowns from support unfolded in line with prior projections. The structure remains heavy, and as of now, the base case continues to lean toward further downside continuation given persistent pressure in both price action and the broader backdrop.We are also approaching a technically important territory. Potential bullish divergence setups are beginning to form across several majors. Solana has already printed a new low relative to its 5th February level, putting it first in line structurally. Bitcoin and Ethereum may follow.
However, a divergence only becomes actionable if it is confirmed, meaning we need to see strength and reclaim behavior after new lows are printed. Without that strength component, a divergence signal holds little weight and downside continuation remains valid.
The thesis is largely unchanged, but we are now at a point where confirmation, in either direction, matters. Until proven otherwise, pressure remains dominant, but the next few sessions will determine whether we transition from continuation into reversal conditions upon confirmation of these divergences or not.
Continue reading by joining Cryptonary Pro
$1,548 $1,197/year
Get everything you need to actively manage your portfolio and stay ahead. Ideal for investors seeking regular guidance and access to tools that help make informed decisions.
For your security, all orders are processed on a secured server.
As a Cryptonary Pro subscriber, you also get:
3X Value Guarantee - If cumulative documented upside does not reach 300% during your 12-month membership, you can request a full refund. Terms
24/7 access to experts with 50+ years’ experience
All of our top token picks for 2025
On hand technical analysis on any token of your choice
Weekly livestreams & ask us anything with the team
Daily insights on Macro, Mechanics, and On-chain
Curated list of top upcoming airdrops (free money)
3X Value Guarantee
If cumulative documented upside does not reach 300% during your 12-month membership, you can request a full refund.
Our track record speaks for itself
With over 2.4M tokens and widespread misinformation in crypto, we cut through the noise and consistently find winning assets.
Our track record speaks for itself
With over 2.4M tokens and widespread misinformation in crypto, we cut
through the noise and consistently find winning assets.


Frequently Asked Questions
Can I trust Cryptonary's calls?
Yes. We've consistently identified winners across multiple cycles. Bitcoin under $1,000, Ethereum under $70, Solana under $10, WIF from $0.003 to $5, PopCat from $0.004 to $2, SPX blasting past $1.70, and our latest pick has already 200X'd since June 2025. Everything is timestamped and public record.
Do I need to be an experienced trader or investor to benefit?
No. When we founded Cryptonary in 2017 the market was new to everyone. We intentionally created content that was easy to understand and actionable. That foundational principle is the crux of Cryptonary. Taking complex ideas and opportunities and presenting them in a way a 10 year old could understand.
What makes Cryptonary different from free crypto content on YouTube or Twitter?
Signal vs noise. We filter out 99.9% of garbage projects, provide data backed analysis, and have a proven track record of finding winners. Not to mention since Cryptonary's inception in 2017 we have never taken investment, sponsorship or partnership. Compare this to pretty much everyone else, no track record, and a long list of partnerships that cloud judgements.
Why is there no trial or refund policy?
We share highly sensitive, time-critical research. Once it's out, it can't be "returned." That's why membership is annual only. Crypto success takes time and commitment. If someone is not willing to invest 12 months into their future, there is no place for them at Cryptonary.
Do I get direct access to the Cryptonary team?
Yes. You will have 24/7 to the team that bought you BTC at $1,000, ETH at $70, and SOL at $10. Through our community chats, live Q&As, and member only channels, you can ask questions and interact directly with the team. Our team has over 50 years of combined experience which you can tap into every single day.
How often is content updated?
Daily. We provide real-time updates, weekly reports, emergency alerts, and live Q&As when the markets move fast. In crypto, the market moves fast, in Cryptonary, we move faster.
How does the 3X Value Guarantee work?
We stand behind the value of our research. If the documented upside from our published research during your 12-month membership does not exceed three times (3X) the annual subscription cost, you can request a full refund. Historical context: In every completed market cycle since 2017, cumulative documented upside has exceeded 10X this threshold.
TermsRecommended from Cryptonary