Save 23% ($351) & Get a Free 1-1 Call with our Team ⏰ : 0d 2h 59m 44s
Disclaimer: This analysis is for informational purposes only and not financial advice.
TLDR:
- BTC: Bearish rejection at $108k resistance. Key support $93k–$89k. Watching for bounce or deeper correction.
- ETH: Bearish below $3,800. Support at $2,800. Needs reclaim of $3,800–$4,000 for bullish shift.
- SOL: Retesting $120–$125 support. Bearish below $150. Bullish only above $190.
- HYPE: At critical $37. Support at $28. Strong buy below $28, resistance $44.
- AURA: Neutral. Watch $0.065 reclaim or buy $0.029 if available. Bearish below $0.05.
BTC:
- Price Range: $92,000 – $108,000
- Bias: Neutral to Bearish
- HEDGE positions if BTC retests $108–$110k. BUY below 93k if we get there.
- Resistance: $108,000 – $110,000
- Current Support area: $89,000 – $91,000
- Breakdown Trigger: $87,000
- Closest Support in case of Breakdown: $76,000
Technical analysis
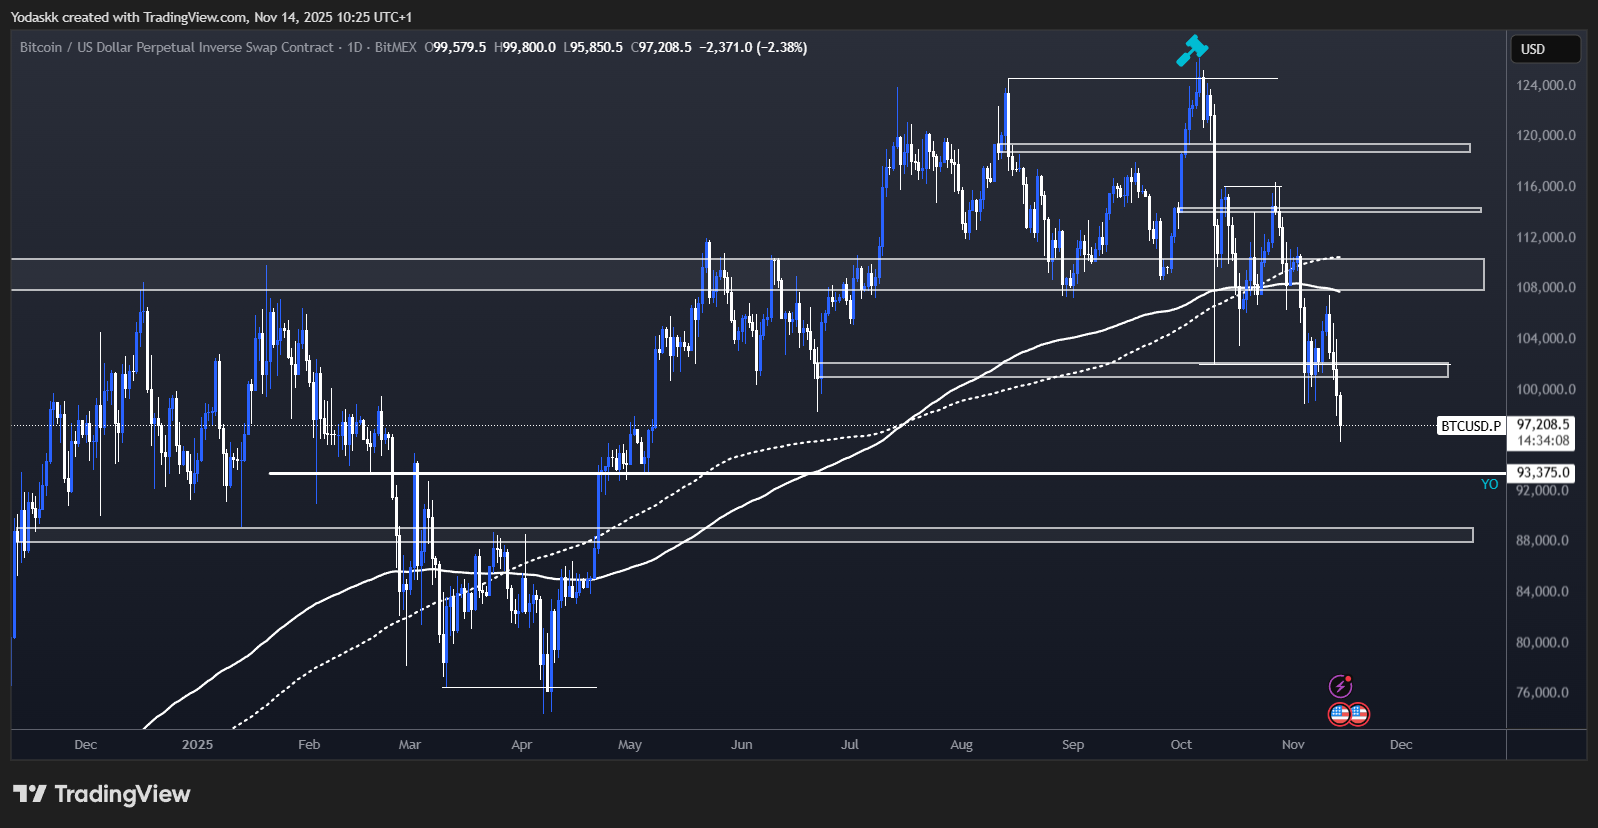
As expected in the previous Market Direction, taking the liquidity above $116k and quickly reversing was locally a bearish behavior.Following our analysis in previous Market Directions, we got the reaction we expected at $100k-$102k: a reaction from this order block and a Swing Failure Pattern (a Swing Failure Pattern occurs when price briefly breaks a previous high or low to trigger stop orders but then reverses sharply in the opposite direction).
The SFP worked out as we got the reaction with BTC going directly into our resistance at $108k.
The reaction around our resistance at $108k-$110k was key, as we got a quick rejection and the continuation of downtrend. This resistance zone remains a key area to be breached for any talks of future bullish continuation.
BTC closed below our support at $100k-$102k: things start to look riskier, depending on the weekly close. It could damage our bullish thesis since it would break the market structure on higher timeframes.
The next support area is $93k, where is the Yearly Open (Key Level).
A deviation below $93k into $88,888 would also probably be a good buying opportunity if presented.
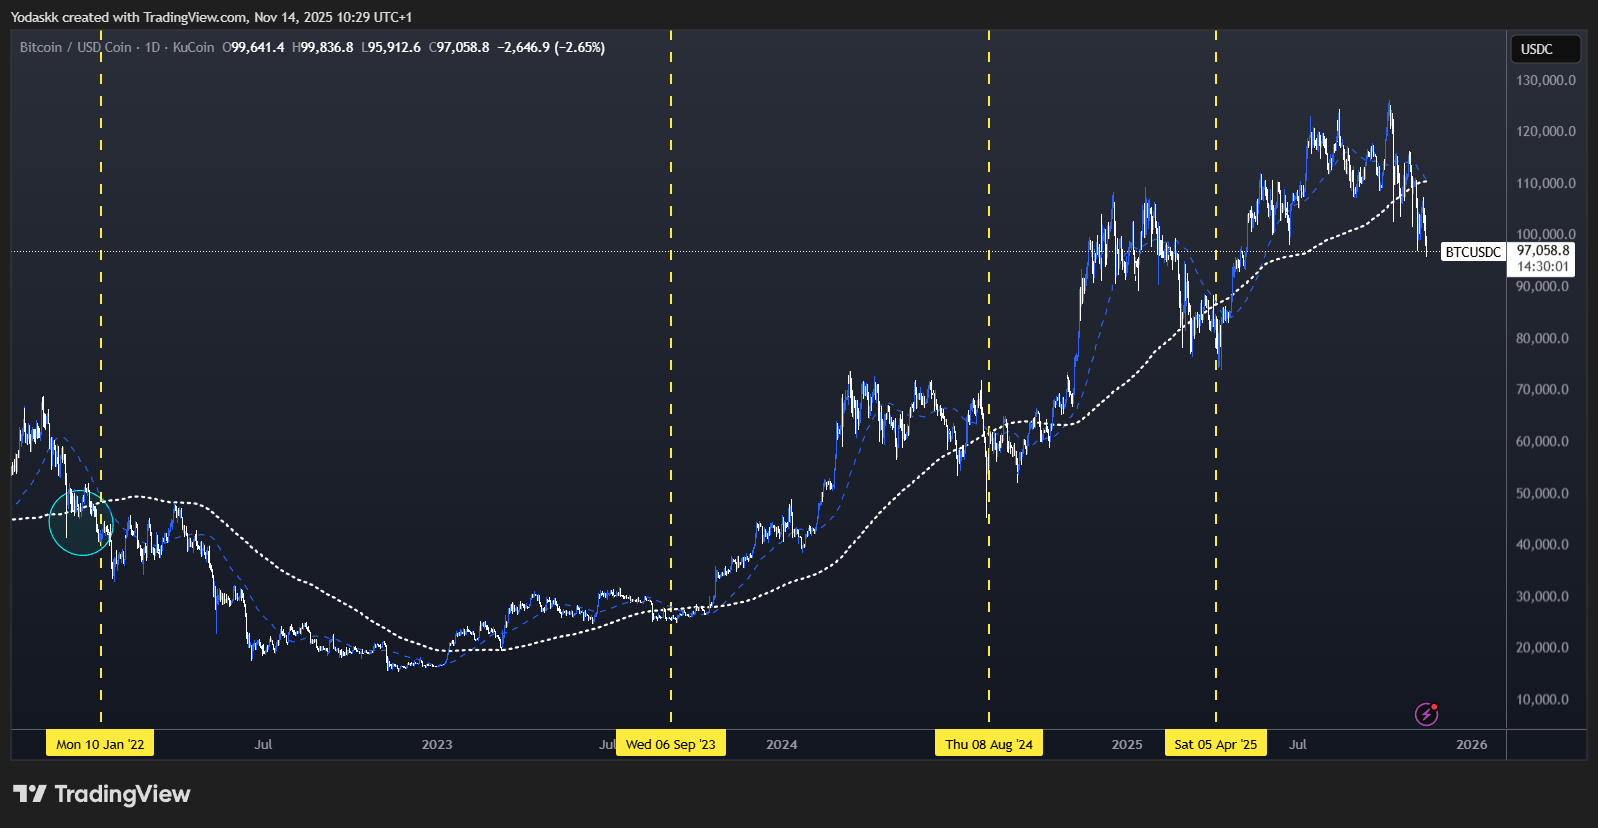
We have an interesting setup coming soon. Each time we got a daily Deathcross (when the 50-day SMA crosses below the 200-day SMA), it was always close to the local bottom (or reversal).
We should get this Deathcross in the next few days.
The last 3 times we got it during this bull market, it was the start of the next bull phase.
Even when we got it at the beginning of the 2022 bear market, we still got a bounce around the Deathcross, where the 200-Day SMA capped the upside.
This is why from now on, the 200-Day SMA will be crucial in assessing if the next bounce is a bear market rally, or the start of a new impulse going into new highs.
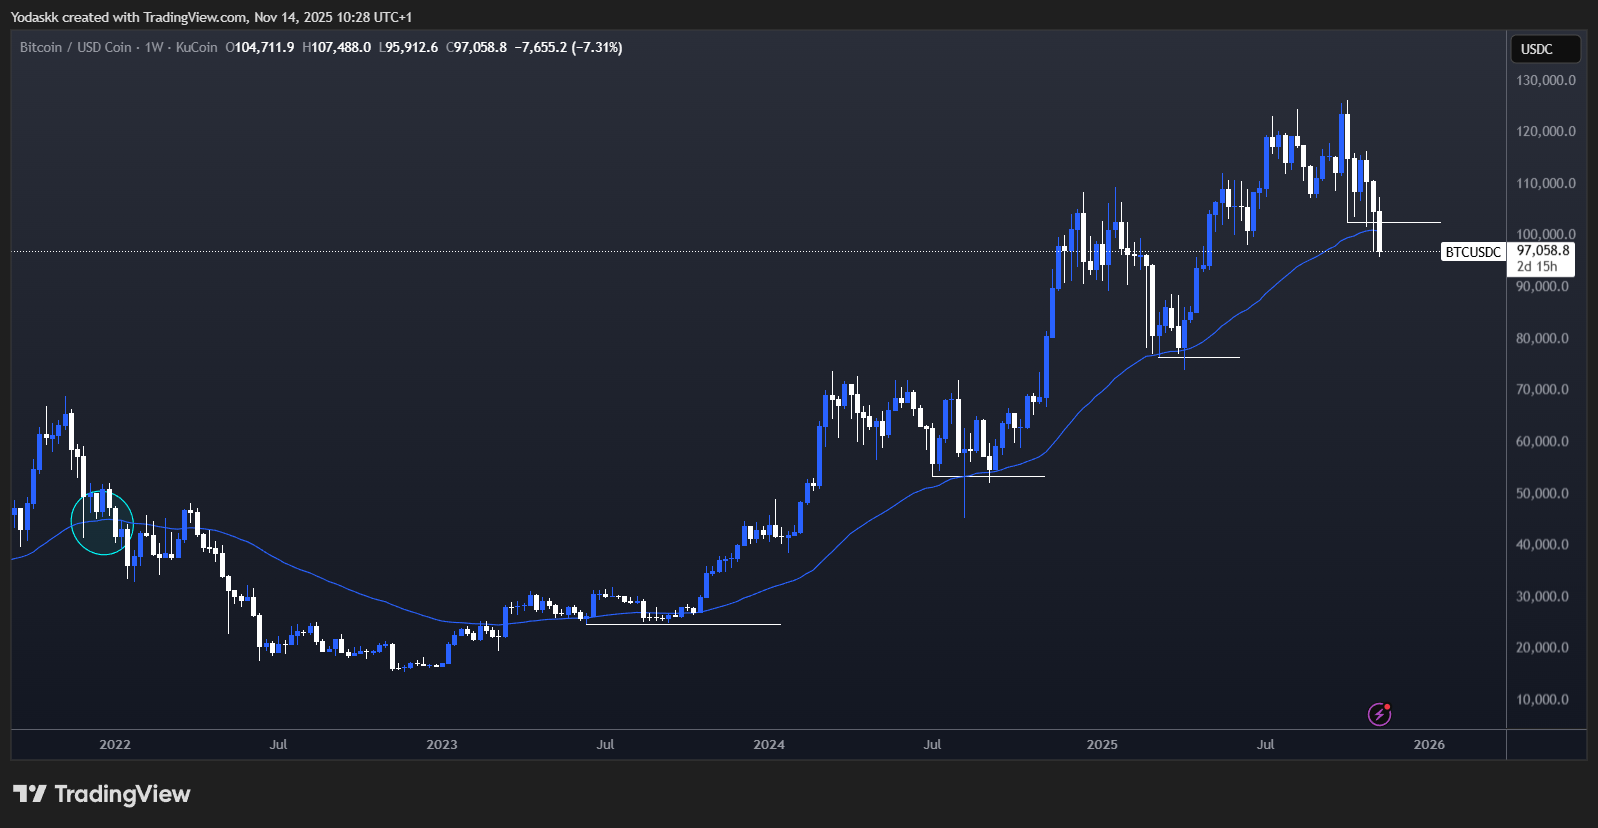
On the weekly chart, the 3 previous big corrections BTC had since its 2022 lows always followed this playbook:
- Form a low
- SFP (Swing Failure Pattern) of the previous low while retest the Weekly 50 EMA
- Continuation of the uptrend
Depending on this weekly close, but for now, the setup is different from previous important lows since 2022, as BTC is currently below the weekly 50 EMA at $100,800.
This would be an important change in BTC behavior, and could signal the possibility of the beginning of a bear phase similar to early 2022.
Several important things to note: we got strong OG Whale Dumping when BTC is above $100k, which happened the entire year, and is a bearish force on BTC.
To compensate for those bearish flows, we were having bullish flows from DATs, ETF, and Stablecoins, which made BTC overall flat on the year.
But lately those DAT+ETF+stablecoins flows were pretty muted.
This helps explain WHY we finally broke down to $100k after months of consolidation: the OG whale selling finally overwhelmed the institutional buying that had been supporting price.
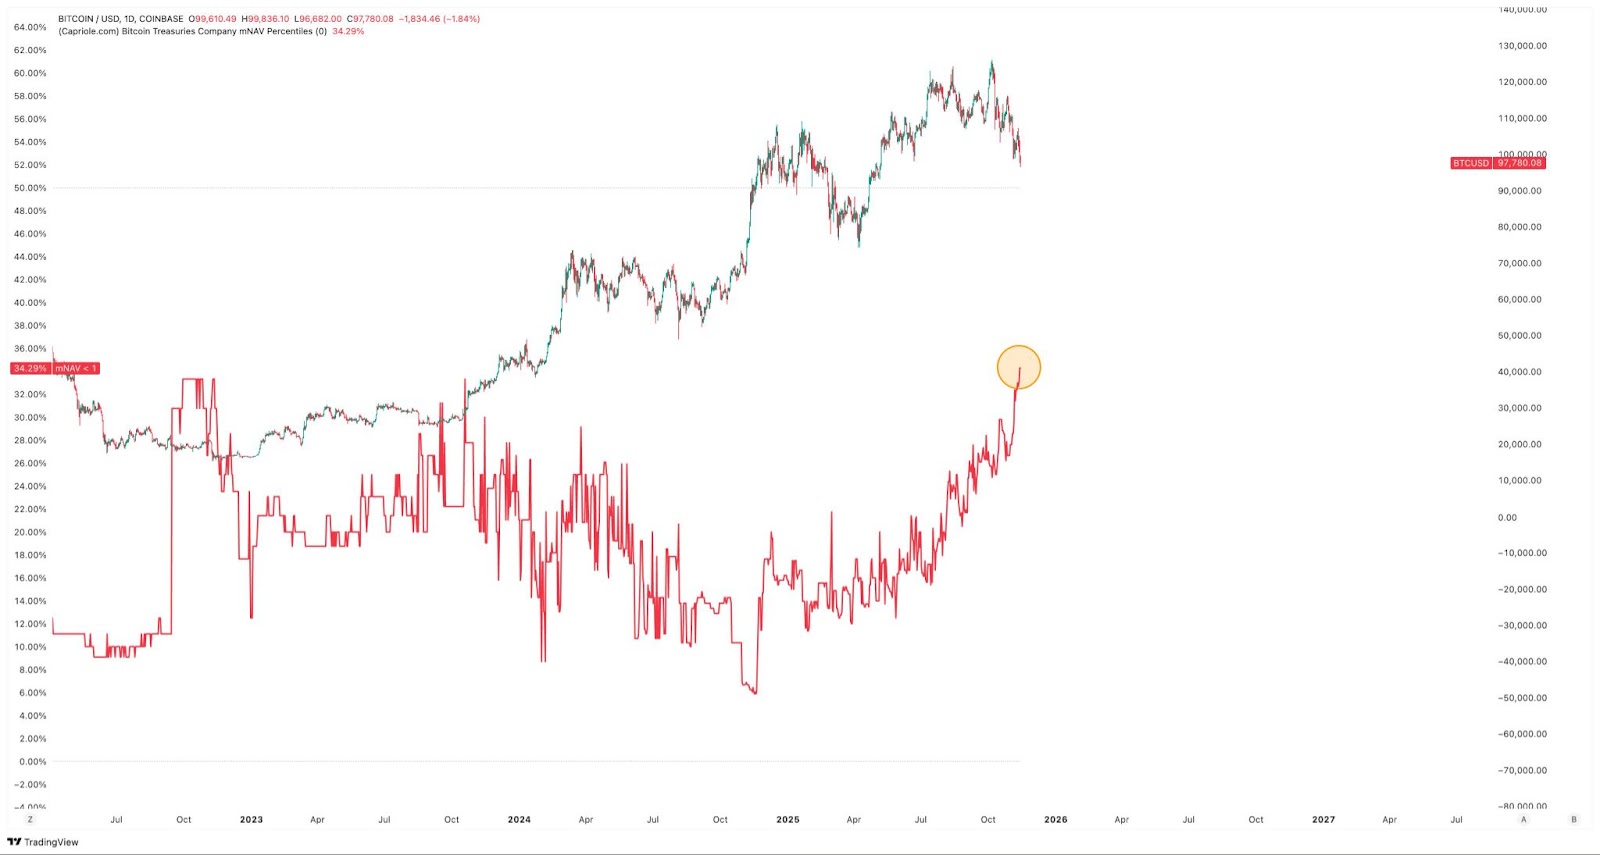
Now, we just got a new ATH in DATs with mNAV < 1 (it means the value of the assets they hold has dipped slightly below the value of the shares they’ve issued).
If the market doesn't bounce soon, these DATs could power the next leg down.
The key question: Will institutional flows resume at these lower levels? That's what we're monitoring daily (see our Market Update for detailed flow analysis).
Thanks to this Wintemute chart, we can see that for the 2nd half of 2025, the correlation between BTC and the Nasdaq-100 remains high (~0.8).
BTC’s performance skew has been structurally negative in 2025: BTC falls harder on equity down days than it rises on up days, which is a pattern last seen in the 2022 bear market.
BTC has remained weaker than US equities for the past 6 months.
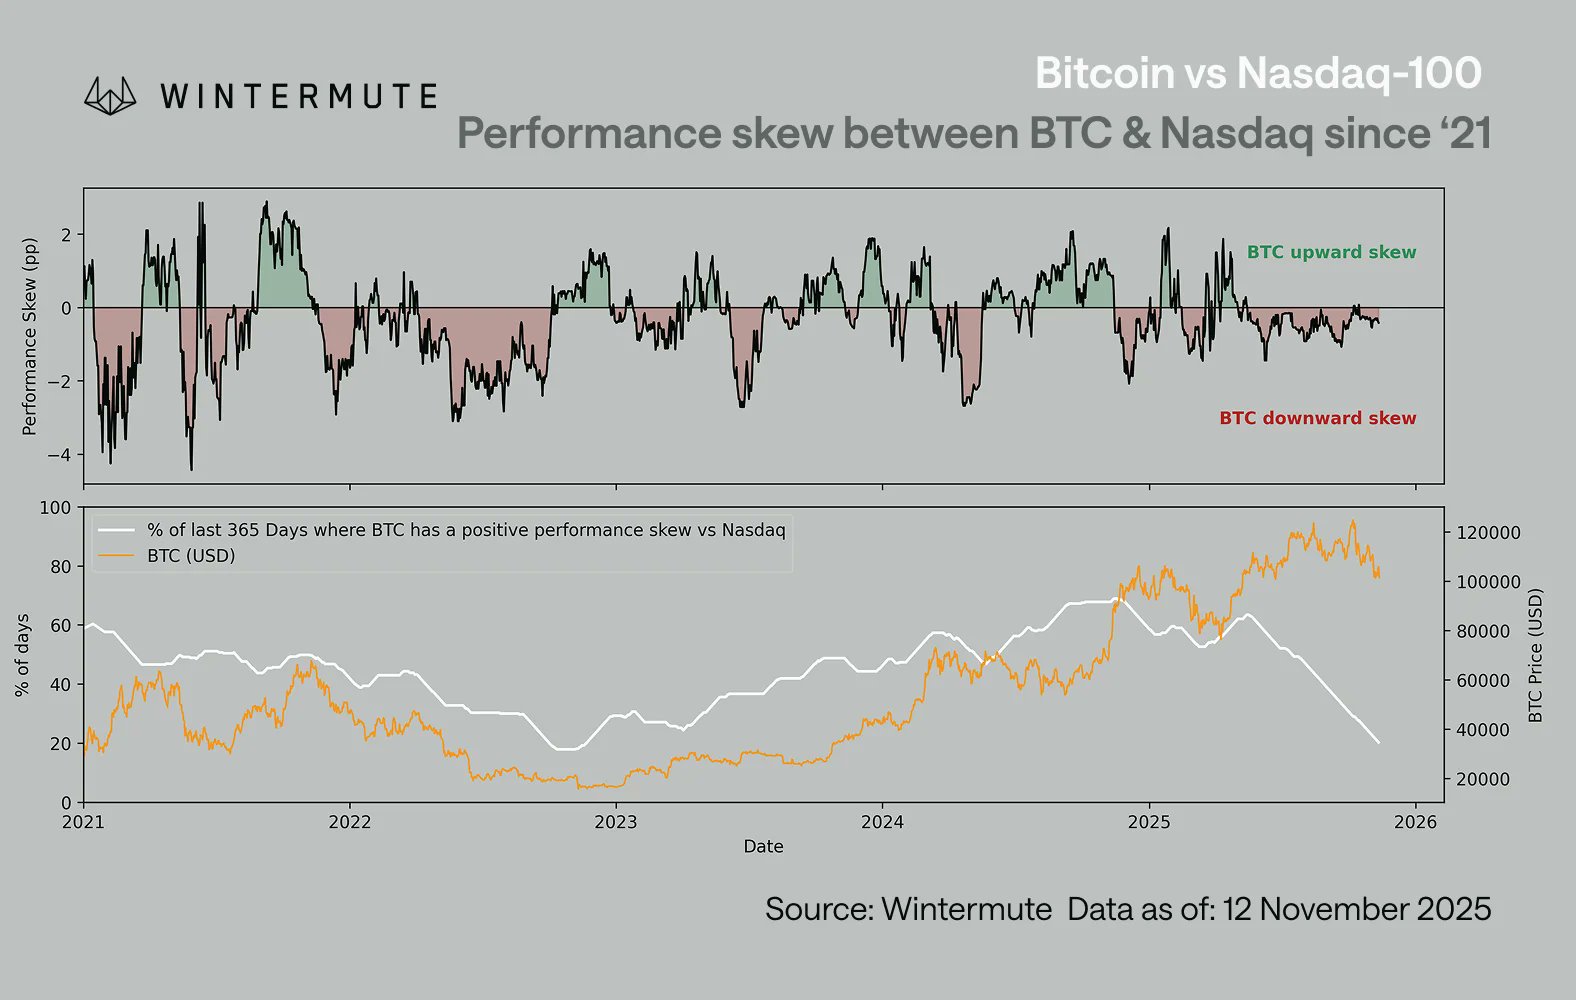
BTC vs Nasdaq Performance
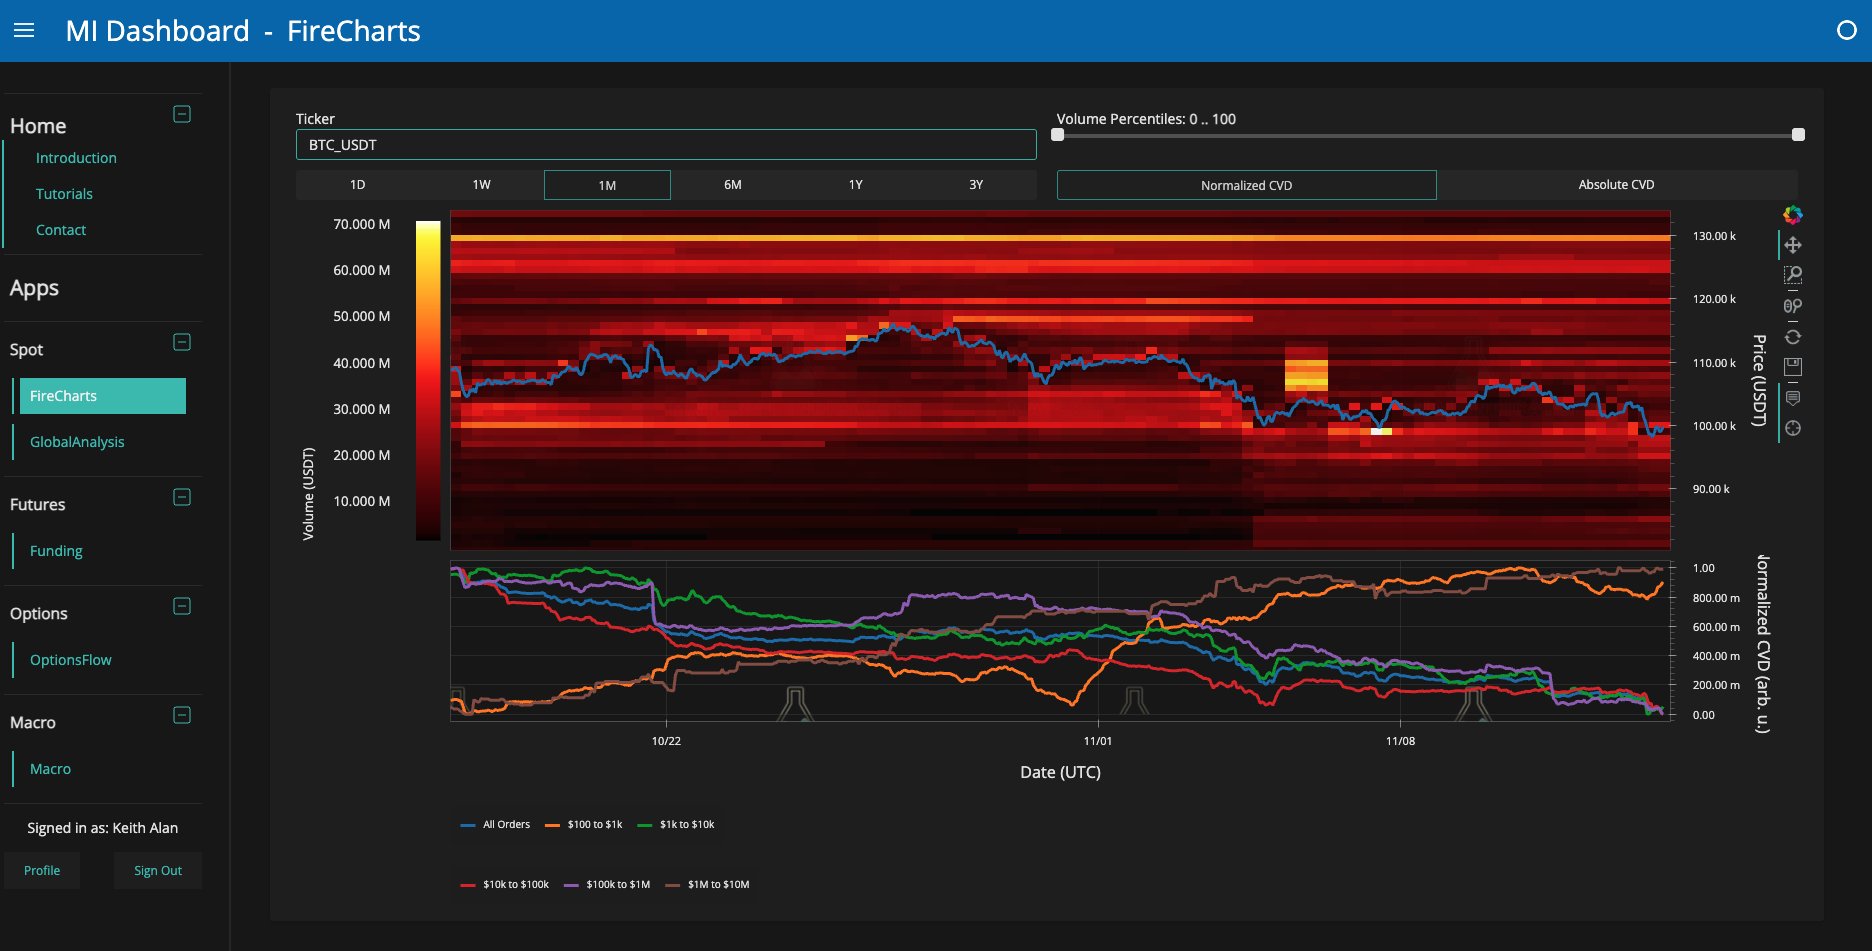
Liquidity Analysis: Pressure is increasingLooking at the BTC order book heatmap reveals interesting dynamics:
-
- Fake Seller Pressure: A large wall of sell orders appeared between $104k-$100k that "walked" price down, then mysteriously disappeared. This wasn't organic selling: someone wanted to push BTC lower WITHOUT getting filled (classic whale accumulation tactic).
- Real Buyer Interest: Meanwhile, a substantial new wall of bids has appeared down to $95k, showing genuine demand at these levels.
- Plunge Protection: A massive $57 million bid appeared just below $100k on the retest to end the local correction.
- SFP and move in the opposite direction: Plunge protection worked and price quickly reversed to $107.5k resistance.
- Legit Seller Pressure: Since the rejection at $107.5k resistance, we can see an increase in sell order from $110k and below. Those sell orders seems legit, which put pressure on BTC
What is a BTC heatmap? It shows where large buy and sell orders (liquidity walls) sit across price levels. Bright colors (like red, yellow, orange) represent high concentrations of limit orders, meaning areas where many traders are looking to buy or sell. These zones often act as support (buy walls) or resistance (sell walls) and can influence short-term price action.
Cryptonary's take
BTC hit our $100k-$102k target. SFP bounce fulfilled, but rejection at $108k resistance confirms bear bias. If weekly closes below the 50 EMA, treat any bounce as bear market rally. Watch $89–$93k for bounce. Re-entry on sustained reclaim over $110k with confirmation.- Next Support: $89,000–$93,000
- Next Resistance: $108,000–$110,000
- Direction: Neutral to Bearish
- Upside Target: $110,000
- Downside Target: $76,000
We’d reconsider our view if we see:
*Technical Signals:*
- BTC breaks and closes above 110k on daily chart (3+ closes)
- Volume confirms breakout
- Weekly close above weekly 21+50 EMA
- Daily close above 200-Day SMA (3+ closes)
- ETF inflows continue to turn positive for 3+ consecutive days
- DATs with mNAV < 1 reversal for 3+ consecutive days
- DXY continuation below $96
- Fed speakers adopt decisively bullish tone
For detailed flow analysis and what catalysts would bring institutional buyers back, see our Market Update (published today).
ETH:
- Price Range: $2,800 – $3,900
- Bias: Neutral to Bearish
- Wait for $2,800 dip to buy. Hedge if retest of $3,800- $4,000 zone.
- Resistance: $3,800- $4,000
- Support Zone: $2,800
- Breakdown Trigger: $3,200
Technical analysis
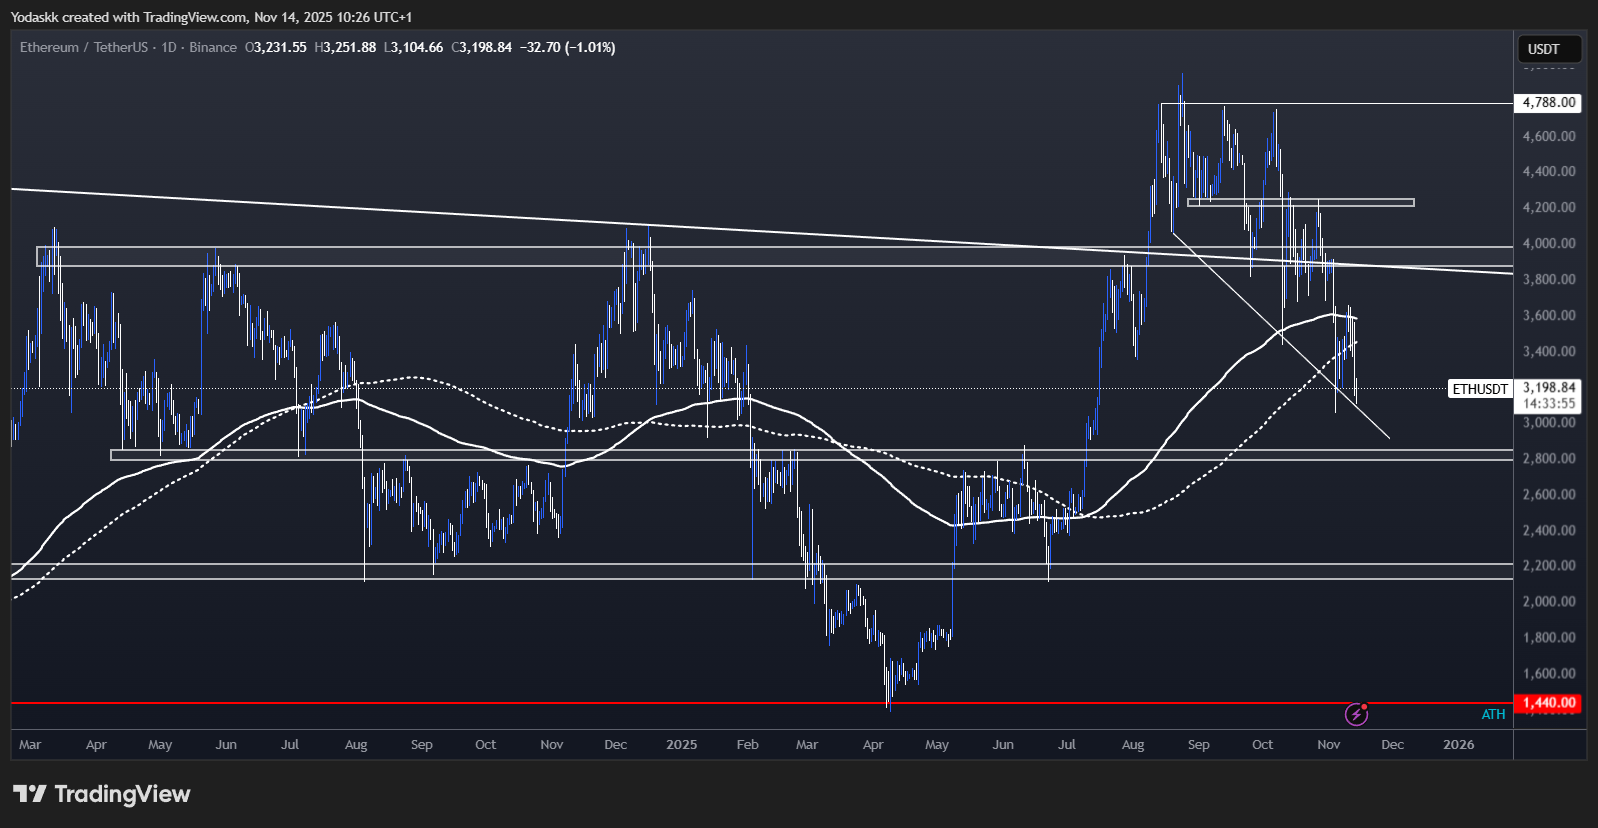
ETH broke back below the $3,800-$3,900 Key Level on the weekly, which makes ETH more bearish than BTC on the high timeframes again: ETH is now back in the $2,800-$3,900 range.To be bullish again, ETH needs to close above the range and get above the resistance at $3,800-$4,000.
Breaking the $4,250 resistance zone would make ETH very bullish again, opening the path to All Time Highs.
Locally, a close below $3,200 would give more credit to the bearish thesis and we would target $2,800 as the next support.
The $2,800 area is a Key Level and a bounce around this level could lead to an underside retest of the 200-Day SMA.
Cryptonary's take
Until ETH reclaims $3,800–$4,000 on a weekly close, bear bias remains. Downside target is $2,800 if $3,200 breaks. Wait for confirmation before new long entries.- Next Support: $2,800
- Next Resistance: $3,800–$4,000
- Direction: Neutral to Bearish
- Upside Target: $4,000
- Downside Target: $2,800
SOL:
- Price Range: $120 – $190
- Bias: Neutral to Bearish
- Add if dips to $120, Hedge if retest of $180 – $190 resistance.
- Resistance: $180 – $190
- Support Zone: $120 – $125
- Breakdown Trigger: Break below $150
Technical analysis
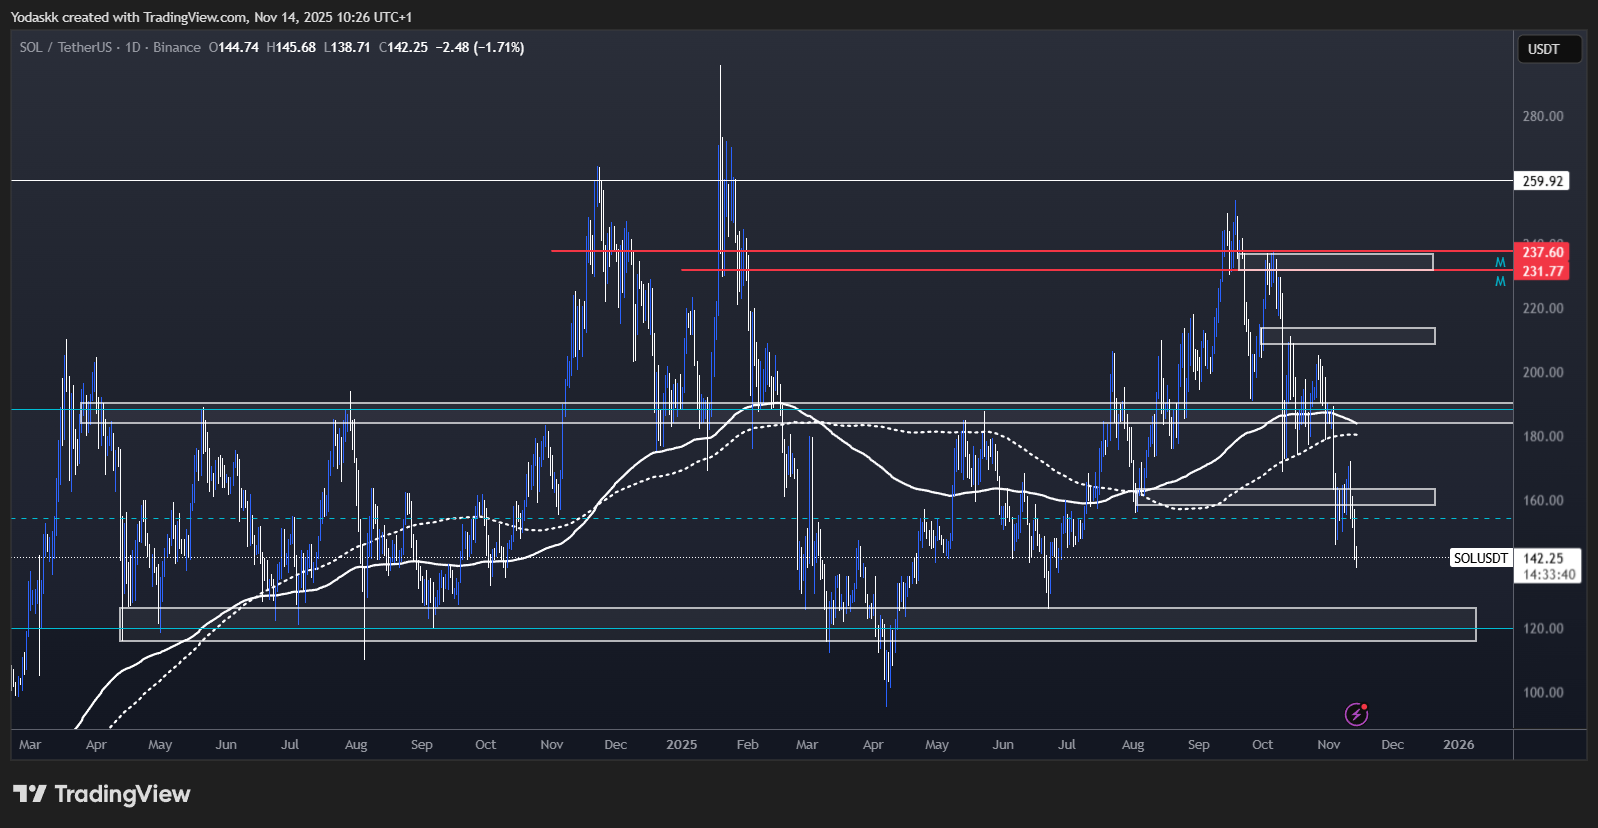
SOL continued its downtrend that started mid-September, as we continue to get lower highs and lower lows on the daily.SOL broke down back into the $120-$190 range and is currently sitting at $140 after breaking below the mid-range at $153.
To be bullish again, SOL needs to reclaim above the top of the range at $190.
A close below $150 is giving more credit to the bearish thesis and we would target $120–$135 as the next support, which is the bottom of the range and also the 200-Week EMA.
The $120 area is a Key Level and a bounce around this level could lead to an underside retest of the 200-Day SMA.
Cryptonary's take
Bear trend dominates as SOL loses $150. Only consider new longs after reclaiming $190. Accumulate cautiously if $120–$125 holds as support.- Next Support: $120–$125
- Next Resistance: $180–$190
- Direction: Neutral to Bearish
- Upside Target: $190
- Downside Target: $120
HYPE:
- Price Range: $28 – $44
- Bias: Neutral to Bearish
- Add if breaks $44. Strong Buy below $28.
- Resistance: $43–$44
- Support Zone: $28
- Breakdown Trigger: Break below $37
Technical analysis
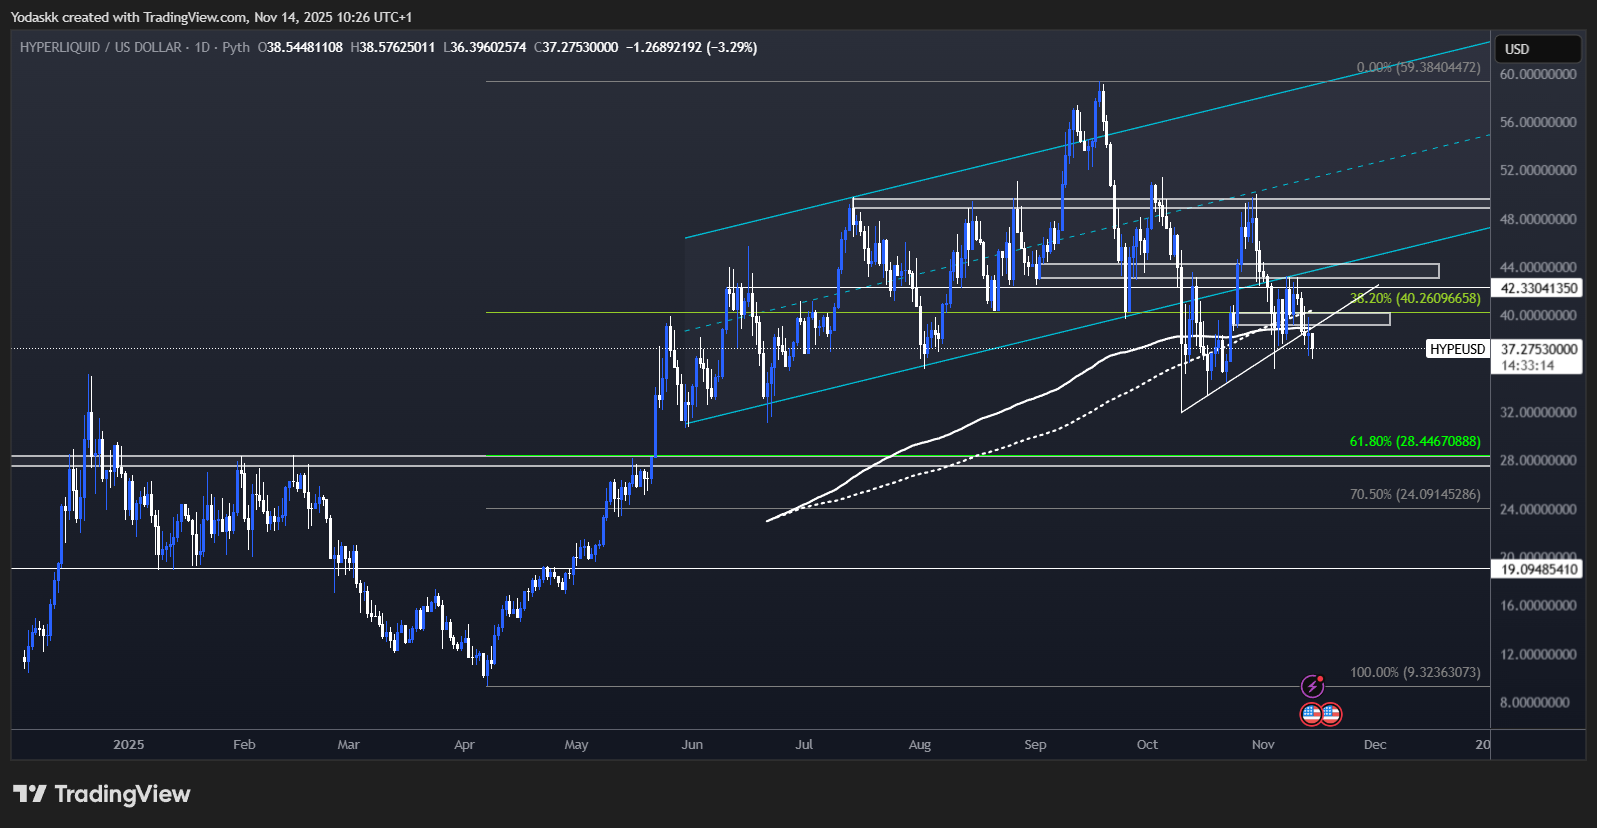
HYPE is around $37 and broke below $39-$40 (both daily Orderblock and 200-Day SMA+EMA) after rejecting at $43-$44.A break of resistance around $43-$44 and we would target mid-channel around $49–$50 again.
A close below $37 would give more credit to the bearish thesis as it could retest the lows, and the next big support would be around $28.
That would be an incredible buy point, as $28 is both an important horizontal support and the 61.8% fibonacci retracement of the entire $9–$59 move (the 61.8% Fibonacci retracement is a key technical level marking a strong potential reversal point where price tends to bounce or reject within a trend).
Cryptonary's take
HYPE’s technical structure remains heavy; buyers should wait for major support at $28 or a genuine break above $44 before scaling in size. Bearish under $37.- Next Support: $28
- Next Resistance: $44
- Direction: Neutral to Bearish
- Upside Target: $50
- Downside Target: $28
AURA:
- Price Range: $0.0029 – $0.065
- Bias: Neutral
- Wait for $0.065 reclaim or buy $0.029 if given.
- Resistance and Key Level to Reclaim: $0.065
- Support Zone: $0.029
- Breakdown Trigger: Break below $0.05
Technical analysis
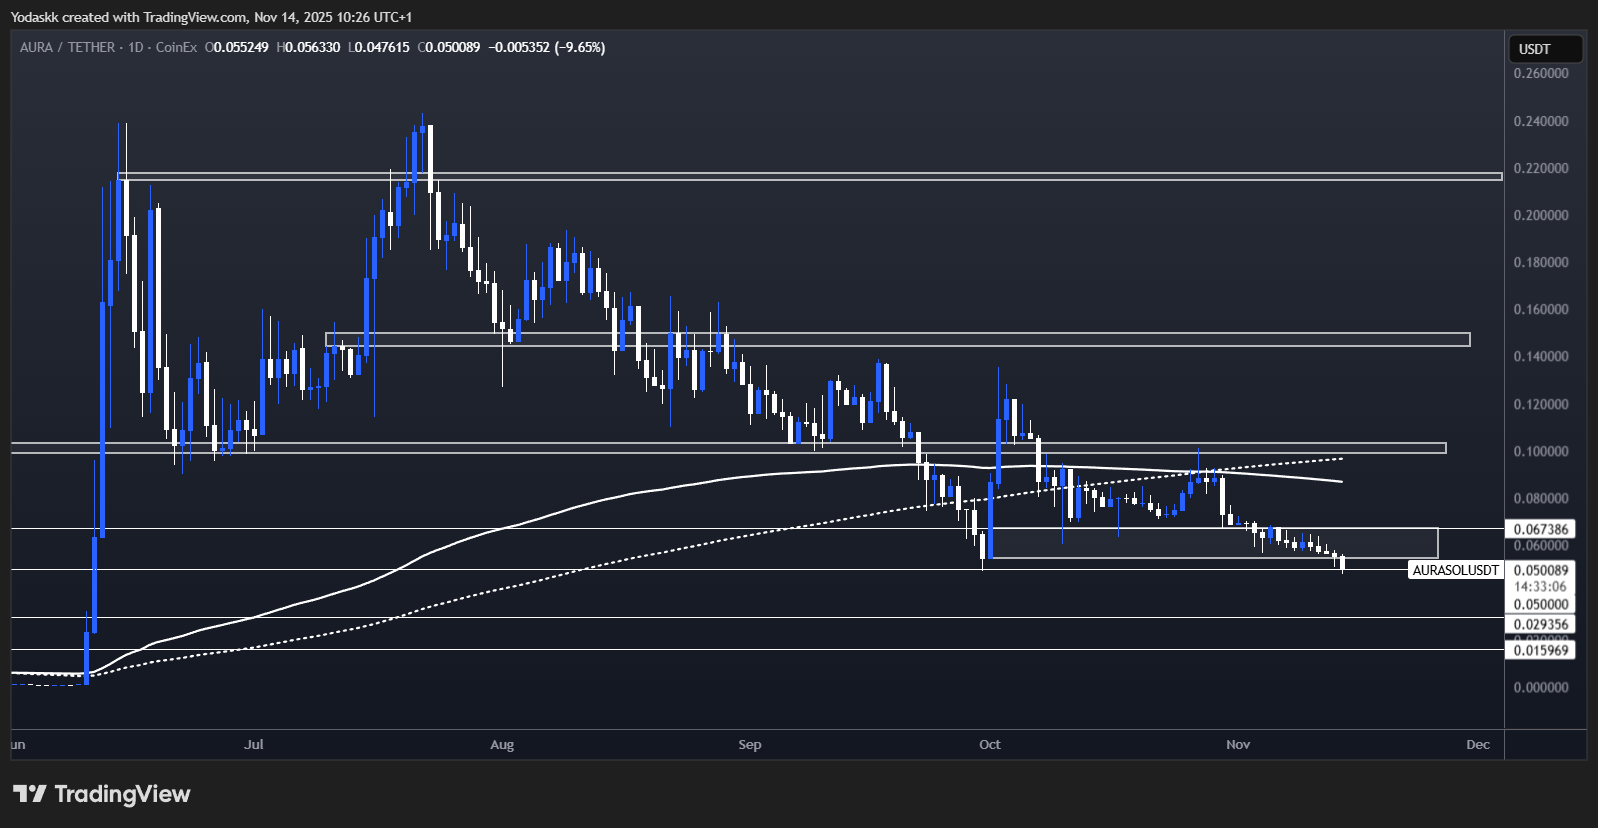
AURA is currently at $0.046 and close to breaking the $0.055–$0.065 support zone (daily orderblock support).Reclaiming $0.065 would be the first step to signal a bullish shift. A confirmed breakout above the $0.10 resistance and we would probably move fast toward the $0.15 level and beyond.
A close below the daily orderblock at $0.055–$0.065 today would invalidate the Adam & Eve pattern.
Next support after $0.05 is around $0.03 for AURA and this would likely present an attractive buying opportunity for long-term investors.
Cryptonary's take
Patience on AURA makes sense—wait for decisive reclaim of $0.065 or a higher timeframe setup. Value buy for long-term only towards $0.03–$0.029 range.- Next Support: $0.029
- Next Resistance: $0.065
- Direction: Neutral
- Upside Target: $0.10–$0.15
- Downside Target: $0.029
Closing words
Following our Nov 3rd/7th Market Directions, BTC moved precisely to our $100k-$102k target zone (orderblock + SFP zone + Weekly 50 EMA confluence).We then got the SFP we expected and a bounce followed. BTC went directly to our resistance area around $108k, before getting rejected, confirming the bearish thesis.
If we get a weekly close below the Weekly 50 EMA by Sunday, it is a change in BTC’s behavior and opens the possibility of a longer bear phase. We should treat future bounces as possible bear market rallies to hedge or exit, and then only rebuy on confirmed break of resistances.
Current assessment: 70% probability the $89-$93k area lead to a bounce to as high as $108-$110k based on:
- Yearly Open at 93K is a Key Level
- 50/200 Daily SMA Deathcross close to a local low
- 89k-110k range play
Action: Add below 94k, as per our analysis:
- Option A: Wait for a deviation below and reclaim of the Yearly Open at $93k (safest)
- Option B: Buy on a confirmed 50/200 Daily Deathcross
- Bear market Rally: Treat any bounce in the next 2-3 months to as high as $108k-$110k resistance as a bear market rally to derisk as close to the 200-Day SMA.
- Keep our $108k-$110k Hedge or Hedge close to $108k-$110k
- Close Hedge or Rebuy if we get 3 daily closes above $110k and above 200-Day SMA
For institutional flow data, ETF tracking, and macro catalysts: See Tom's Market Update published today.
*This Week’s Key Monitoring Points (Nov 14-21):*
Daily Checklist:
□ Is BTC holding $88k-$93k?
□ DATs with mNAV < 1 - any reversal?
□ ETF flows - any reversal to positive?
□ S&P 500 & NASDAQ - time to bounce?
□ DXY - is 100-101 still resistance?
*Critical Levels This Week:*
- BTC $93k Yearly Open is Key Level
- BTC above $108k-$110k = bearish thesis invalidated
- ETF flows positive 3+ days = institutions returning (see Market Update for flow analysis)
- DXY above 101 = continued dollar strength headwind
- Fed speaker increase hawkishness
- Data releases following the reopening of government
- Major BTC whales offloading
Thanks for reading!
*These levels are valid through Sunday, November 16th. Fresh analysis next Monday.*
Video Timestamp:
- BTC: 0-11min30
- ETH: 1min30-19min20
- SOL: 19min20-25min50
- HYPE: 25min50-30min20
- Aura: 30min20-end
Continue reading by joining Cryptonary Pro
$1,548 $1,197/year
Get everything you need to actively manage your portfolio and stay ahead. Ideal for investors seeking regular guidance and access to tools that help make informed decisions.
For your security, all orders are processed on a secured server.
As a Cryptonary Pro subscriber, you also get:
3X Value Guarantee - If cumulative documented upside does not reach 300% during your 12-month membership, you can request a full refund. Terms
24/7 access to experts with 50+ years’ experience
All of our top token picks for 2025
On hand technical analysis on any token of your choice
Weekly livestreams & ask us anything with the team
Daily insights on Macro, Mechanics, and On-chain
Curated list of top upcoming airdrops (free money)
3X Value Guarantee
If cumulative documented upside does not reach 300% during your 12-month membership, you can request a full refund.
Our track record speaks for itself
With over 2.4M tokens and widespread misinformation in crypto, we cut through the noise and consistently find winning assets.
Our track record speaks for itself
With over 2.4M tokens and widespread misinformation in crypto, we cut
through the noise and consistently find winning assets.


Frequently Asked Questions
Can I trust Cryptonary's calls?
Yes. We've consistently identified winners across multiple cycles. Bitcoin under $1,000, Ethereum under $70, Solana under $10, WIF from $0.003 to $5, PopCat from $0.004 to $2, SPX blasting past $1.70, and our latest pick has already 200X'd since June 2025. Everything is timestamped and public record.
Do I need to be an experienced trader or investor to benefit?
No. When we founded Cryptonary in 2017 the market was new to everyone. We intentionally created content that was easy to understand and actionable. That foundational principle is the crux of Cryptonary. Taking complex ideas and opportunities and presenting them in a way a 10 year old could understand.
What makes Cryptonary different from free crypto content on YouTube or Twitter?
Signal vs noise. We filter out 99.9% of garbage projects, provide data backed analysis, and have a proven track record of finding winners. Not to mention since Cryptonary's inception in 2017 we have never taken investment, sponsorship or partnership. Compare this to pretty much everyone else, no track record, and a long list of partnerships that cloud judgements.
Why is there no trial or refund policy?
We share highly sensitive, time-critical research. Once it's out, it can't be "returned." That's why membership is annual only. Crypto success takes time and commitment. If someone is not willing to invest 12 months into their future, there is no place for them at Cryptonary.
Do I get direct access to the Cryptonary team?
Yes. You will have 24/7 to the team that bought you BTC at $1,000, ETH at $70, and SOL at $10. Through our community chats, live Q&As, and member only channels, you can ask questions and interact directly with the team. Our team has over 50 years of combined experience which you can tap into every single day.
How often is content updated?
Daily. We provide real-time updates, weekly reports, emergency alerts, and live Q&As when the markets move fast. In crypto, the market moves fast, in Cryptonary, we move faster.
How does the 3X Value Guarantee work?
We stand behind the value of our research. If the documented upside from our published research during your 12-month membership does not exceed three times (3X) the annual subscription cost, you can request a full refund. Historical context: In every completed market cycle since 2017, cumulative documented upside has exceeded 10X this threshold.
TermsRecommended from Cryptonary


