Save 23% ($351) & Get a Free 1-1 Call with our Team ⏰ : 0d 2h 59m 44s

Disclaimer: This is not financial or investment advice. You are responsible for any capital-related decisions you make, and only you are accountable for the results.
Quick bridge from last week…
In last week’s analysis, most majors were sitting right at key resistance areas, and we highlighted that weekly closings would be decisive, especially for Bitcoin and Solana. For Bitcoin, we clearly outlined two scenarios: if price failed to close above 96K on the weekly, the move up to 96K would be treated as a liquidity run as 96K was an important weekly external range liquidity point. That bearish scenario played out, with a sharp rejection from 96K, a weak weekly close, and immediate downside follow through.A similar structure unfolded in Solana. We flagged 143.5 as the minimum level required for a constructive weekly close, with 147 confirming continuation. Instead, Solana closed well below both levels near 137, triggering the downside liquidity path we had discussed and leading to an aggressive rollover early this week.
That said, while the bearish weekly scenario has played out so far, there are now secondary signals worth tracking. Bitcoin dominance is testing its first rejection zone, and both Hyperliquid and Aura are starting to form higher timeframe bullish divergence setups. These don’t confirm reversals yet, but they are developments that matter if price begins to stabilise. With that context in mind, today’s analysis focuses on whether these areas hold, or whether further downside levels come into play next. So let's dive in!
TLDR
- Bitcoin: Weekly close below 96K triggered downside follow through, price is now hovering near the 90,200-89,200 zone. Bias stays neutral bearish unless we see a deviation and reclaim above 89,200.
- Ethereum: Clean rejection from the 200 EMA and loss of the uptrend trendline has brought ETH back to the 3,055 support. Holding this keeps structure intact, a break opens 2,872-2,794 next.
- Solana: Failure to close above 143.5 and 147 led to a sharp rollover, with price now testing the lower end of the range near 126. Bias is neutral here as this is a higher timeframe demand cluster.
- Hyperliquid: Loss of 23.5 sent price straight into 21.5 support, where a potential bullish divergence is starting to form. Neutral bias until follow through confirms or support breaks.
- Aura: Price has deviated below the accumulation range, but a possible bullish divergence is developing on daily RSI. Still a base building phase until price reclaims 0.03 0.035.
- Bitcoin Dominance: Dominance has tapped the 59.9-60.1% rejection zone near the 200 EMA. A rejection here would favour alt relative strength, acceptance opens 61.4-62.1% next.
Bitcoin
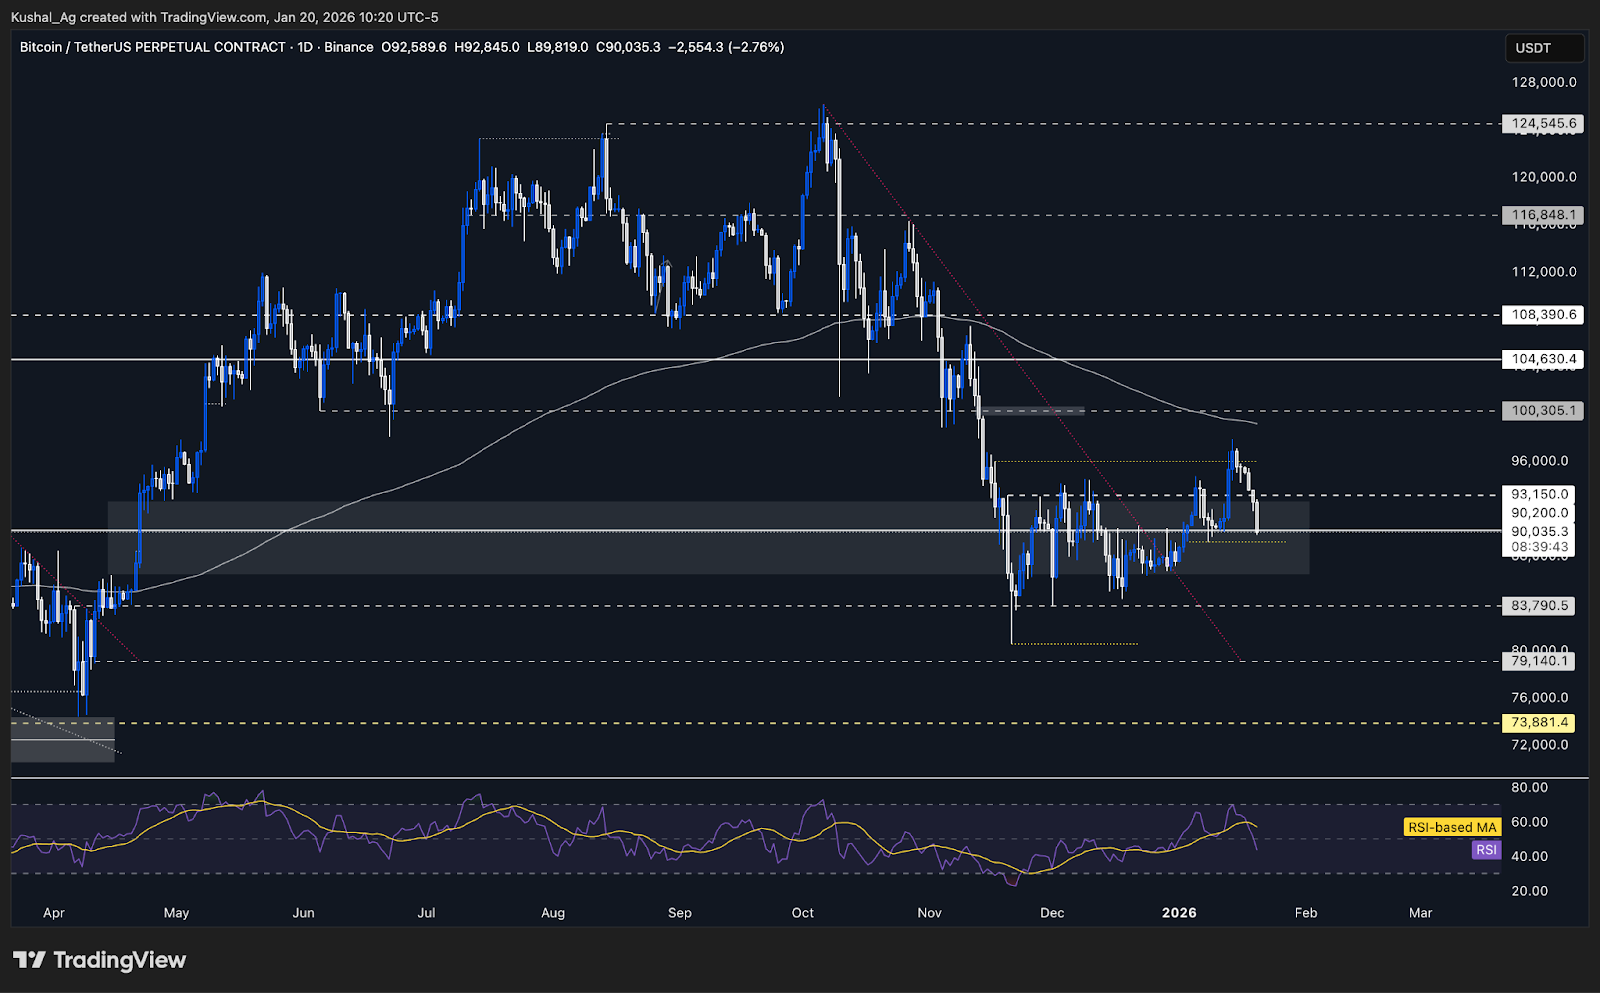
TA:Bitcoin failed to hold above the $96K weekly external range liquidity, which had been highlighted for weeks as the key decision zone. As discussed earlier, a weekly close below this level would likely shift focus toward downside liquidity, and that scenario has now played out.
Following the rejection from $96K, price rotated lower and immediately tagged $93,150, which has now been lost. This confirms rejection from the upper boundary of the 17th November weekly range, a range that capped price action for nearly two months.
With $93,150 broken, Bitcoin is now hovering just above the $90,200 support region. This zone is acting as the current line of defence, but structure has weakened meaningfully after the failed weekly acceptance above $96K.
The next liquidity pocket sits at $89,200. A wick below this level followed by a swift reclaim would suggest a potential local exhaustion move. However, daily acceptance below $89,200 would likely open deeper downside liquidity at $86,400 and $83,790.
Momentum has also cooled alongside price, RSI has slipped back toward the neutral zone around 47 with average at 56, while the 200 EMA near $99,200 remains flat but overhead, reinforcing that Bitcoin is trading below higher-timeframe trend resistance.
Key Levels
- Next Support: 90,200
- Next Resistance: 93,150
- Direction: Neutral-Bearish
- Upside Target: 96,000
- Downside Target: 89,200 and 86,400
Cryptonary’s Take
Bitcoin has resolved its multi-week consolidation lower after failing to secure a weekly close above $96K. The move into $93,150 and subsequent breakdown aligns with the downside liquidity scenario outlined previously, shifting focus away from continuation and toward protection of key supports.From here, the $89,200-$90,200 region is critical. A deviation below this zone followed by reclaim would keep price rotational and open the door for stabilization. However, acceptance below $89,200 would invalidate any short-term base thesis and expose $86,400 and $83,790. Until proven otherwise, Bitcoin remains neutral-bearish, with risk skewed to the downside.
Ethereum
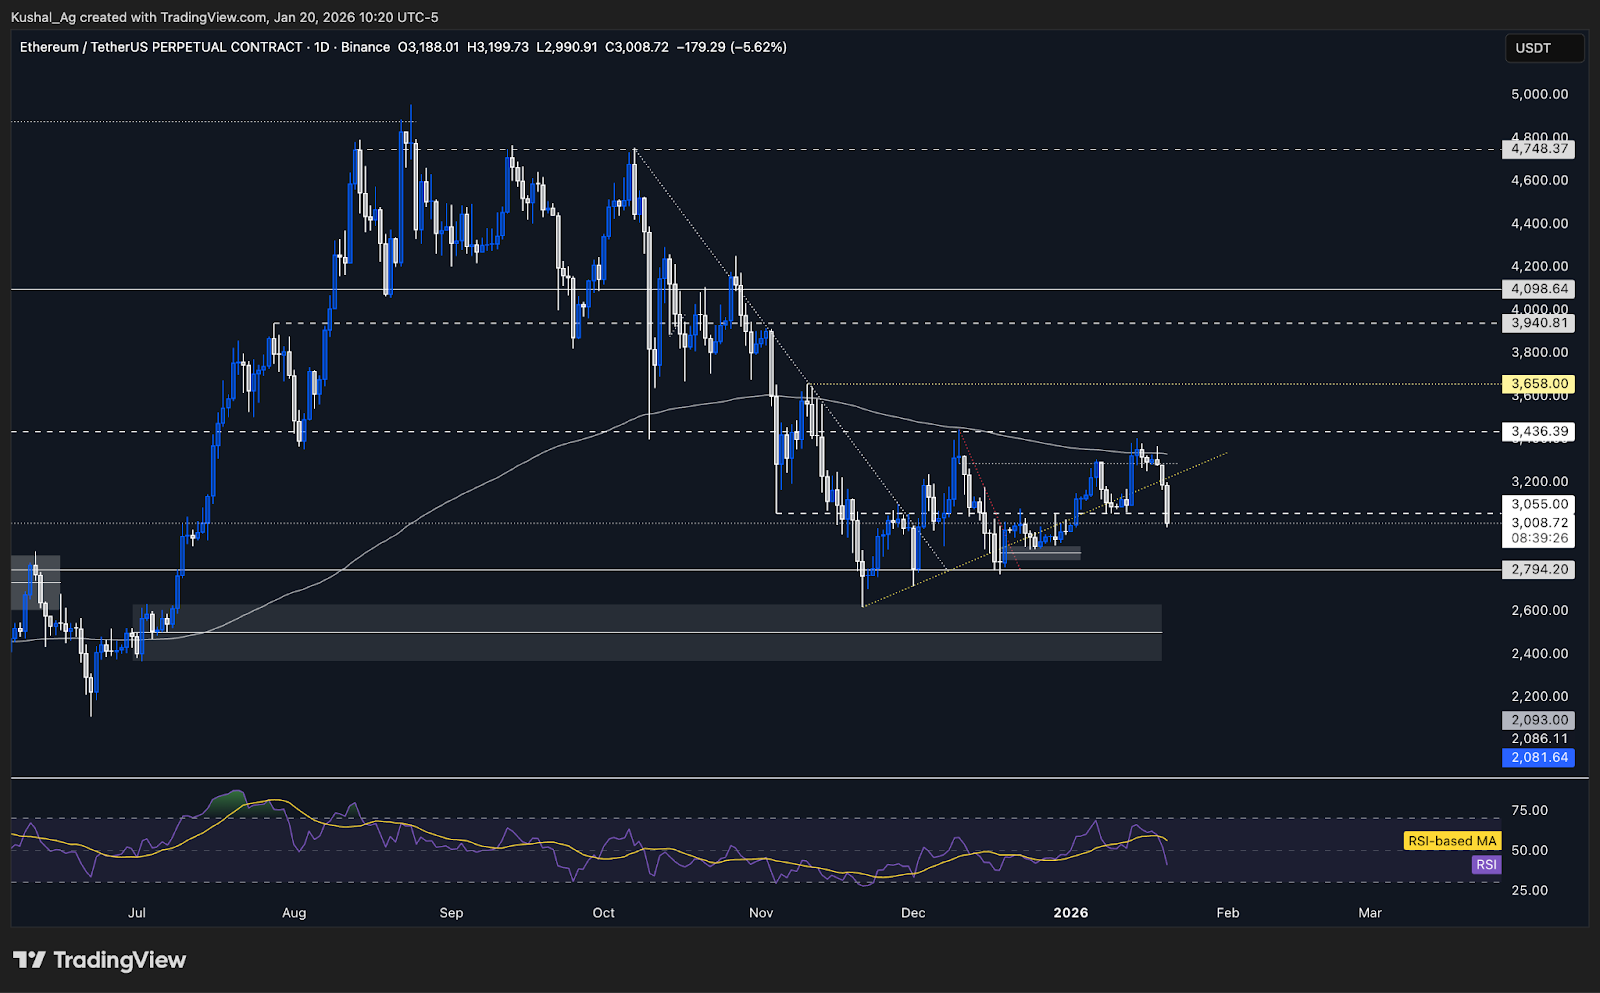
TA:Ethereum failed to sustain acceptance above the $3,287 region and faced a clean rejection at the daily 200 EMA, where selling pressure clearly emerged. This rejection marked the start of the current pullback and confirmed that higher-timeframe supply remains active near the 200 EMA zone.
Following the rejection, price rolled back toward the reclaimed uptrend trendline, but that structure was lost again, invalidating the short-term bullish reclaim. This loss of trend support weakens the immediate structure and shifts focus back toward demand defense.
Ethereum is now back at the $3,055 support area, which has been a key pivot throughout recent price action. This level is critical for maintaining any constructive structure, acceptance above it keeps price in consolidation, while a clean breakdown opens downside liquidity.
If $3,055 fails, downside liquidity sits at $2,872 first, followed by $2,794, both of which were previously untested during the prior rally. A decisive break below $3,055 would confirm a shift from neutral-bearish into a more clearly bearish continuation phase.
Momentum has also softened alongside structure, RSI has slipped into the low 40s with average at 56, reflecting loss of bullish pressure, while the 200 EMA near $3,333 remains flat to slightly restrictive overhead, reinforcing the current corrective environment.
Key Levels
- Next Support: 3,055
- Next Resistance: 3,286
- Direction: Neutral-Bearish
- Upside Target: 3,436
- Downside Target: 2,872 and 2,794
Cryptonary’s Take
Ethereum is at a make or break level. The rejection from the 200 EMA and loss of the uptrend trendline force a defensive stance, with $3,055 now acting as the line in the sand for structure.As long as price holds above $3,055, this remains a consolidation within a broader range rather than an outright breakdown. However, a daily close below this level would likely accelerate downside into the $2,800 liquidity pocket.
For bullish structure to return, Ethereum must reclaim the uptrend trendline and re-accept above the $3,200-$3,300 zone. Until then, risk remains skewed to the downside.
Solana
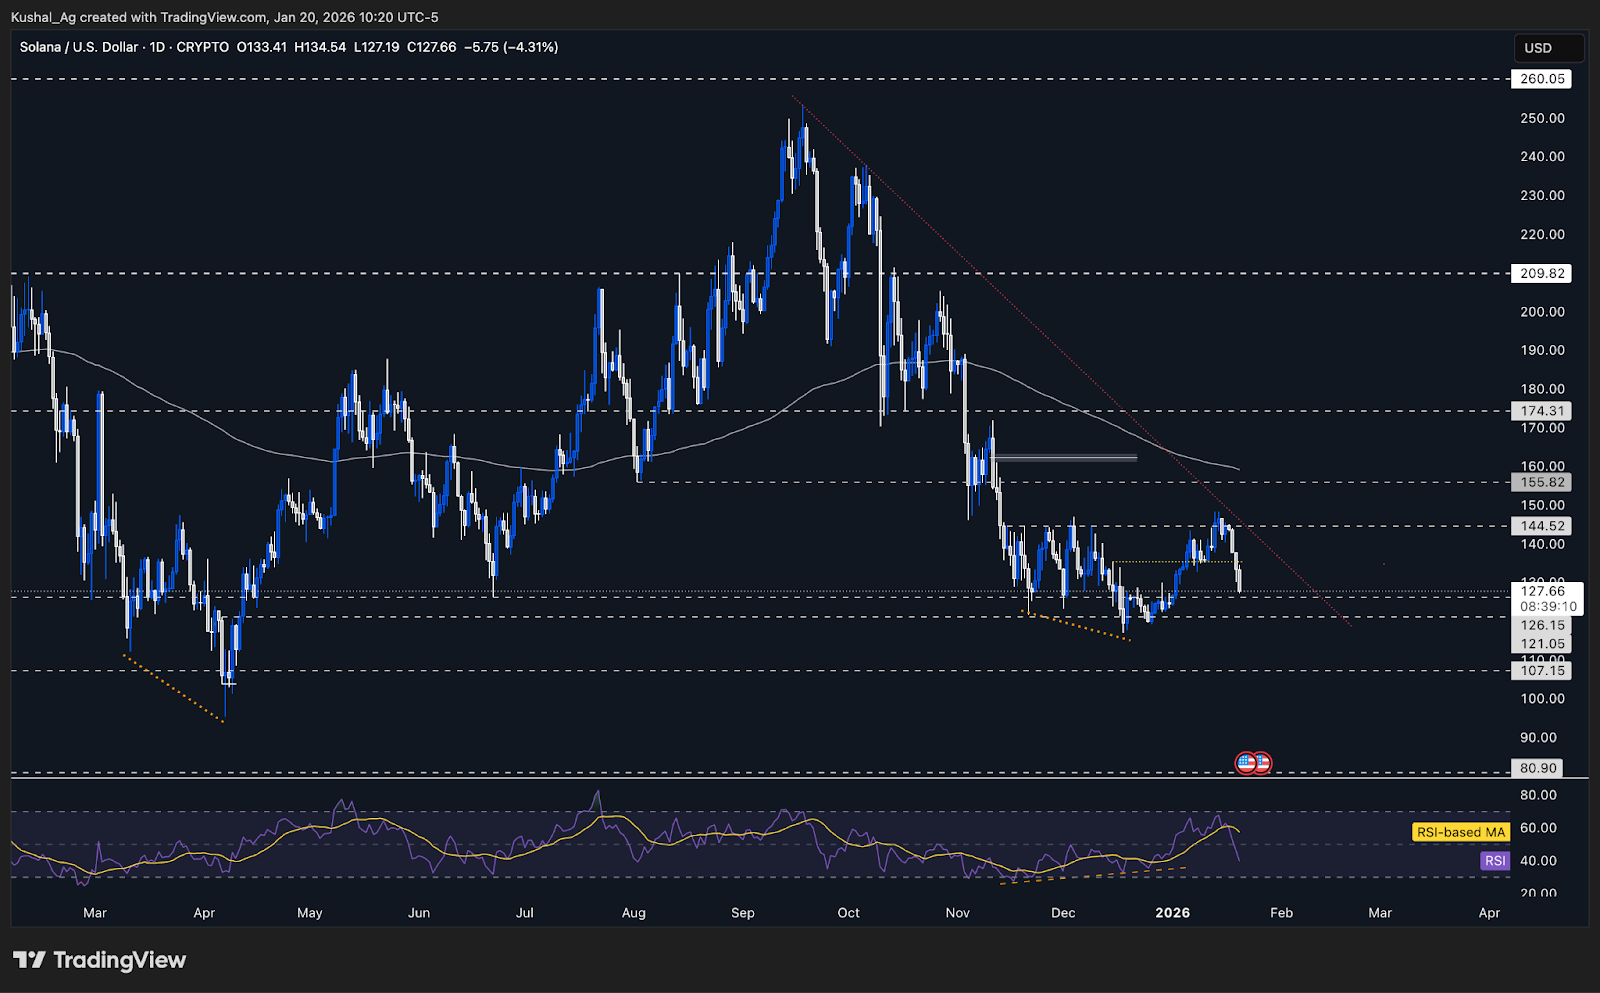
TA:Solana failed to meet the key weekly requirements highlighted in the prior analysis, with price unable to secure a weekly close above either $143.5 or $147. This rejection after tapping upside liquidity immediately shifted risk lower, as failure to close above prior highs opened the door for downside liquidity to get tagged.
Following the weak weekly close near $137, Solana did not defend the $135 support at all and rolled straight lower, quickly moving back into the lower end of its prior multi week range. This move confirmed that upside acceptance was lacking and that the liquidity sweep above weekly highs was not followed by continuation.
Price is now hovering near the range lows where Solana previously accumulated through mid late November into December. This zone is structurally important, as it overlaps with prior demand and sits just above major higher-timeframe support, making directional conviction difficult at this stage.
The $126-$121 region is now the key area to monitor. This zone aligns with the weekly 200 EMA and represents a major demand cluster on higher timeframes. Given this context, pressing bearish bias into this support is not the best move, and price action here will determine the next directional phase.
RSI has dropped to around 40, well below neutral, reflecting the sharp reset from prior strength. The daily 200 EMA near $159 continues to slope slightly lower, reinforcing broader pressure, but momentum stabilization around this demand zone would be the first signal of a potential base forming.
Key Levels
- Next Support: 126.15
- Next Resistance: 135
- Direction: Neutral
- Upside Target: 144.5
- Downside Target: 121 and 107
Cryptonary’s Take
Solana is now sitting at a structurally significant demand zone after failing its weekly breakout attempt. The rejection above $143.5-$147 shifted liquidity lower, and price has already retraced deep into its prior accumulation range.At this stage, neutrality is warranted. The $126-$121 region, reinforced by the weekly 200 EMA, is not an area to press bearish bias aggressively. Instead, the focus shifts to whether price can stabilize and carve a base here, or whether this zone fails cleanly.
If $121 is lost with acceptance, $107 becomes the next major liquidity pocket. Conversely, a strong reaction and base above $126 would reopen the path toward $135 and eventually $144.5.
Hyperliquid
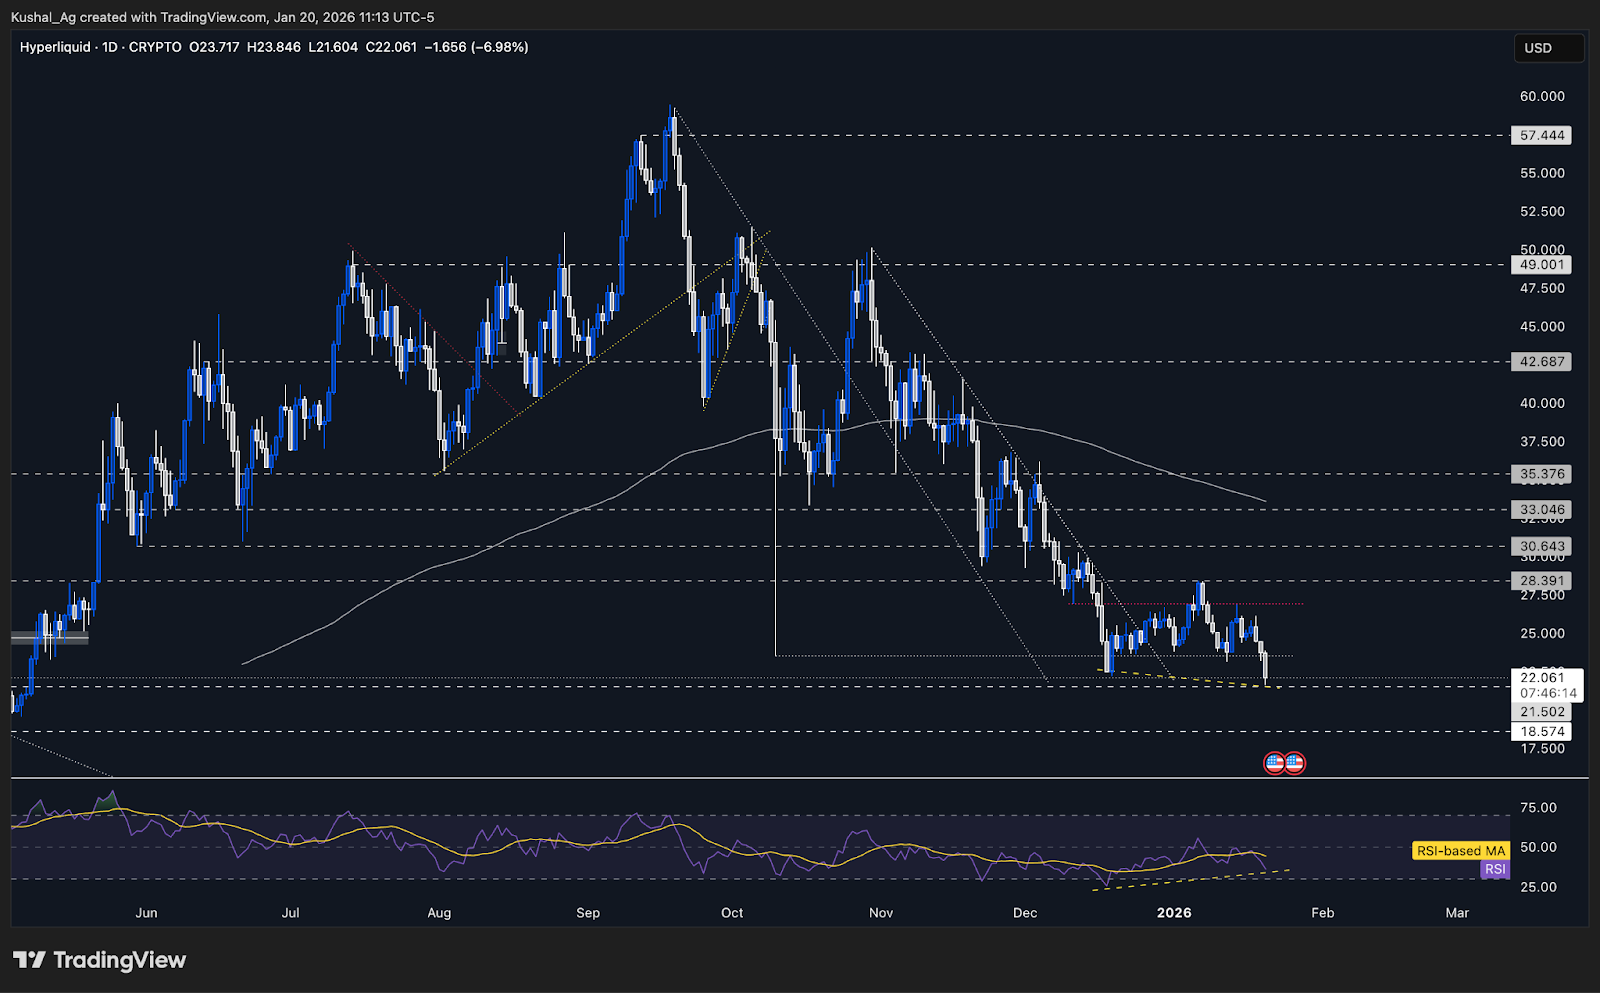
TA:Hyperliquid was unable to hold the $23.5 support region, which had acted as a base since mid December. After multiple attempts to stabilise above this level, price eventually lost the support and expanded lower, confirming that the base building attempt at $23.5 failed.
Following the breakdown, price moved directly into the next predefined support around $21.5, where it is currently attempting to stabilise. This level is acting as intermediate support for now, and price behaviour here will be critical in determining whether Hyperliquid can move to a recovery phase or continue lower.
As discussed in prior analyses, two potential setups were in play for Hyperliquid: either sustained base formation at $23.5 or the development of a bullish divergence if $23.5 failed. With price now trading below $23.5, the second scenario is beginning to materialise, shifting focus toward momentum behaviour.
When comparing the December 18-19 lows with the current January lows, price has made a lower low while RSI has printed a higher low. This is the early structure of a bullish divergence, but it remains unconfirmed. For confirmation, Hyperliquid will need clear upside follow-through, ideally reclaiming at least the $23.5 region. Until that happens, this remains a developing setup.
RSI is hovering around 36 with an average near 44, reflecting the sharp downside pressure over recent sessions. The 200 EMA on the daily timeframe continues to slope lower and sits near $23.5, reinforcing that reclaiming this zone is structurally important for any bullish shift.
Key Levels
- Next Support: 21.5
- Next Resistance: 23.5
- Direction: Neutral
- Upside Target: 26.9
- Downside Target: 18.57
Cryptonary’s Take
Hyperliquid is now firmly in a wait and watch phase. The loss of $23.5 invalidated the base formation thesis, but it also opened the door for a higher quality setup in the form of a potential bullish divergence. This keeps Hyperliquid interesting, even as price trades weak.The $21.5 region is now the line of defence. As long as price can stabilise here and show signs of absorption, the probability of a divergence-driven recovery remains alive. A reclaim of $23.5 would be the first meaningful confirmation that momentum is shifting back in favour of buyers.
Until that confirmation arrives, neutrality is the correct stance. A clean break below $21.5 would invalidate the divergence structure and expose $18.57 next.
Aura
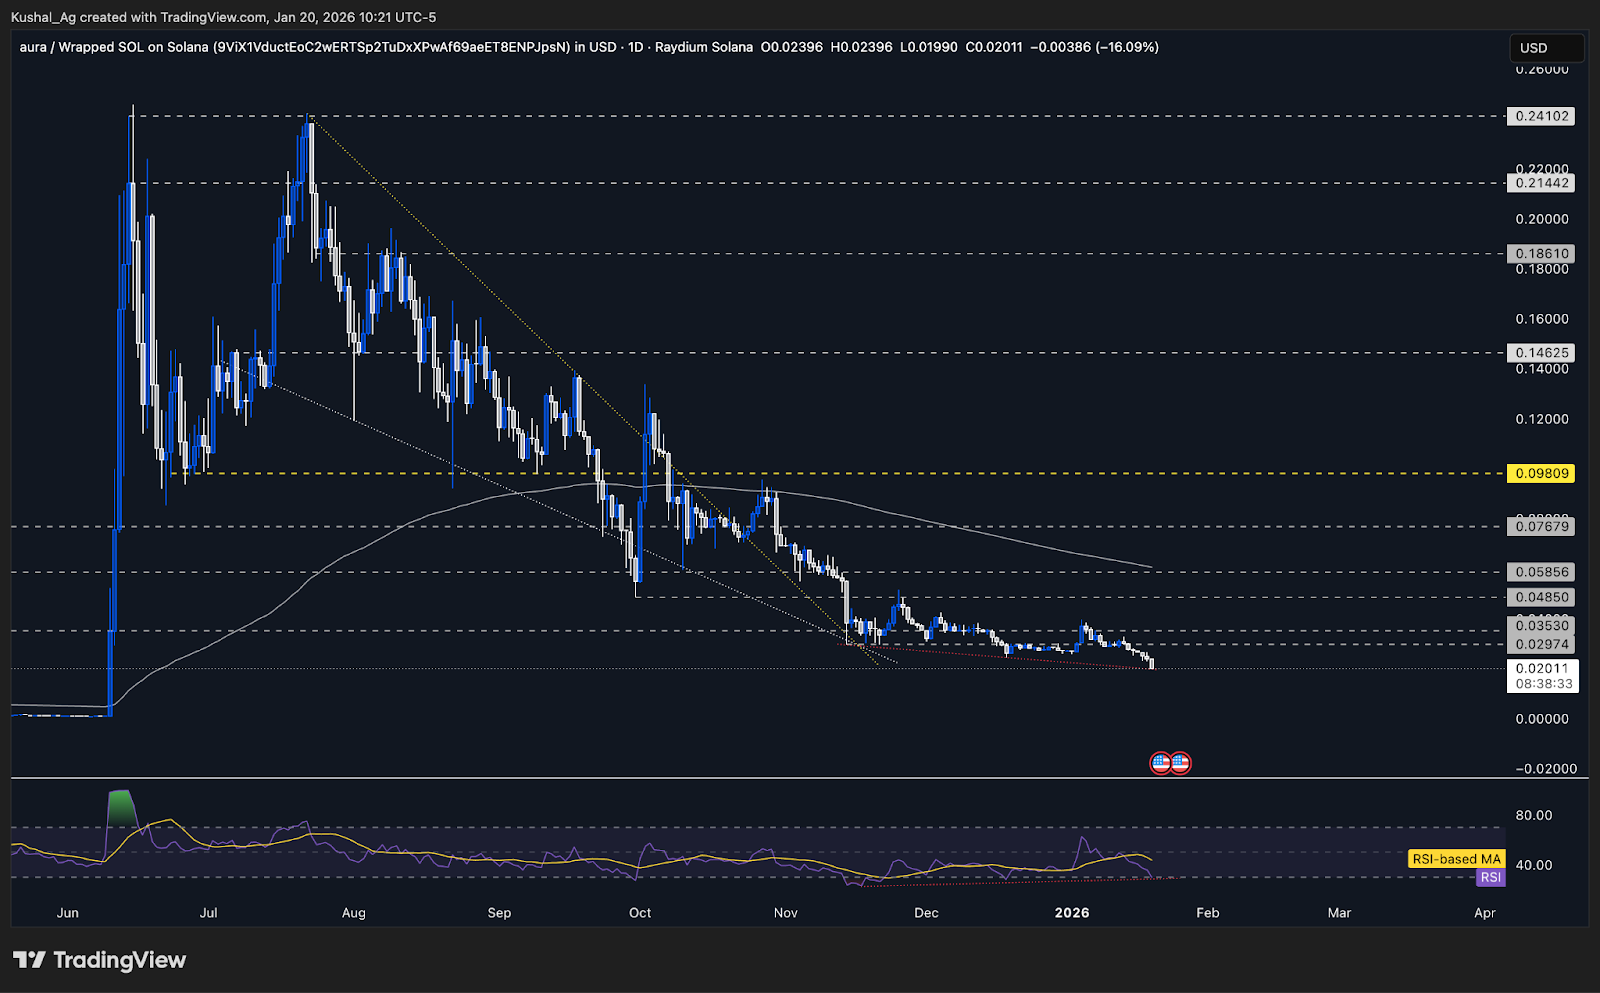
TA:Aura is currently trading slightly below its prior accumulation range, but this move needs to be viewed in context and not isolation. The recent dip has come alongside a broader market pullback, with memes and Solana linked assets seeing pressure together, so Aura’s price action remains part of a wider market adjustment.
On the daily timeframe, there are early signs of a potential bullish divergence beginning to form. When comparing the mid November lows with the current structure, price has printed a marginally lower low while RSI has held a higher low. This suggests that selling pressure may be weakening beneath the surface, even though price has not yet reflected that shift.
That said, this divergence remains unconfirmed. For validation, Aura will need stabilisation followed by visible bullish follow-through, ideally with price reclaiming the 0.03-0.035 region. Without that reclaim, this remains a setup in formation.
RSI has slipped into the oversold region, hovering near 30 with the average around 44, while the 200 EMA on the daily timeframe remains higher near 0.06. This positioning reinforces that Aura is still in a broader basing phase, with structure development taking precedence over immediate direction.
- Direction: Bullish
- Action Plan: DCA and Raid
Cryptonary’s Take
Aura is currently at a point where structure matters more than speed. The slight deviation below the accumulation range has opened the door for a potential bullish divergence, but confirmation will only come if price can stabilise and reclaim key levels with volume and follow through.Until that happens, patience is key. If Aura can regain the 0.03-0.035 zone, the divergence thesis strengthens and upside probabilities improve. If not, further consolidation remains part of the process.
Bitcoin Dominance
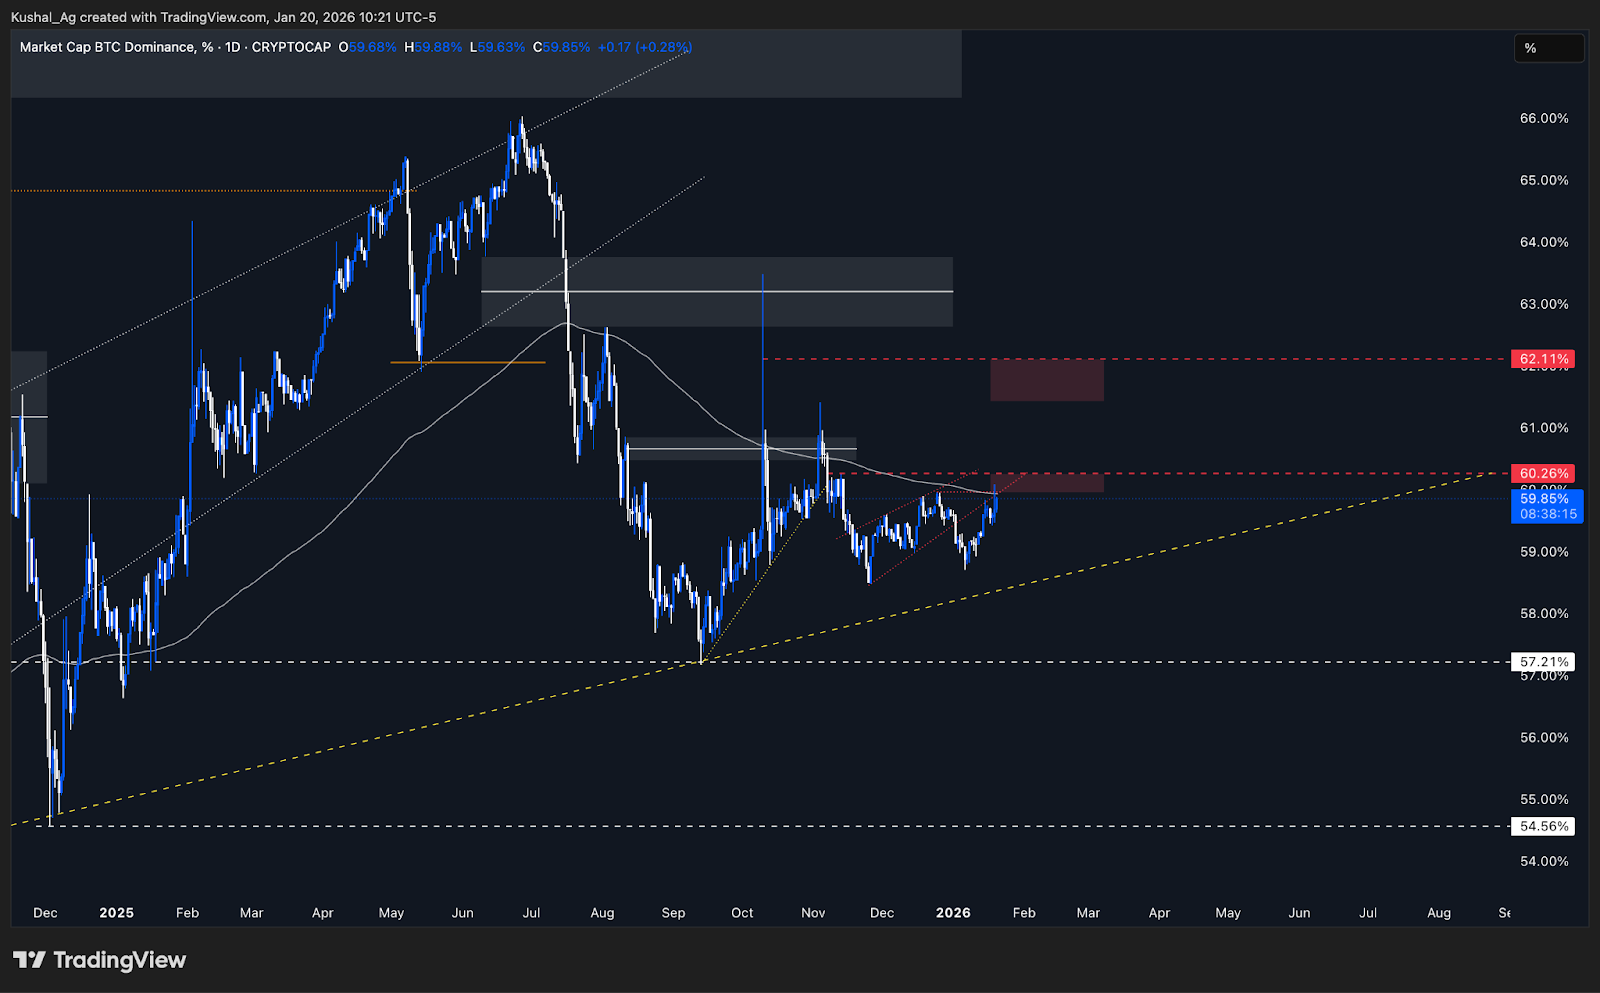
TA:Bitcoin dominance has now tapped the first key zone we were tracking, with price pushing into the 59.9% area and printing a local high near 60.08%. This was a level we had marked in advance as a potential rejection zone, and dominance is currently reacting around it.
Structurally, this area is important because it aligns closely with the 200 EMA on the daily timeframe. Dominance has recently struggled to sustain acceptance above this moving average, and once again price is interacting with it from below, which keeps the rejection scenario firmly in play for now.
From here, the behaviour around this band becomes critical. A rejection anywhere between 59.9% and 60.12% would reinforce the idea that dominance is topping locally, which would typically allow relative strength to rotate into altcoins. A brief wick above this zone is acceptable, but sustained acceptance is not.
If dominance does manage to close decisively above this region, focus shifts higher toward the next major supply zone between 61.4% and 62.1%. A move into that upper zone would likely imply further short-term pressure on alts before a broader rotation can begin.
Bitcoin Dominance Chart:
Cryptonary’s Take
Bitcoin dominance is sitting at an important point. This 59.9%-60.12% zone is exactly where we want to see rejection if the market is preparing for broader altcoin participation. A clean rejection here would be constructive for alts and align with rotation.If dominance instead accepts above this zone and starts pushing toward 61.4%-62.1%, it would signal that Bitcoin continues to absorb relative strength, delaying any meaningful alt expansion. This is a chart we’ll continue to track closely, as its next move will heavily influence how aggressively we position across the rest of the market.
Closing Thoughts
Bitcoin is now sitting at a critical decision zone, with $89,200 acting as the key pivot. A clean breakdown below this level would likely open the door toward $86,400, followed by deeper downside levels beyond that. However, if we see a deviation below $89,200 or continued acceptance above $90,200-$92,000, the probability shifts toward a stabilisation phase and a potential continuation attempt on the upside. That upside scenario, however, requires immediate strength to show up from here.Ethereum is also testing an important support region. A loss of this area would leave room for a sharp 8-10% downside move, so how ETH behaves here will be crucial for broader market confidence. Solana, on the other hand, has already corrected meaningfully and is now back near major higher timeframe demand around $126, making this a zone where price discovery slows and structure needs to be reassessed.
On the alt side, Hyperliquid and Aura are both developing potential bullish divergence setups, which are worth tracking closely but still require confirmation. Finally, Bitcoin dominance is at a tipping point, a rollover from here would favour relative alt strength, while a push higher could extend pressure across the board. From here, it’s all about how price reacts at these levels, and we’ll continue adjusting bias as the structure unfolds.
Cryptonary, OUT!
Continue reading by joining Cryptonary Pro
$1,548 $1,197/year
Get everything you need to actively manage your portfolio and stay ahead. Ideal for investors seeking regular guidance and access to tools that help make informed decisions.
For your security, all orders are processed on a secured server.
As a Cryptonary Pro subscriber, you also get:
3X Value Guarantee - If cumulative documented upside does not reach 300% during your 12-month membership, you can request a full refund. Terms
24/7 access to experts with 50+ years’ experience
All of our top token picks for 2025
On hand technical analysis on any token of your choice
Weekly livestreams & ask us anything with the team
Daily insights on Macro, Mechanics, and On-chain
Curated list of top upcoming airdrops (free money)
3X Value Guarantee
If cumulative documented upside does not reach 300% during your 12-month membership, you can request a full refund.
Our track record speaks for itself
With over 2.4M tokens and widespread misinformation in crypto, we cut through the noise and consistently find winning assets.
Our track record speaks for itself
With over 2.4M tokens and widespread misinformation in crypto, we cut
through the noise and consistently find winning assets.


Frequently Asked Questions
Can I trust Cryptonary's calls?
Yes. We've consistently identified winners across multiple cycles. Bitcoin under $1,000, Ethereum under $70, Solana under $10, WIF from $0.003 to $5, PopCat from $0.004 to $2, SPX blasting past $1.70, and our latest pick has already 200X'd since June 2025. Everything is timestamped and public record.
Do I need to be an experienced trader or investor to benefit?
No. When we founded Cryptonary in 2017 the market was new to everyone. We intentionally created content that was easy to understand and actionable. That foundational principle is the crux of Cryptonary. Taking complex ideas and opportunities and presenting them in a way a 10 year old could understand.
What makes Cryptonary different from free crypto content on YouTube or Twitter?
Signal vs noise. We filter out 99.9% of garbage projects, provide data backed analysis, and have a proven track record of finding winners. Not to mention since Cryptonary's inception in 2017 we have never taken investment, sponsorship or partnership. Compare this to pretty much everyone else, no track record, and a long list of partnerships that cloud judgements.
Why is there no trial or refund policy?
We share highly sensitive, time-critical research. Once it's out, it can't be "returned." That's why membership is annual only. Crypto success takes time and commitment. If someone is not willing to invest 12 months into their future, there is no place for them at Cryptonary.
Do I get direct access to the Cryptonary team?
Yes. You will have 24/7 to the team that bought you BTC at $1,000, ETH at $70, and SOL at $10. Through our community chats, live Q&As, and member only channels, you can ask questions and interact directly with the team. Our team has over 50 years of combined experience which you can tap into every single day.
How often is content updated?
Daily. We provide real-time updates, weekly reports, emergency alerts, and live Q&As when the markets move fast. In crypto, the market moves fast, in Cryptonary, we move faster.
How does the 3X Value Guarantee work?
We stand behind the value of our research. If the documented upside from our published research during your 12-month membership does not exceed three times (3X) the annual subscription cost, you can request a full refund. Historical context: In every completed market cycle since 2017, cumulative documented upside has exceeded 10X this threshold.
TermsRecommended from Cryptonary


