BTC, ETH and More: Crypto Majors Break Resistance, Upside Structure Holds
The market continues to hold a constructive tone, with key support levels defended and several majors pushing into important resistance zones. Momentum remains favorable in the short term, though with prices extended in some areas, the next moves will depend on whether breakouts can be sustained.

Disclaimer: This is not financial or investment advice. You are responsible for any capital-related decisions you make, and only you are accountable for the results.
Quick bridge from earlier this week…
In the previous analysis, we maintained a neutral-bullish stance across all majors, conditional on key support regions holding. Since then, Bitcoin has continued to hold the $73,800 level, which was the key support for maintaining the constructive structure, keeping the stance intact. Ethereum continues to consolidate just below $2,400, with price showing signs of absorption near resistance, suggesting strength building for a potential breakout.Solana has now moved above the $87 resistance and is holding above it, opening the path toward mid $90s. Hyperliquid also continues to show strength, holding above the previous supply zone which has now flipped into support, keeping the upside structure intact. At the same time, we have added Total Market Cap once again in today's Market Direction, it has delivered the breakout above $2.46T that we were tracking, supporting the broader strength seen across the market.
On the macro side, sentiment has turned constructive in the short term, with equities rallying on optimism around potential US-Iran progress, supported by CTA buying and short covering, while Bitcoin’s move higher has been driven by a modest spot bid and a short squeeze, with positioning still relatively cautious. While this opens the door for further upside in the near term, the rally continues to look more like a relief move with key resistance zones overhead and ongoing geopolitical uncertainties still in play. For a deeper breakdown, refer to today's Market Update.
Disclaimer: This content is for informational and educational purposes only. It does not constitute financial advice, and should not be relied upon as a basis for making investment decisions. Virtual assets are volatile and may lose their value in full. Past performance does not indicate future results. Always do your own research.
TLDR
- Risk Posture: Neutral-Constructive
- Bitcoin: BTC continues to hold above $73,800, confirming a base above breakout. The stance remains neutral-bullish, with continuation toward $79,140 likely as long as support holds.
- Ethereum: ETH continues to consolidate at $2,400 after completing its upside move. The stance remains neutral-bullish, with a breakout opening $2,630-$2,800, supported by improving ETH/BTC strength.
- Solana: SOL has broken above $87 and confirmed it as support, shifting the stance to bullish. Price is now testing $89, and a clean break opens continuation toward $93.1-$100, with potential for relative outperformance given stronger momentum setup.
- Hyperliquid: HYPE continues to hold above $43.29 and build a base. The stance remains neutral-bullish, with $50 and $57 as the next upside targets.
- Aura: AURA is showing improving momentum with RSI around 60, with potential for outperformance if Solana’s breakout continues.
- Total Market Cap: TOTAL has broken above $2.46T and is holding the breakout. The stance is constructive, with continuation toward $2.65T-$2.72T and potentially $2.78T if strength holds.
Bitcoin
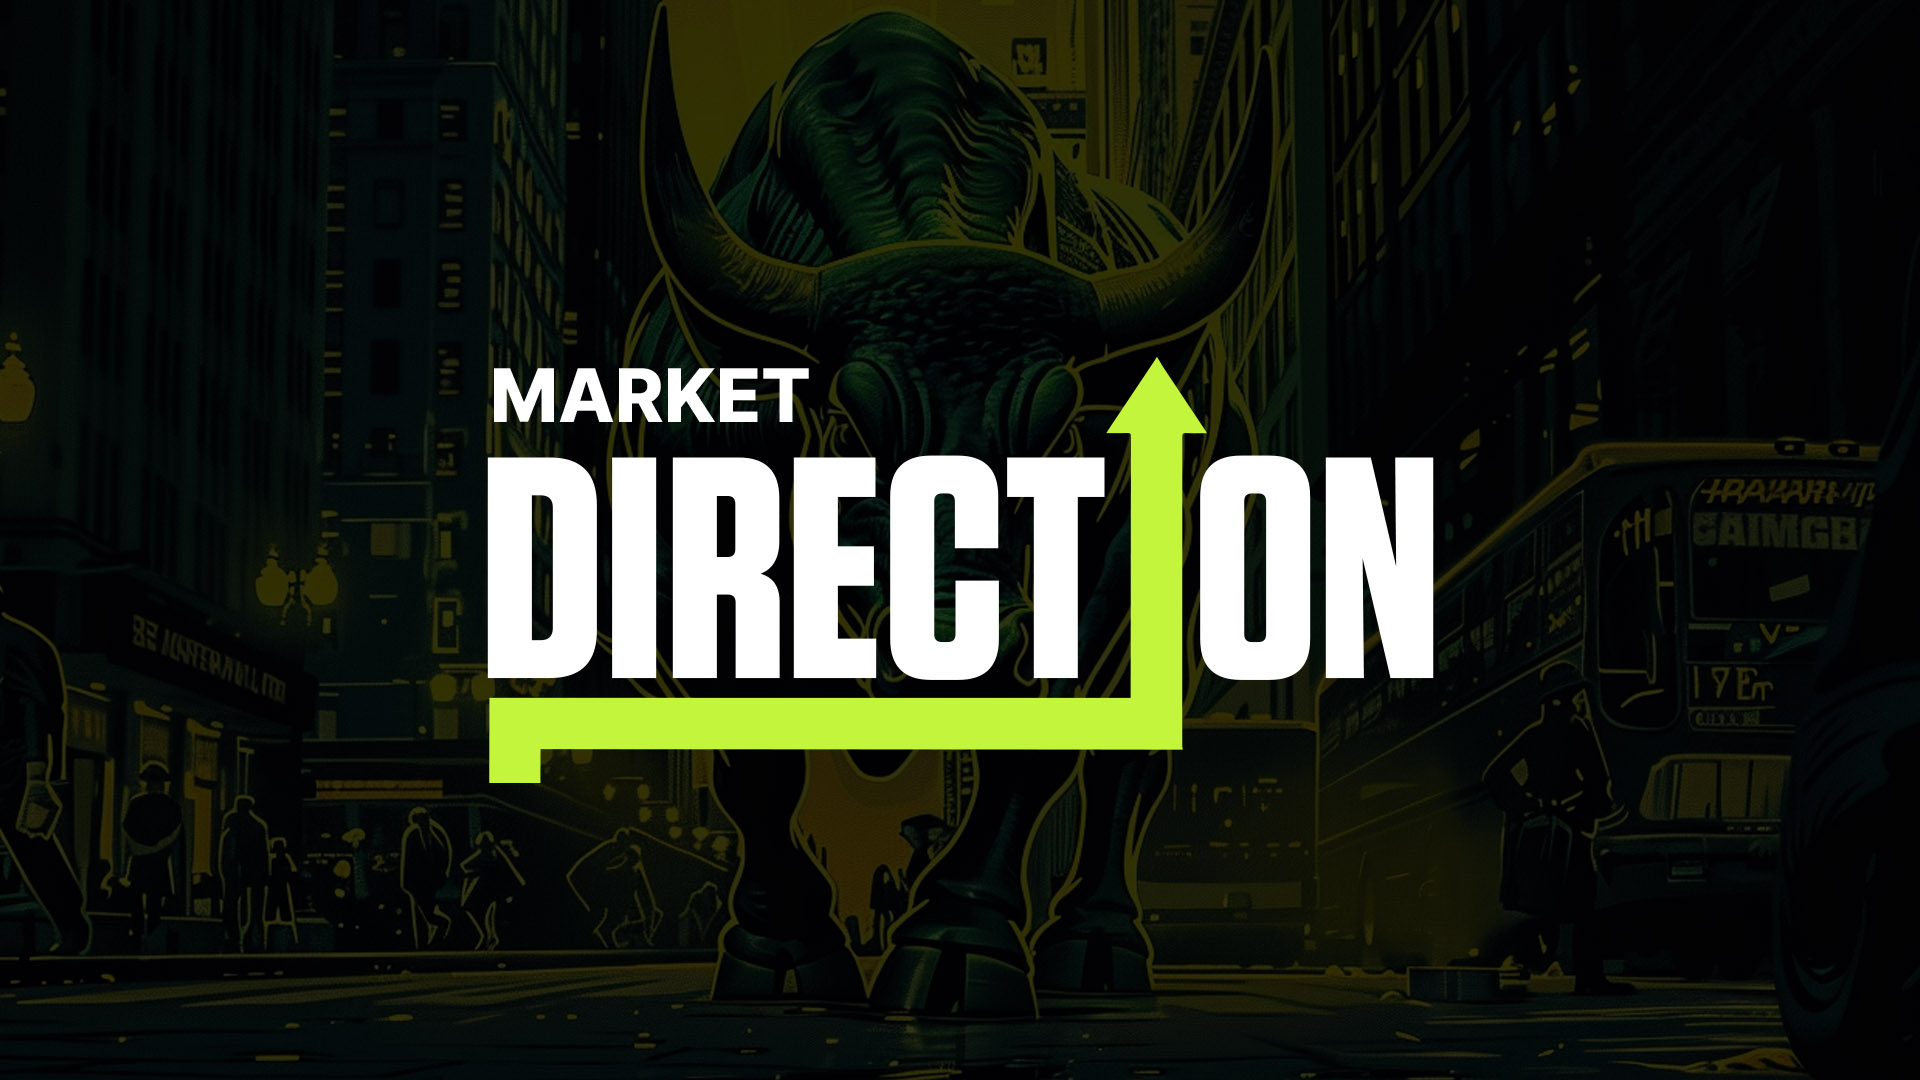
TABitcoin continues to hold the $73,800 support level, which was the key level we were tracking. Price has now spent multiple sessions above this region, confirming that a base is being built above the breakout zone.
As long as this level continues to hold, the structure remains constructive, with the base case staying neutral-bullish. This keeps the path open for a move toward the $79,140 level, which is the next upside liquidity and immediate resistance.
A continuation above $79,140 (weekly closing above this level) would then open the next upside toward $83,790, which also aligns closely with the 200 EMA, making it a strong confluence zone and a likely area for potential rejection if price reaches there.
On the downside, $73,800 remains the key support to hold. A breakdown below this level would invalidate the current structure and force a reassessment of the stance, potentially shifting it back toward neutral or even weaker conditions, with $70,500 coming into focus.
The 200 EMA is now around $83,000, showing signs of flattening after a sustained downtrend, which aligns closely with the higher resistance zone. RSI is around 64, sitting in a healthy range and supporting the current strength in price.
However, if RSI continues to push higher from here, it could start approaching overbought conditions in the coming sessions, which is something to watch for in terms of short-term exhaustion.
Key Levels:
- Support: $73,800
- Resistance: $79,140
- Direction: Neutral-Bullish
- Upside Target: $79,140 & $83,790
- Downside Target: $70,500
Cryptonary’s Take:
Bitcoin is holding its breakout well, with price building a base above $73,800, which keeps the structure constructive. The market now needs to sustain this strength for continuation toward higher levels.As long as this level holds, the bias remains to the upside, but a failure here would quickly shift the structure back into uncertainty. The stance remains neutral-bullish, with continued focus on price maintaining this base and push toward the next upside targets.
Ethereum
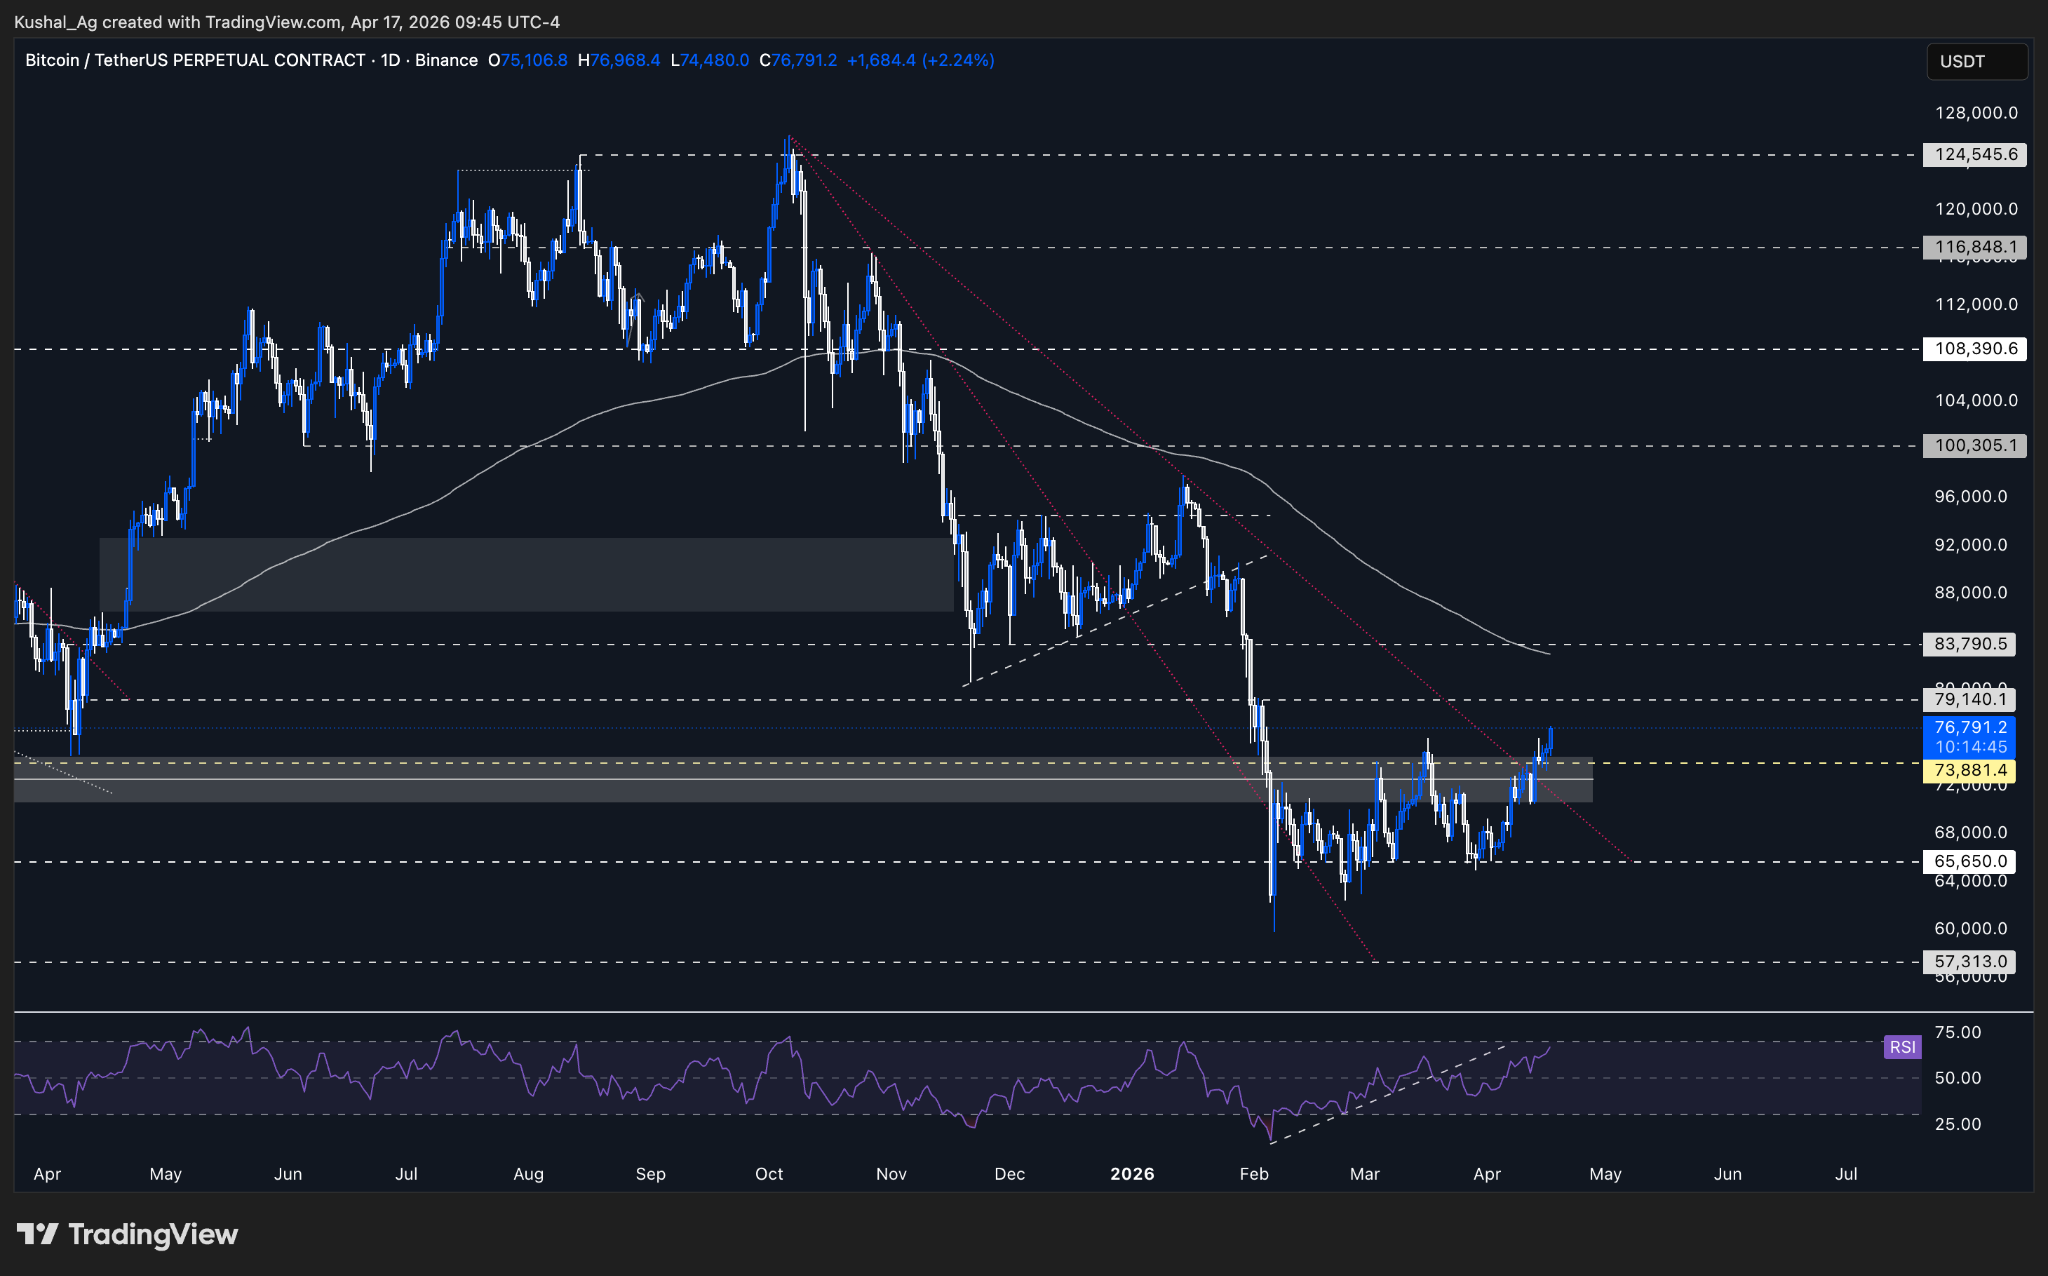
TAEthereum continues to consolidate just at the $2,400 resistance on the daily timeframe, with price forming a steady base near this region. The rejections from this level have not been strong, which suggests that selling pressure is limited for now.
As long as price continues to hold this region, the structure remains constructive, with a potential breakout building up. While the breakout above $2,400 has not materialized yet, the current price action suggests that a move higher is likely if strength sustains.
A confirmed breakout above $2,400 would open the next leg toward $2,630, followed by $2,800 as the next upside targets. Until then, price may continue to consolidate near highs before making a directional move.
On the downside, $2,170-$2,116 remains the key support zone. A rejection from current levels would shift structure back into a range-bound environment, with $1,957 as the next downside target.
The 200 EMA continues to trend downward near $2,653, aligning close to the higher resistance zone. RSI is around 62, sitting in a healthy range and supporting current strength, although a further push higher could bring RSI closer to overbought conditions in the short term similar to Bitcoin.
Key Levels:
- Support: $2,170 & $2,116
- Resistance: $2,400
- Direction: Neutral-Bullish
- Upside Target: $2,630 & $2,800
- Downside Target: $1,957
Cryptonary’s Take:
Ethereum continues to hold a neutral-bullish structure, with price consolidating just below resistance and showing signs of strength. The key trigger remains a breakout above $2,400, which would likely lead to continuation on the upside.At the same time, the ETH/BTC ratio has yet to show follow-through after its breakout and is currently facing resistance at the Daily 200 EMA near 0.0316. A reclaim of this level would be important for continuation and would support Ethereum outperforming Bitcoin in the short to medium term.
Solana
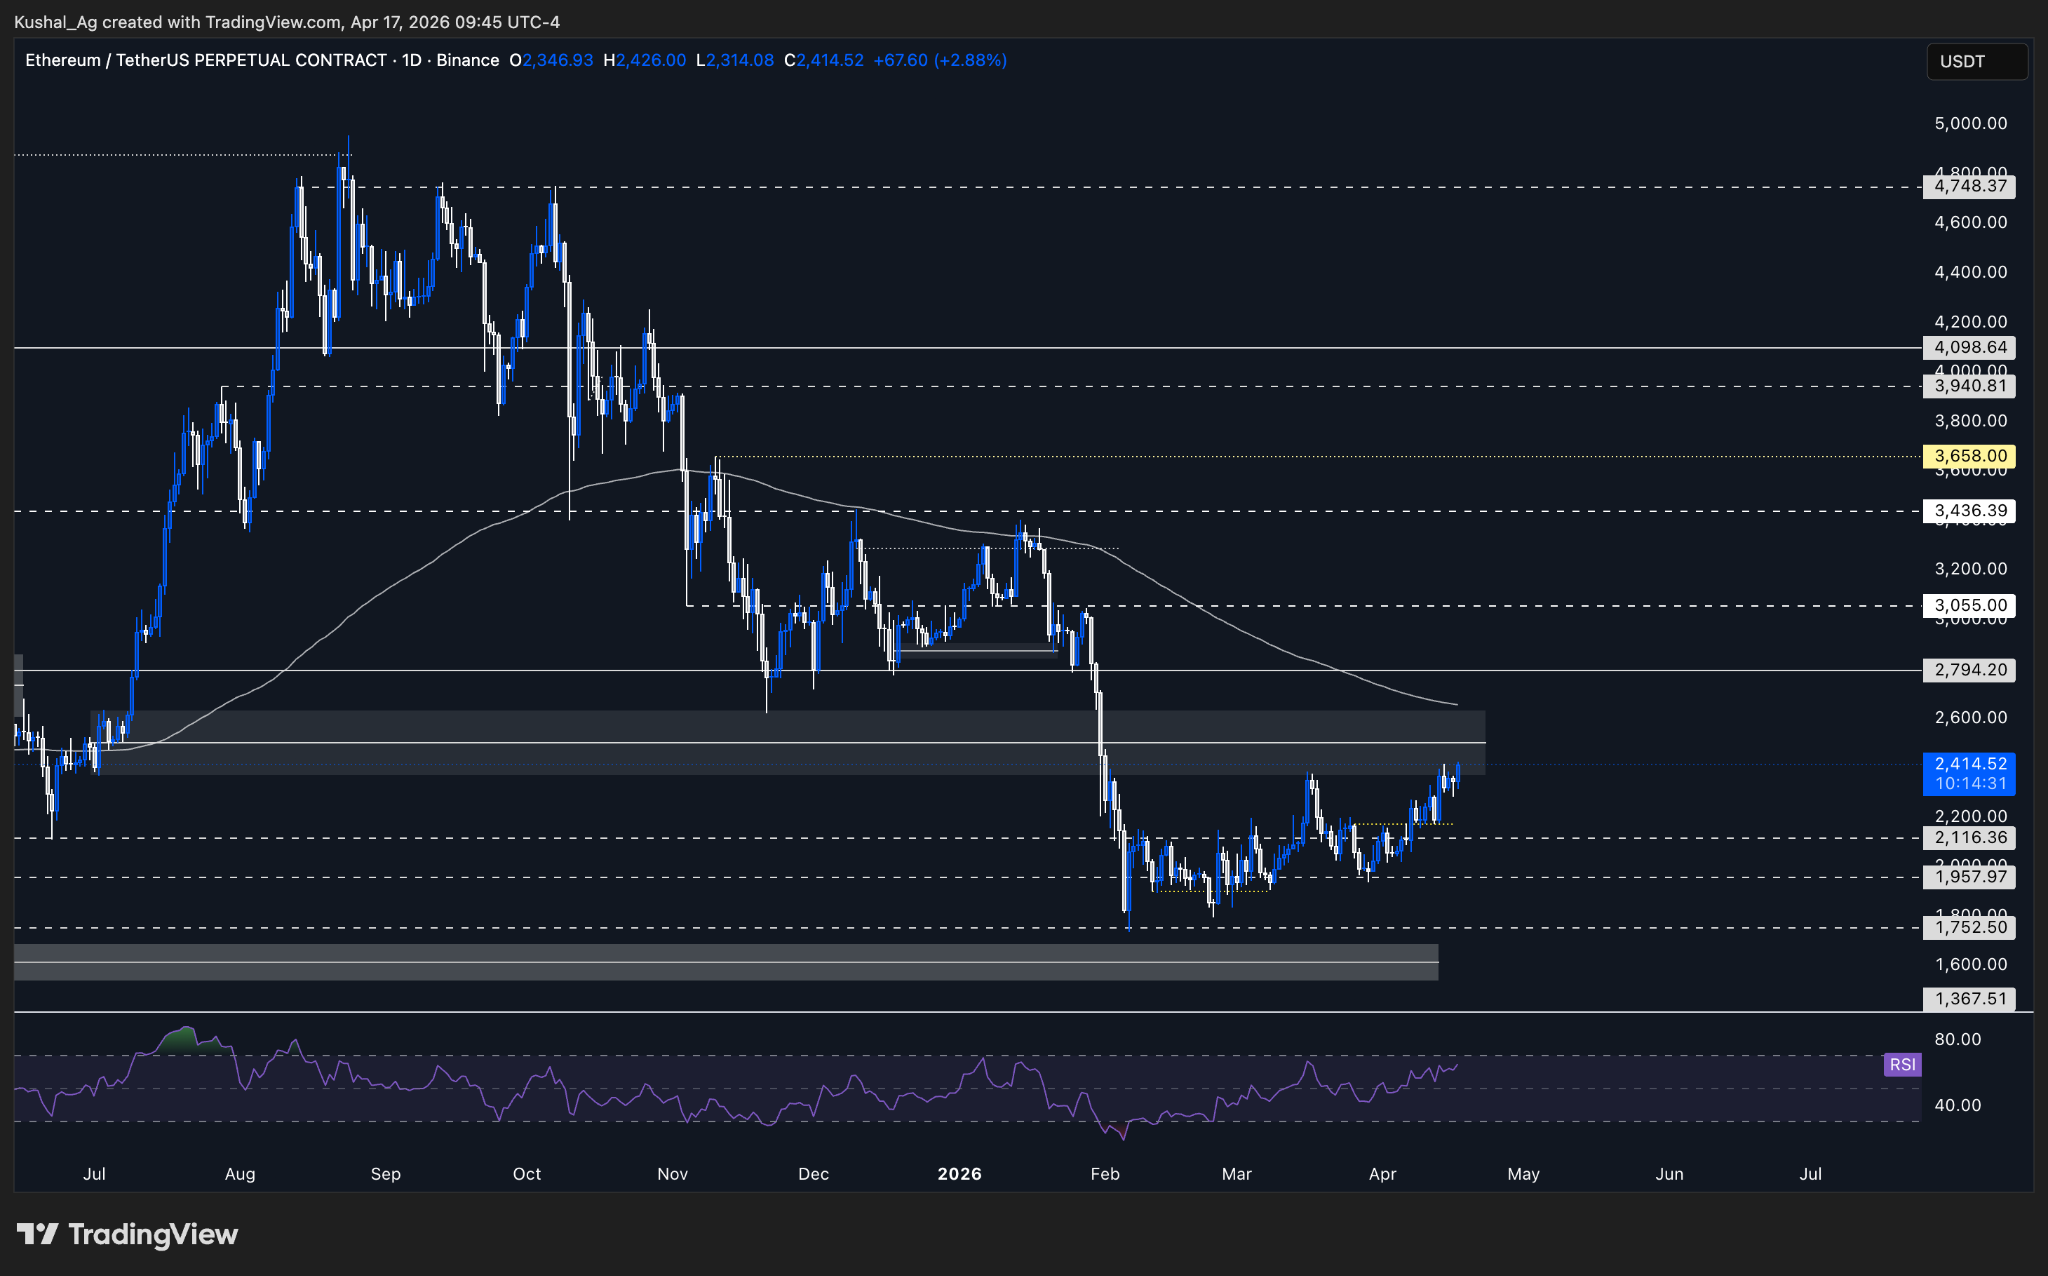
TASolana has now broken above the $87 resistance we were tracking and has successfully retested it as support, confirming the breakout in the short term. With this move, we are now pivoting from a neutral-bullish stance to a bullish stance as the structure shifts in favor of continuation.
Following the breakout, Solana is now moving into the $89 resistance, which is currently being tested. Price is actively battling this level, and a clean break above it would confirm continuation and open the next leg higher.
As long as $87 continues to hold, the base case remains for sustained upside, with $93.1 and $100 as the next key targets. This aligns with the broader expectation of an uptrend starting to materialize after the breakout.
On the downside, a loss of $87 would weaken the current structure and bring $80.89 and $78 back into focus as key support levels, which would make us reassess our immediate bullish outlook.
The 200 EMA continues to trend downward near $118.2, reflecting broader structure, while RSI is around 55, sitting above neutral and in a healthy position. Compared to Bitcoin and Ethereum, RSI still has more room to move higher, suggesting Solana could see relatively stronger upside if momentum sustains.
Key Levels:
- Support: $87
- Resistance: $89
- Direction: Bullish
- Upside Target: $93.1 & $100
- Downside Target: $80.89 & $78
Cryptonary’s Take:
Solana’s breakout above $87 is a meaningful shift in structure, especially with price successfully holding the retest. This shows acceptance above resistance, which changes the tone of the setup.With that, we’re now pivoting from a neutral-bullish stance to a bullish stance on Solana. The market is starting to reward strength here, and if this momentum sustains, Solana could start to lead on the upside given the room it still has compared to other majors.
The key now is continuation, a clean push through $89 would confirm that this breakout has legs and open the path toward the higher targets we’ve outlined.
Hyperliquid
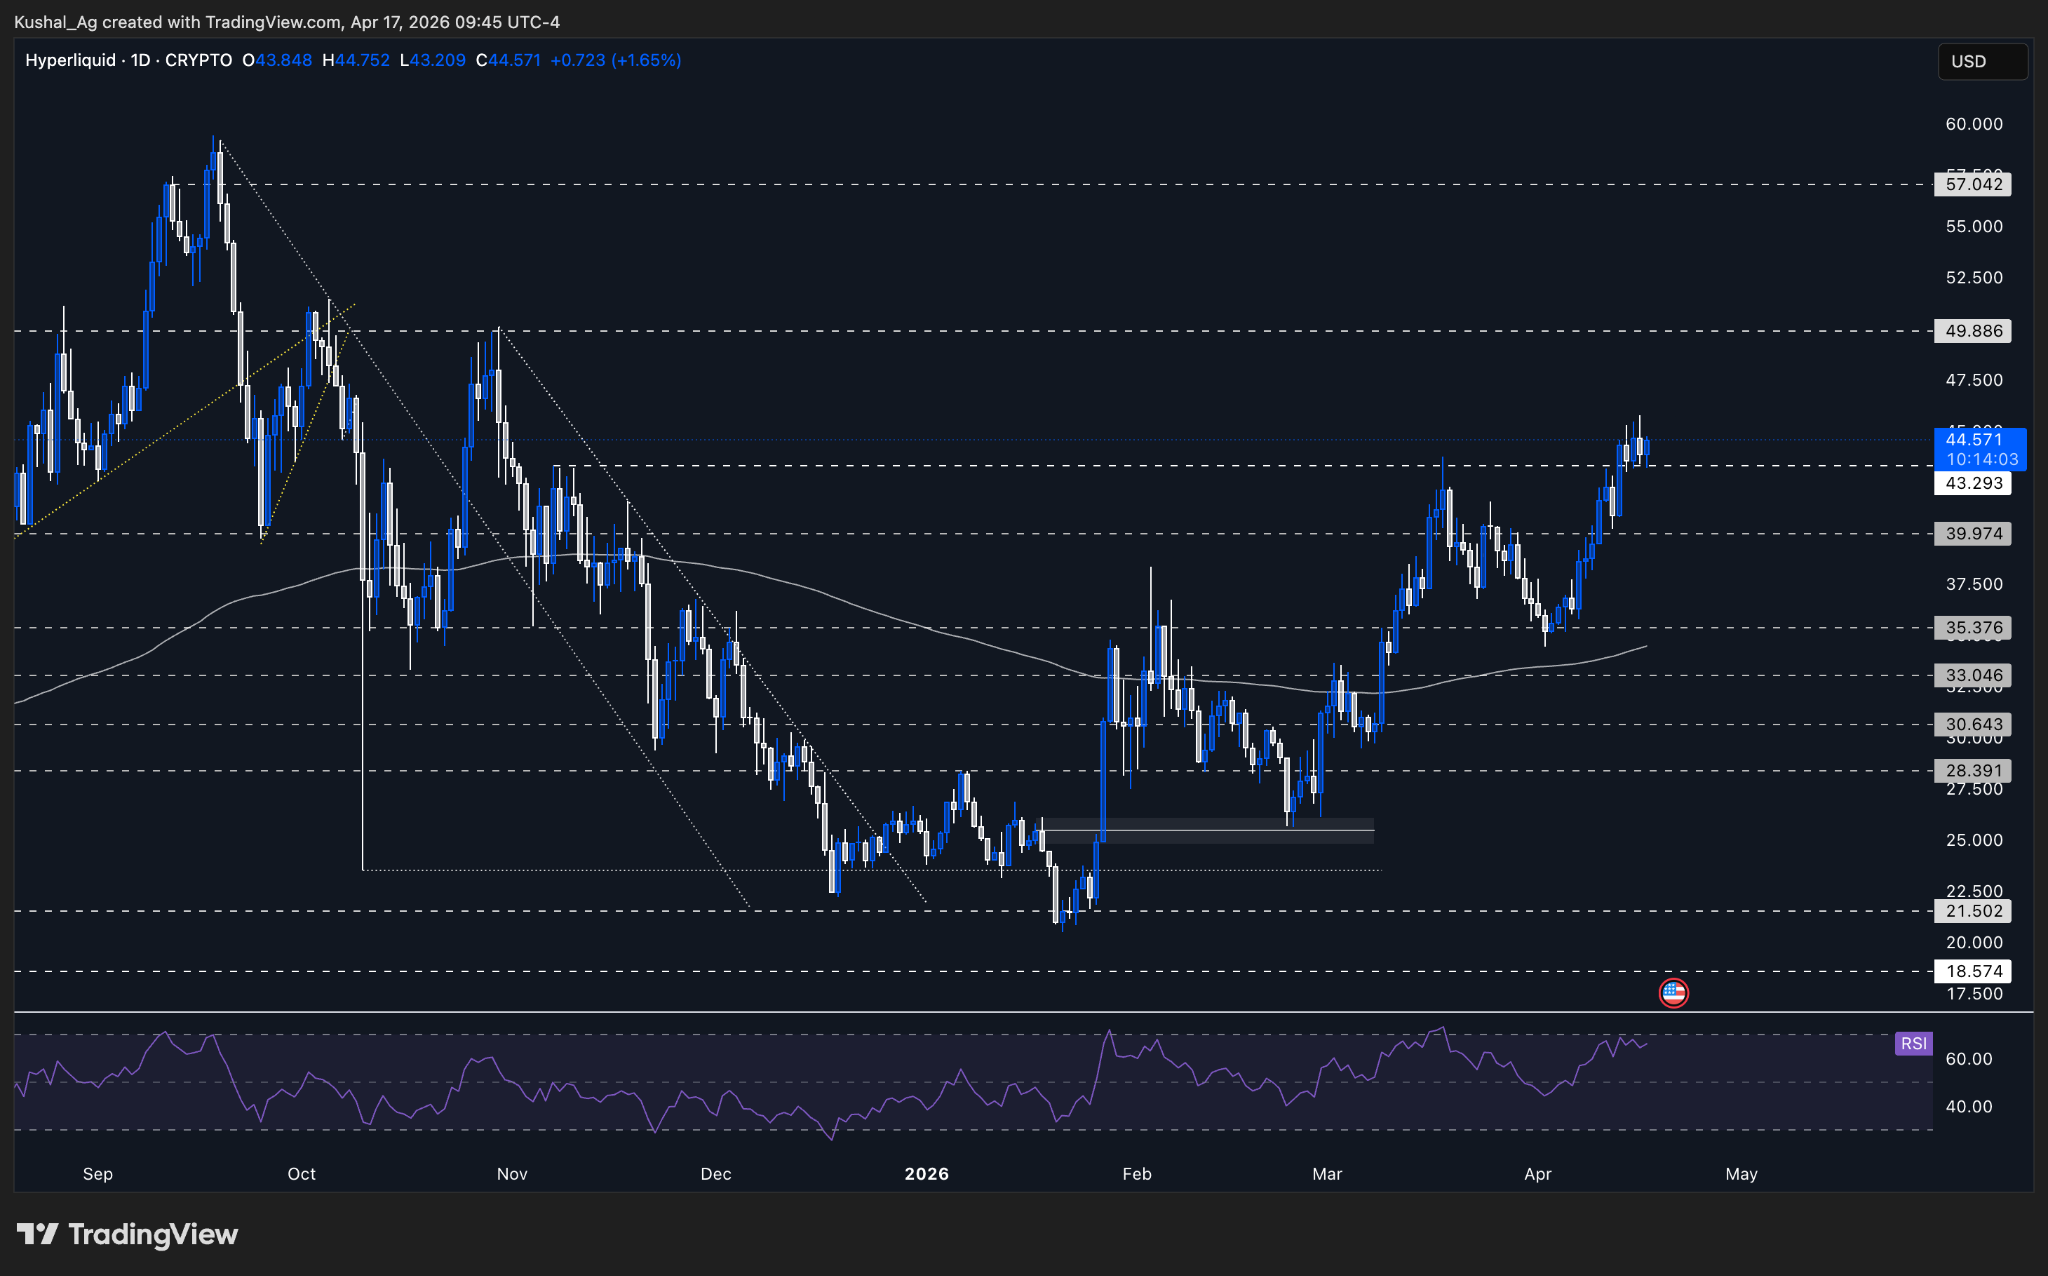
TAHyperliquid continues to hold its breakout structure after moving above the $43.29 level, which has now flipped from resistance into support. Price is currently attempting to build a base around this region, keeping the short-term structure intact.
As long as $43.29 continues to hold, the base case remains for continued upside, with $50 as the next key resistance and immediate upside target. A sustained move above this region would then open further upside toward $57.
Structurally, Hyperliquid remains one of the stronger assets in the market, with price trading well above its 200 EMA, highlighting relative strength compared to other majors.
On the downside, a loss of $43.29 would weaken the current structure and bring $39.97 back into focus as the next downside target.
The 200 EMA continues to trend upward near $34.48, sitting below price and supporting the bullish structure. RSI is around 65, approaching elevated levels, which suggests there is still some room for continuation, but a further push higher could bring RSI closer to overbought conditions, requiring caution.
Key Levels:
- Support: $43.29
- Resistance: $50
- Direction: Neutral-Bullish
- Upside Target: $50 & $57
- Downside Target: $39.97
Cryptonary’s Take:
Hyperliquid continues to show strong relative performance, holding its breakout level and building a base above support. The structure remains clearly constructive in the short term.As long as price holds above $43.29, continuation toward $50 remains the base case, with further upside possible if momentum sustains. The stance remains neutral-bullish, with a constructive outlook but some caution as RSI approaches higher levels.
Aura
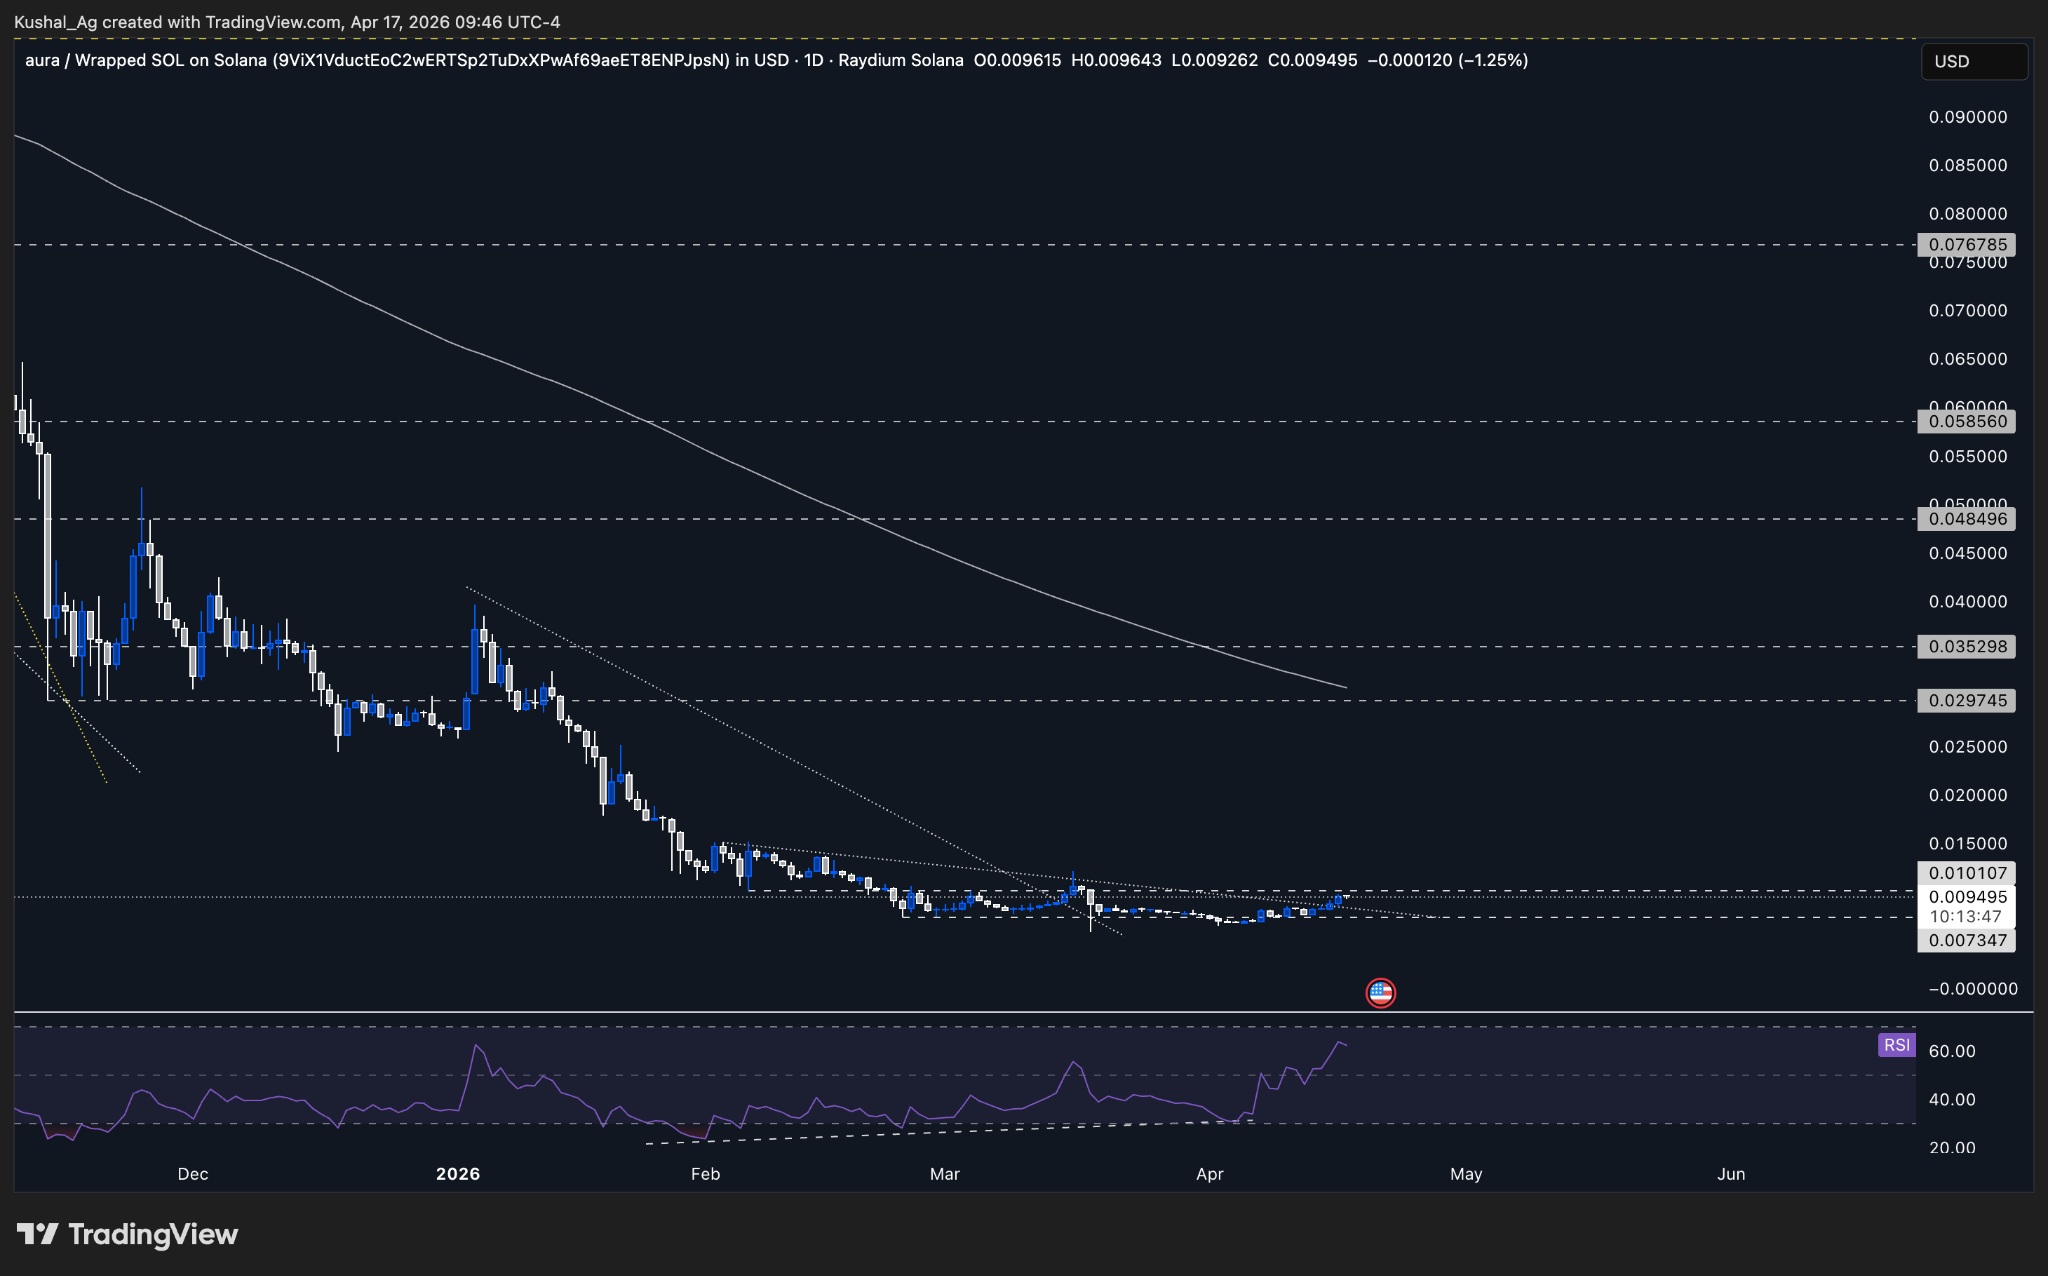
TAAura continues to trade within its broader range, but momentum has clearly improved compared to previous sessions. While price has not yet broken out, the underlying strength is gradually building.
This is reflected in RSI, which has now climbed to around 60, moving into a stronger zone and indicating improving momentum. The shift from weak to constructive momentum is a key development to watch here.
At the same time, the setup remains highly dependent on Solana. With SOL starting to break out and showing signs of strength, higher beta assets like Aura could begin to react more aggressively if this move sustains.
The 200 EMA on the daily at $0.031 continues to trend on the downside keeping border structure a bit weak still for now.
Chart: Aura Daily Structure
Cryptonary’s Take:
Aura is showing early signs of improvement, with momentum picking up even as price remains range-bound. The key driver from here will be Solana, if SOL continues its breakout, Aura is likely to follow and potentially outperform given its higher beta nature. The setup is constructive but still developing.
Total Market Cap
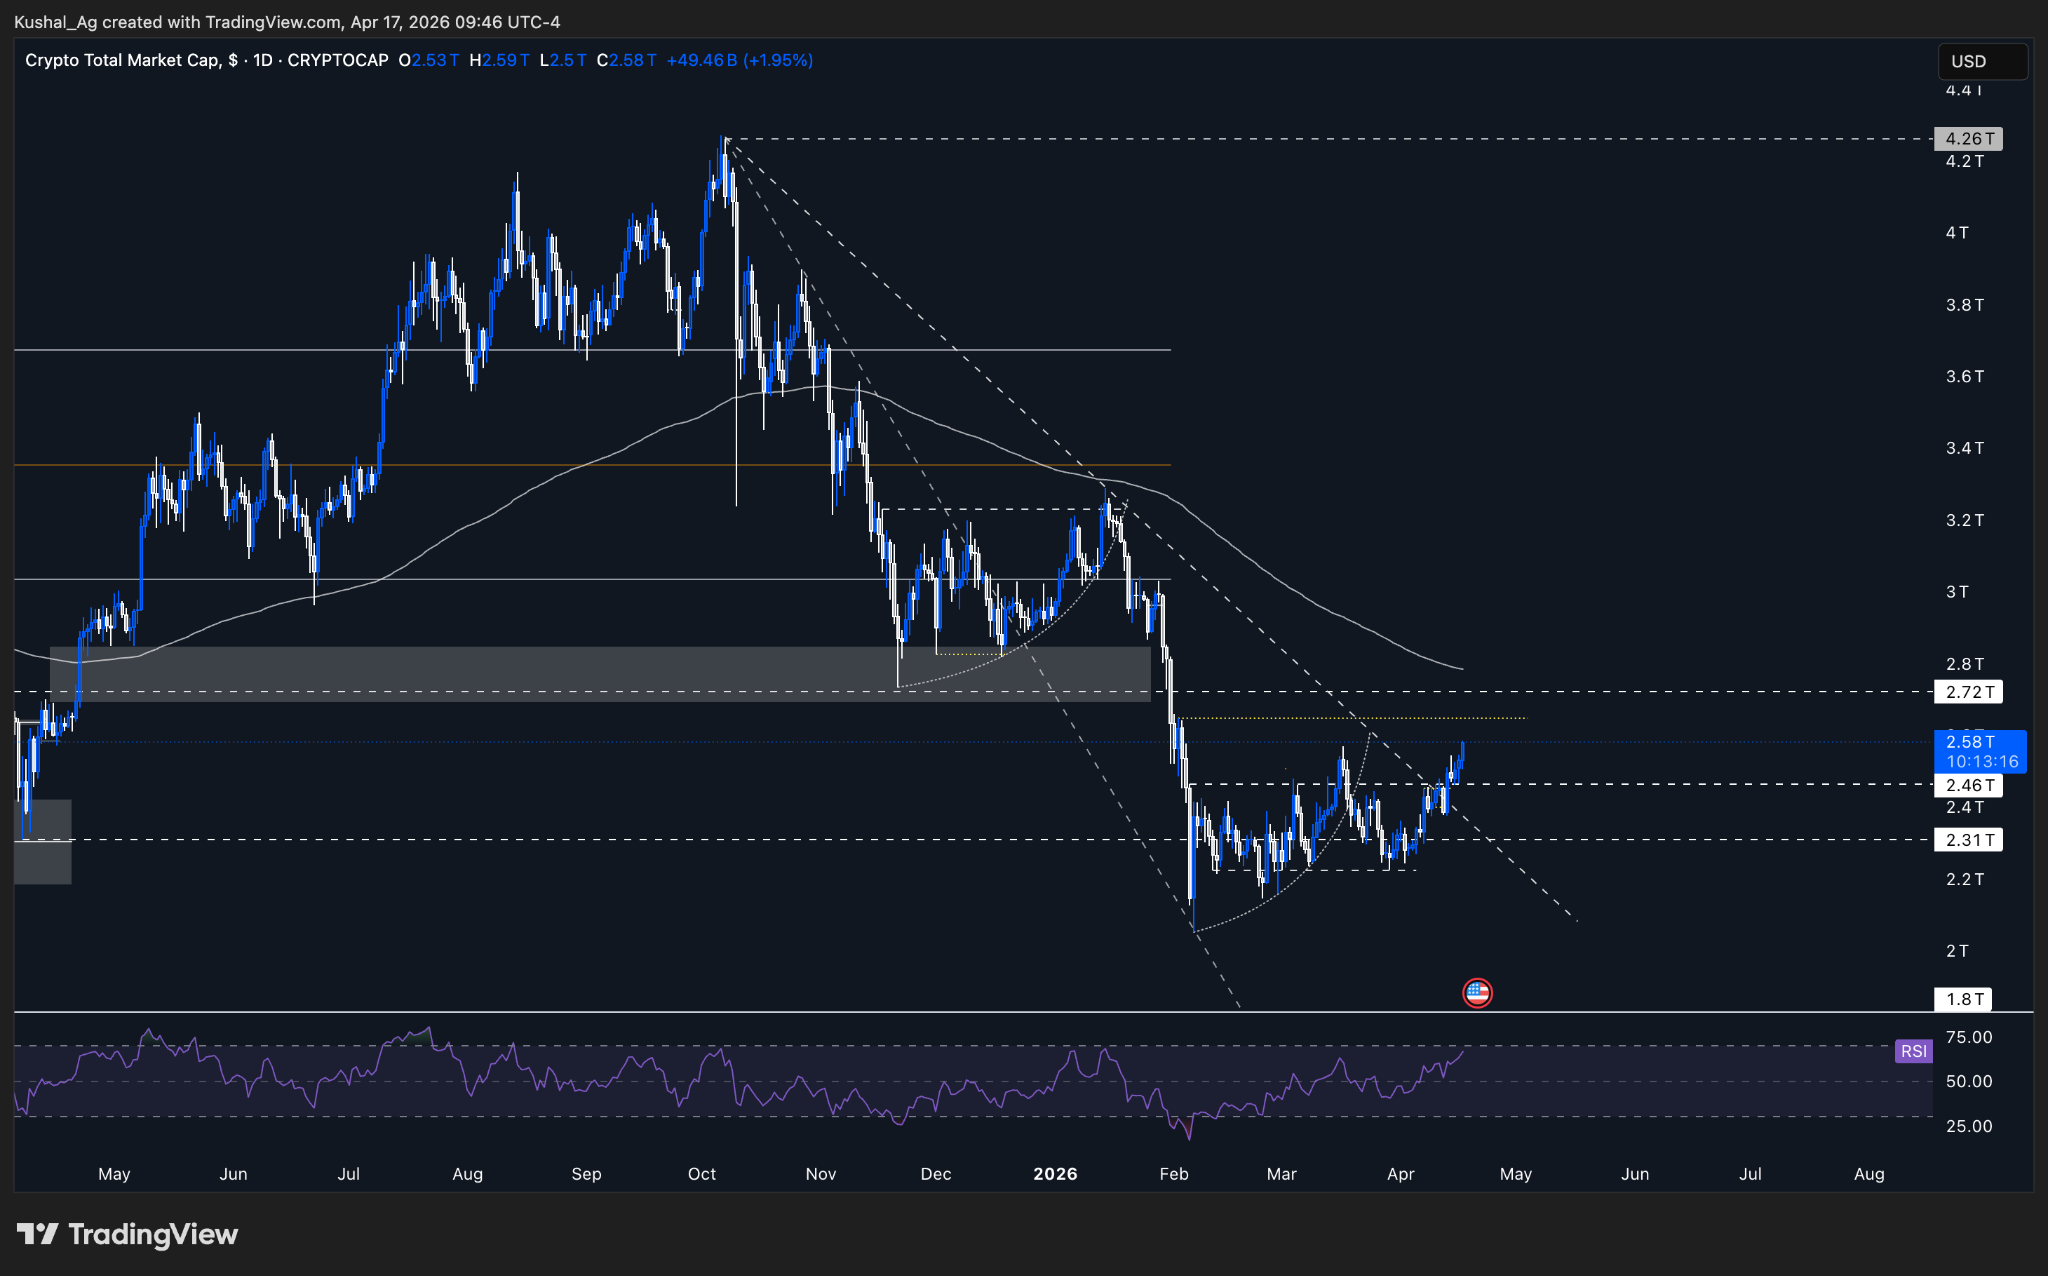
TATotal market cap has now broken above the $2.46T level, which was the key breakout zone we were tracking, and this move has materialized cleanly with price now holding above it.
This breakout also coincides with a break above the long-term downtrend trendline in place since October 2025, marking a shift in the broader market structure toward a more constructive setup.
Price is now trading around $2.56T and continuing to build above the breakout region, suggesting strength and increasing the probability of further upside continuation in the short term.
As long as the $2.46T region continues to hold as support, the base case remains for a move toward $2.65T and $2.72T, with further extension possible toward the $2.78T-$2.79T region where the 200 EMA is positioned.
The 200 EMA is around $2.78T, aligning with the higher upside region, while RSI is near 65, approaching elevated levels. This supports current strength, but a further push higher could bring RSI into overbought territory, which is something to watch for in terms of short-term exhaustion.
Chart: Total Market Cap Daily Structure
Cryptonary’s Take:
Total market cap has confirmed the breakout we were waiting for, with both horizontal resistance and the long-term downtrend now cleared. This shifts the broader market structure into a more constructive phase.As long as price continues to hold above the breakout region, the bias remains to the upside, with higher levels likely to be tested. However, with RSI approaching elevated levels, the move may not be linear, and some consolidation or short-term pullbacks could occur along the way.
Closing Thoughts
The market continues to hold a constructive structure, with more than half of the required confirmations already in place across majors. As long as key support regions continue to hold, the base case remains for continued upside across the board.That said, with multiple assets pushing higher, some majors may start approaching overbought conditions in the coming sessions if the rally continues. This calls for a degree of caution in the short term, but does not invalidate the broader setup.
Overall, the market continues to show strength, and the base case remains for continued upside as long as current structure holds.
Continue reading by joining Cryptonary Pro
$1,548 $997/year
Get everything you need to actively manage your portfolio and stay ahead. Ideal for investors seeking regular guidance and access to tools that help make informed decisions.
For your security, all orders are processed on a secured server.
As a Cryptonary Pro subscriber, you also get:
24/7 access to experts with 50+ years’ experience Terms
All of our top token picks for 2025
On hand technical analysis on any token of your choice
Weekly livestreams & ask us anything with the team
Daily insights on Macro, Mechanics, and On-chain
Curated list of top upcoming airdrops (free money)
Our track record speaks for itself
With over 2.4M tokens and widespread misinformation in crypto, we cut through the noise and consistently find winning assets.
Our track record speaks for itself
With over 2.4M tokens and widespread misinformation in crypto, we cut
through the noise and consistently find winning assets.


Frequently Asked Questions
Can I trust Cryptonary's calls?
Yes. We've consistently identified winners across multiple cycles. Bitcoin under $1,000, Ethereum under $70, Solana under $10, WIF from $0.003 to $5, PopCat from $0.004 to $2, SPX blasting past $1.70, and our latest pick has already 200X'd since June 2025. Everything is timestamped and public record.
Do I need to be an experienced trader or investor to benefit?
No. When we founded Cryptonary in 2017 the market was new to everyone. We intentionally created content that was easy to understand and actionable. That foundational principle is the crux of Cryptonary. Taking complex ideas and opportunities and presenting them in a way a 10 year old could understand.
What makes Cryptonary different from free crypto content on YouTube or Twitter?
Signal vs noise. We filter out 99.9% of garbage projects, provide data backed analysis, and have a proven track record of finding winners. Not to mention since Cryptonary's inception in 2017 we have never taken investment, sponsorship or partnership. Compare this to pretty much everyone else, no track record, and a long list of partnerships that cloud judgements.
Why is there no trial or refund policy?
We share highly sensitive, time-critical research. Once it's out, it can't be "returned." That's why membership is annual only. Crypto success takes time and commitment. If someone is not willing to invest 12 months into their future, there is no place for them at Cryptonary.
Do I get direct access to the Cryptonary team?
Yes. You will have 24/7 to the team that bought you BTC at $1,000, ETH at $70, and SOL at $10. Through our community chats, live Q&As, and member only channels, you can ask questions and interact directly with the team. Our team has over 50 years of combined experience which you can tap into every single day.
How often is content updated?
Daily. We provide real-time updates, weekly reports, emergency alerts, and live Q&As when the markets move fast. In crypto, the market moves fast, in Cryptonary, we move faster.
Recommended from Cryptonary