Save 23% ($351) & Get a Free 1-1 Call with our Team ⏰ : 0d 2h 59m 44s
BTC, ETH and More: Crypto Structure Diverges, Bitcoin Remains Fragile
Over the past week, downside played out where expected, but follow-through has been inconsistent, with macro-driven volatility interrupting otherwise clean technical setups. As a result, we’re now seeing a more fragmented market, where strength and weakness are diverging across assets rather than moving in sync. In this report, we reassess the current positioning across the assets on our watchlist while factoring in the ongoing macro uncertainty that continues to drive short-term price action. Let’s break it down...

Disclaimer: This is not financial or investment advice. You are responsible for any capital-related decisions you make, and only you are accountable for the results.
Quick bridge from last week…
Last week, we held a neutral-bearish bias on Bitcoin and Hyperliquid, with a neutral stance on Ethereum and Solana. Since then, Bitcoin did deliver the expected downside continuation, although the move was relatively short-lived due to news-driven volatility. Price briefly reacted higher following de-escalation headlines, but continues to struggle around the $70,500 region, keeping the structure fragile.Ethereum and Solana both initially followed Bitcoin lower, but importantly, both have reclaimed their key support levels, showing relative strength in the current environment. Hyperliquid has formed a clear sell order block on the higher timeframe, while short-term price action suggests a potential pullback into supply before any continuation lower, leading us to reassess positioning across assets.
On the macro front, markets remain highly reactive to ongoing Middle East developments, with rapid shifts between risk-on and risk-off driven by headlines around potential de-escalation. At the same time, tightening financial conditions and uncertainty around Fed policy continue to create an unsupportive backdrop for risk assets. We’ve covered these dynamics, along with Bitcoin’s positioning and broader implications, in detail in yesterday’s “This Week’s Setup” report.
Disclaimer: This content is for informational and educational purposes only. It does not constitute financial advice, and should not be relied upon as a basis for making investment decisions. Virtual assets are volatile and may lose their value in full. Past performance does not indicate future results. Always do your own research.
TLDR
- Risk Posture: Defensive
- Bitcoin: BTC remains below $70,500, keeping structure weak. The stance is neutral-bearish, with downside toward $65,650-$62,400 unless price reclaims and holds above $70,500.
- Ethereum: ETH is holding $2,116 support and showing relative strength. The stance is neutral-bullish (short-term), with upside toward $2,367-$2,500 while $2,166 holds, breakdown opens $1,957.
- Solana: SOL is stabilizing at $89 support after a deviation. The stance is neutral, with sideways likely unless $89 breaks toward $80.9, while $93.2 reclaim opens $100.
- Hyperliquid: HYPE is pushing into a sell order block. The stance is neutral, with rejection likely leading back toward $35-$33, while acceptance delays downside.
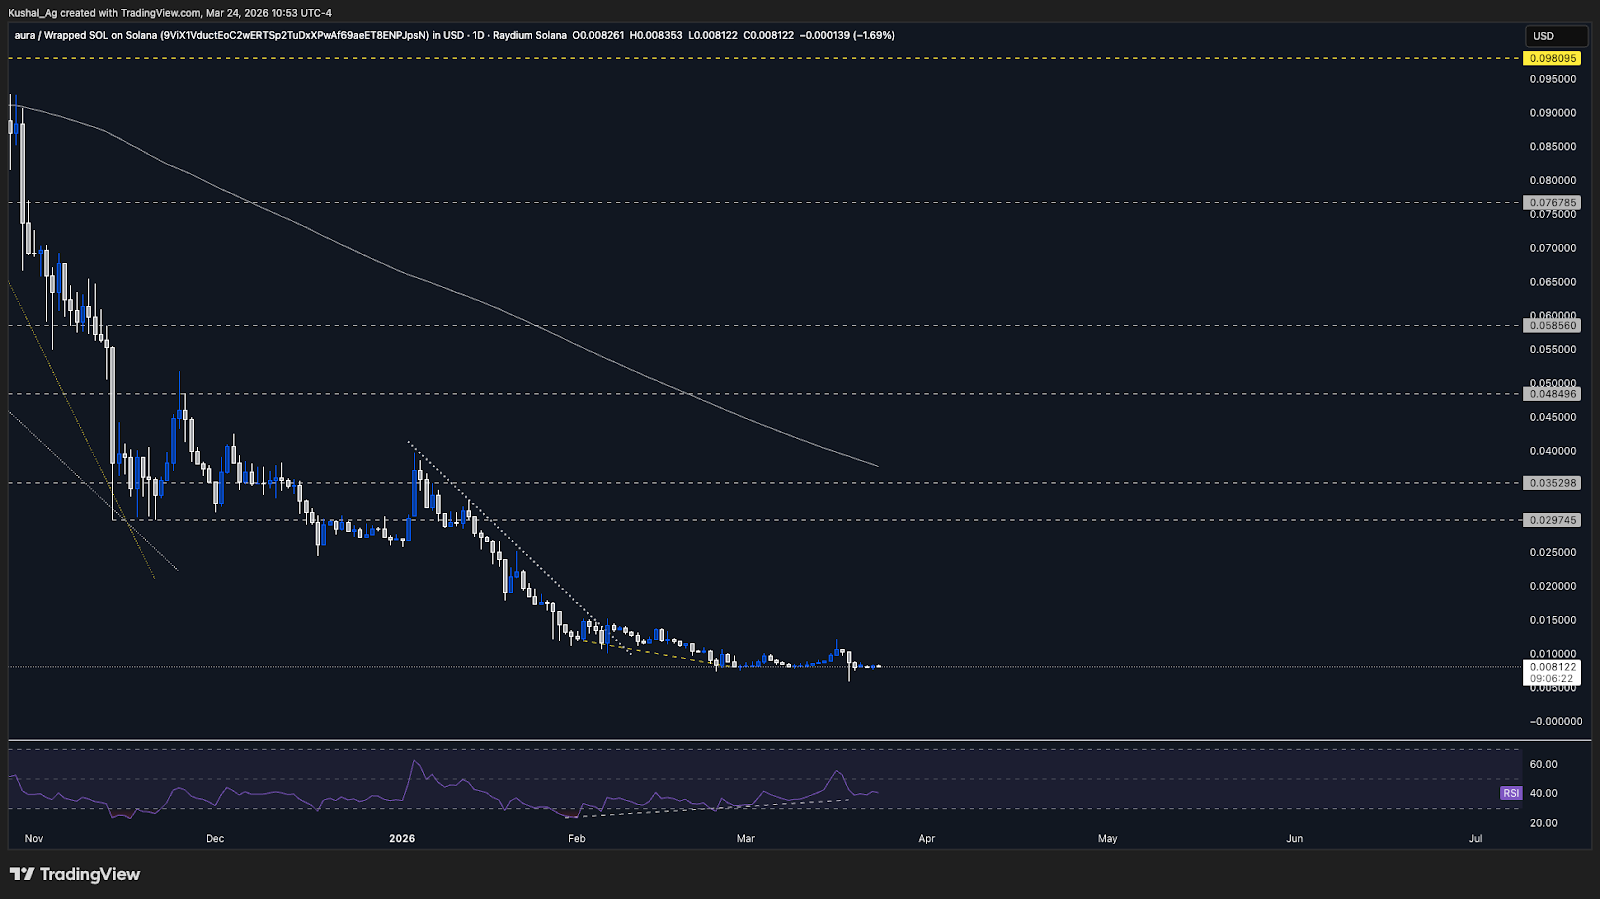
- Aura: AURA remains range-bound with weak momentum, with continuation dependent on strength in Solana.
Bitcoin
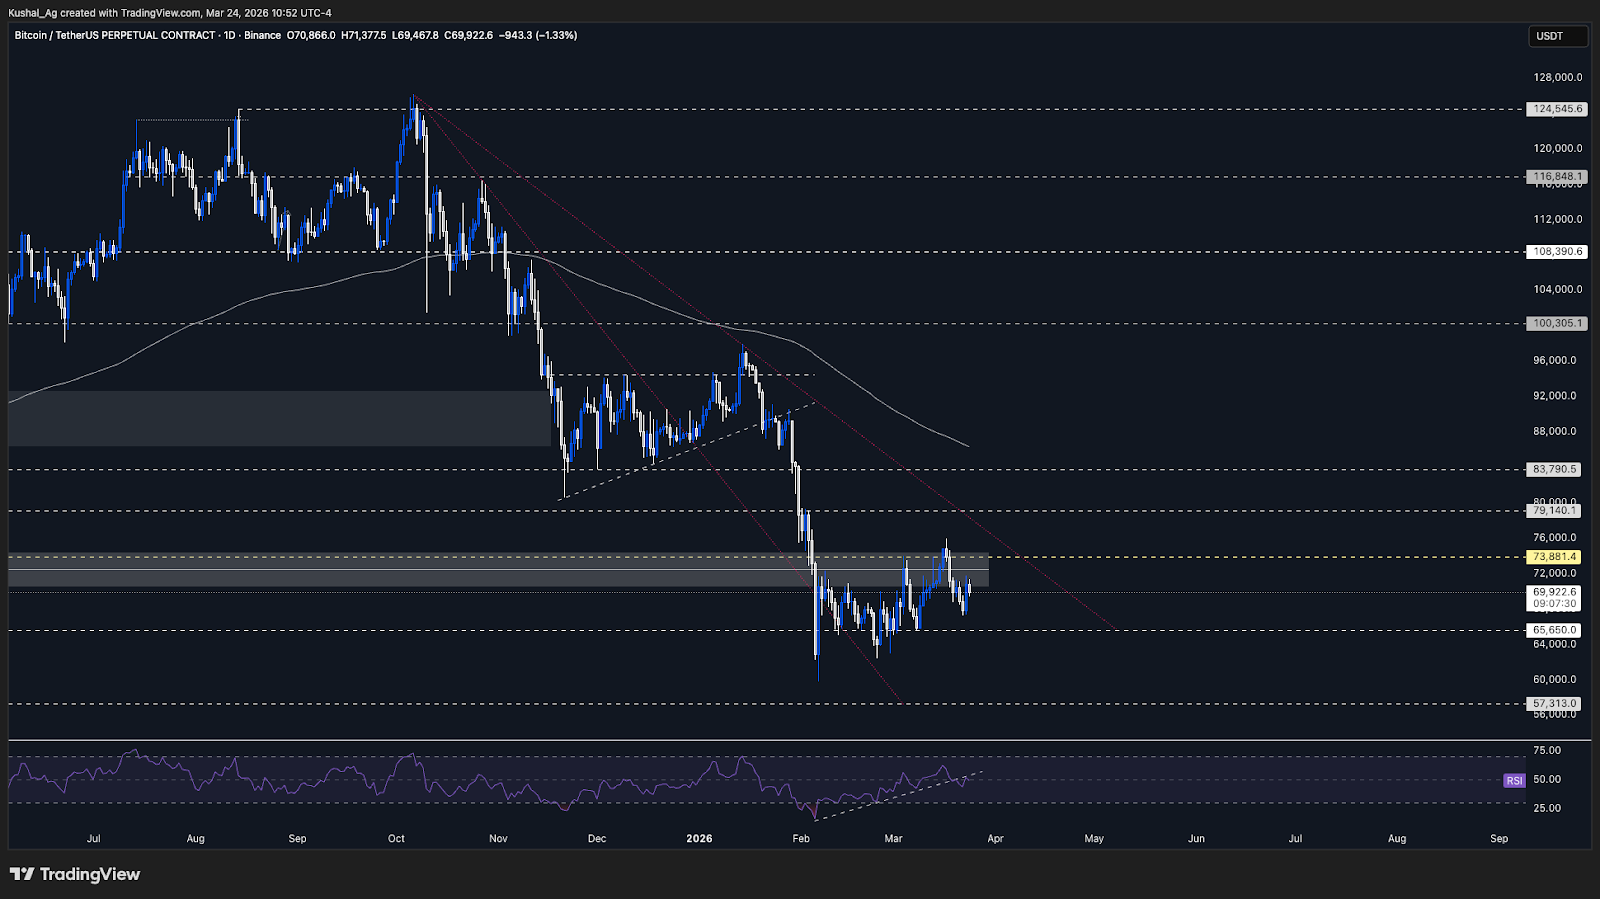
TASince the previous analysis, Bitcoin followed through on the downside after losing the $70,500 level, taking rejection from that region and moving lower to form a local swing low around $67,300. The move lower aligned well with the bearish structure we were tracking.
However, downside continuation did not materialize fully, the bounce from the lows was driven largely by external factors, with news around de-escalation in the Israel-Iran conflict pushing price back to the upside. This has led to Bitcoin moving back toward the $70,500 region, where price has now been chopping for the past couple of sessions.
Despite this bounce, $70,500 continues to act as resistance, as price has not been able to properly reclaim and hold above it. As long as price remains below this level, the structure still leans toward continued downside pressure, keeping the broader bias intact.
On the downside, $65,650 remains the key support and primary downside target, with a further move toward $62,400 possible if this level is lost. On the upside, a clean and sustained reclaim of $70,500 for at least a couple of sessions would be required to shift momentum and reassess the current stance.
The 200 EMA continues to slope downward near $86,400, reflecting broader weakness, while RSI is hovering around 51, indicating neutral momentum but no strong bullish confirmation.
Key Levels:
- Support: $65,650
- Resistance: $70,500
- Direction: Neutral-Bearish
- Upside Target: $73,800 & $79,140
- Downside Target: $65,650 & $62,400
Cryptonary’s Take:
Bitcoin remains in a choppy, indecisive structure, but the broader setup still leans slightly bearish as long as $70,500 remains unclaimed. The recent bounce lacks strong internal momentum and appears more reactive than structural.RSI has broken below its prior uptrend, the possibility of which we had already mentioned in the previous MD and is now retesting that breakdown, which aligns closely with price retesting resistance. If the RSI retest and rolls over again, it would likely confirm further downside, with price moving back toward $65,650 or lower.
For now, the stance remains neutral-bearish, with the market sitting at a fairly indecisive position right now. A clean reclaim and hold above $70,500 would invalidate the current view, but until that happens, the bias remains tilted toward further downside continuation.
Ethereum
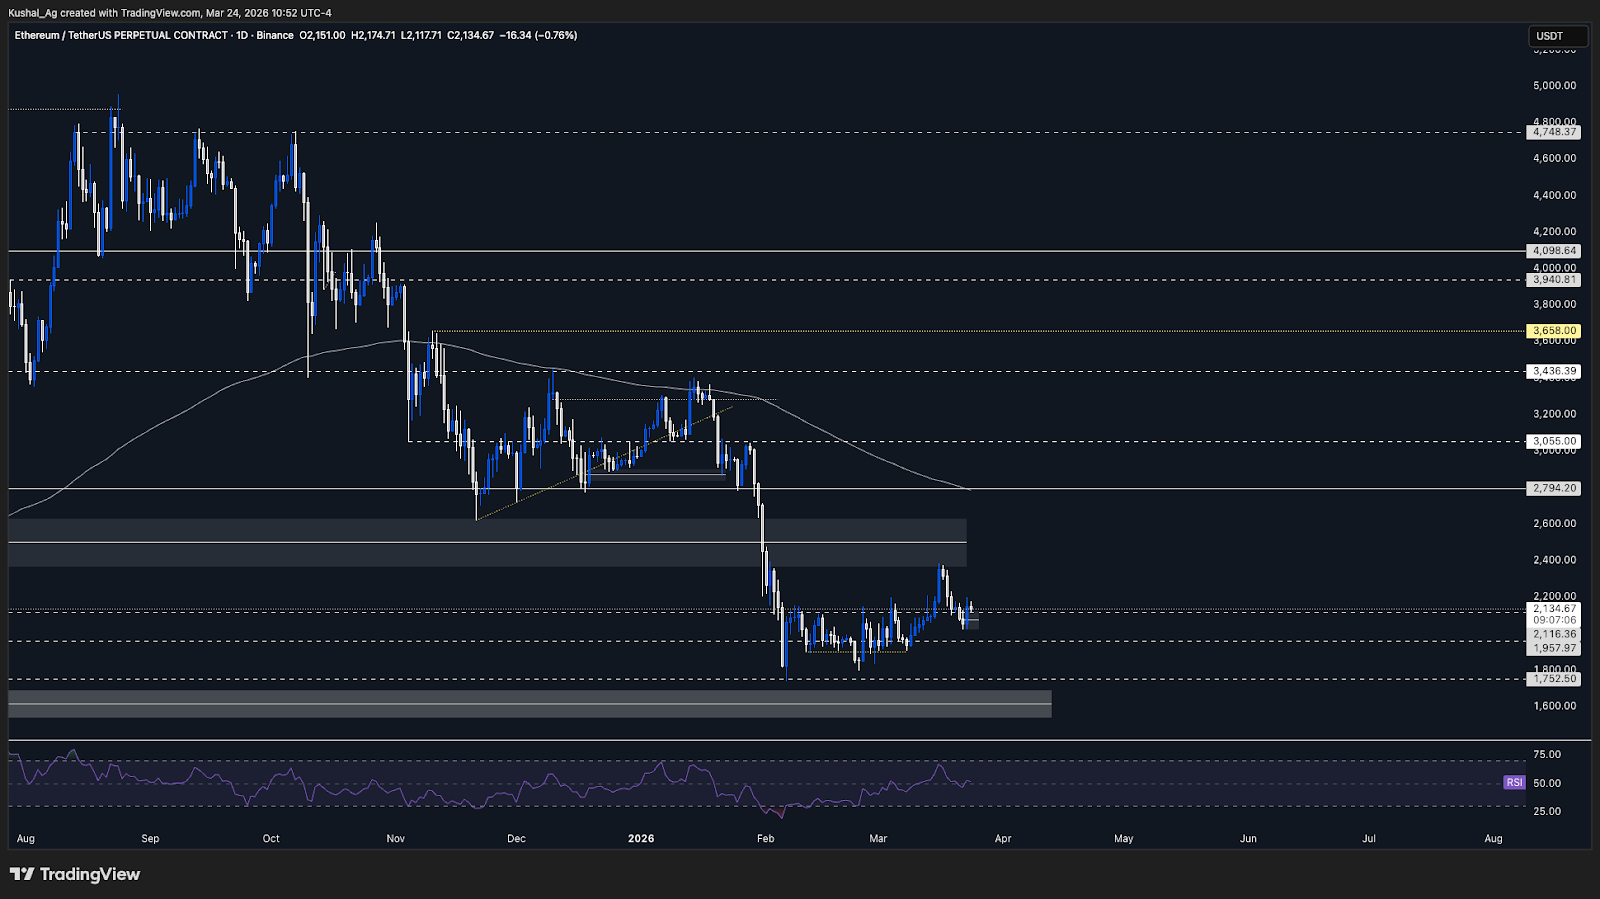
TAIn the previous analysis, we highlighted $2,116 as the key support, and despite a brief breakdown driven by Bitcoin’s weakness, Ethereum has reclaimed this level quickly, showing relative strength. Price only spent a couple of sessions below support before moving back above it, indicating buyers are still defending this region.
Currently, $2,116 continues to hold as support, and this is the key level defining structure. As long as price remains above it, Ethereum maintains a constructive setup, especially compared to Bitcoin, which is still struggling at resistance.
Given this strength, we pivot to a neutral-bullish stance, as Ethereum shows the potential to push toward the $2,367 resistance. However, this is still within a broader range, and not an upside breakout structure yet.
On the downside, a loss of $2,116 would invalidate this view and shift the structure back toward weakness, opening downside toward $1,957. On the upside, continuation toward $2,367 and potentially $2,500 remains on the table if current support continues to hold.
The 200 EMA is hovering around $2,786, still sloping slightly downward, while RSI is around 51.7, indicating neutral momentum but with room for upside.
Key Levels:
- Support: $2,116
- Resistance: $2,367
- Direction: Neutral-Bullish (short-term)
- Upside Target: $2,367 & $2,500
- Downside Target: $1,957
Cryptonary’s Take:
Ethereum is showing relative strength compared to Bitcoin, holding its key support while BTC struggles below resistance. This divergence is further supported by the ETH/BTC ratio, which held the 0.029-0.03 region, broke higher, and is now taking support at 0.03, suggesting continued relative outperformance.If the ETH/BTC ratio continues to hold and push higher toward 0.0318-0.032, Ethereum could outperform Bitcoin in the short term, allowing for a push toward the $2,300-$2,400 region. This justifies the current neutral-bullish stance, even in a slightly weaker broader market.
However, this remains a range-bound move unless resistance is broken, and the entire structure and the neutral-bullish bias is dependent on $2,116 holding. A sustained daily candle close below that would quickly shift momentum back to the downside and we will reassess our current stance.
Solana
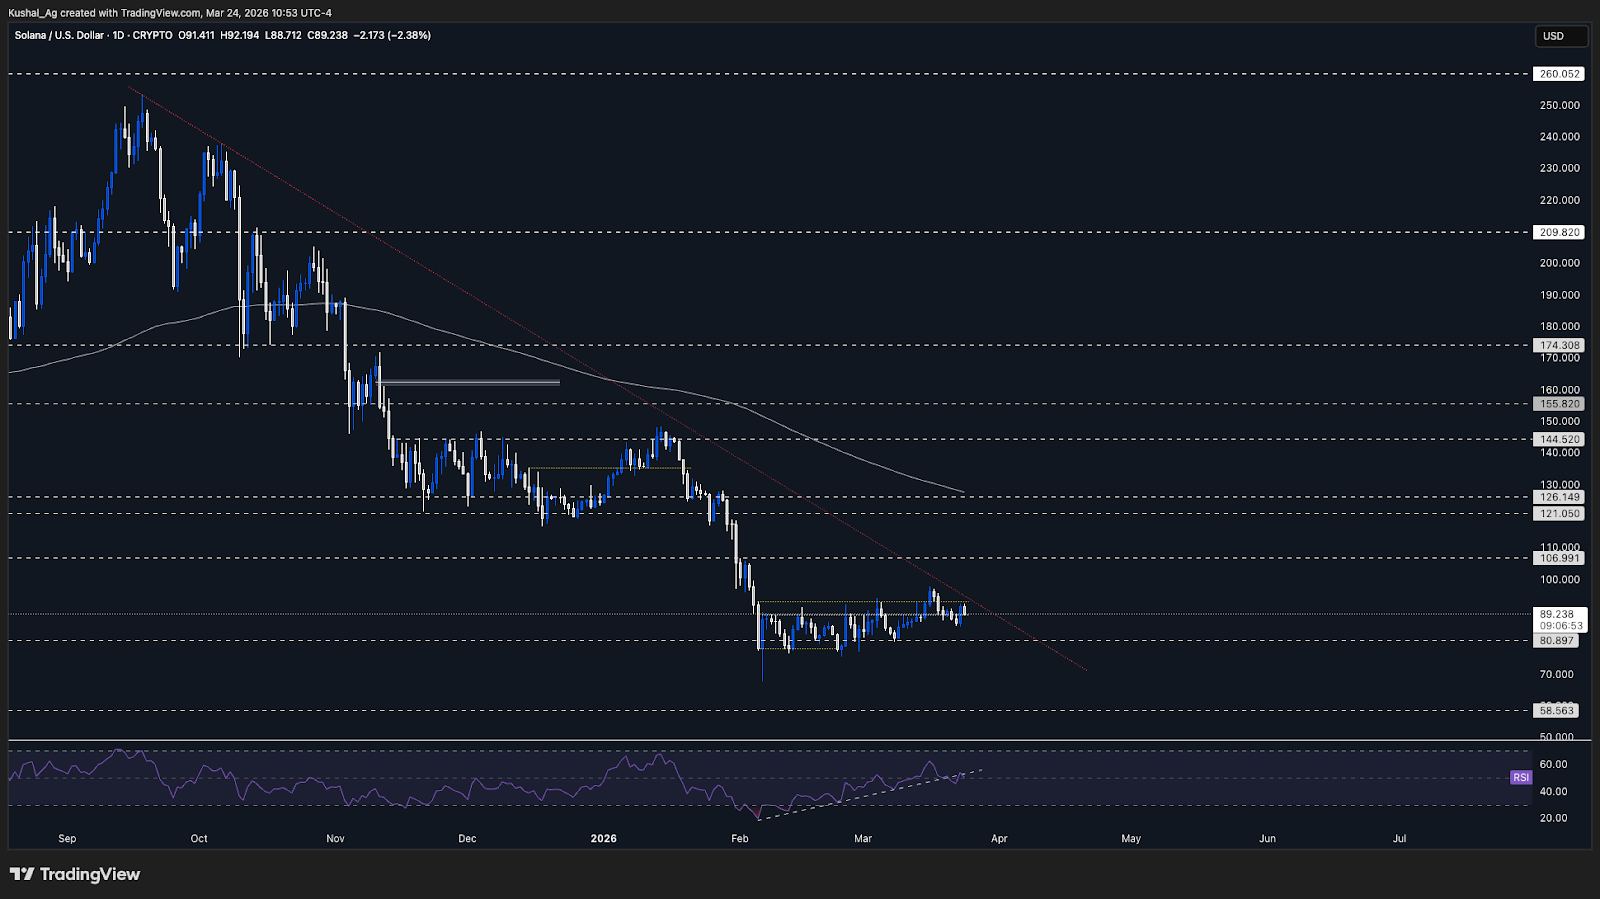
TAWe were previously focused on the $89 support region for Solana, and similar to Ethereum, Solana briefly deviated below its support during Bitcoin’s breakdown, but has since reclaimed and is now holding above it. This shows relative stability in structure despite broader market weakness.
Currently, $89 remains the key support, while $93.2 acts as immediate resistance. As long as price continues to hold above support, Solana is likely to remain range-bound, with no clear directional confirmation yet.
Given this, the stance remains neutral, as it is not ideal to turn bearish at support or bullish below resistance. A clean break below $89 would shift the structure lower, opening downside toward $80.9, while holding this level keeps consolidation in play.
On the upside, a confirmed breakout above $93.2 would be required to shift momentum and potentially move toward the $100 region in the short to medium term. Until then, price is expected to chop within the range.
The 200 EMA is hovering around $127.6, still trending downward, while RSI is around 52, reflecting neutral momentum with no strong directional bias yet.
Key Levels:
- Support: $89
- Resistance: $93.2
- Direction: Neutral
- Upside Target: $100
- Downside Target: $80.9
Cryptonary’s Take:
Solana is currently showing relative strength, holding support despite broader market weakness. However, the structure remains range-bound, and confirmation is still required before any directional stance can be taken.RSI has broken its prior uptrend and is now retesting that breakdown, similar to Bitcoin but with less weakness. This retest becomes key, if RSI fails to hold here and rolls over, it would likely lead to further downside in price. However, if RSI manages to reclaim the trendline, it could support continued consolidation or a short-term bounce.
For now, as long as $89 holds, the expectation remains for sideways price action, with a breakout on either side required for the next meaningful move.
Hyperliquid
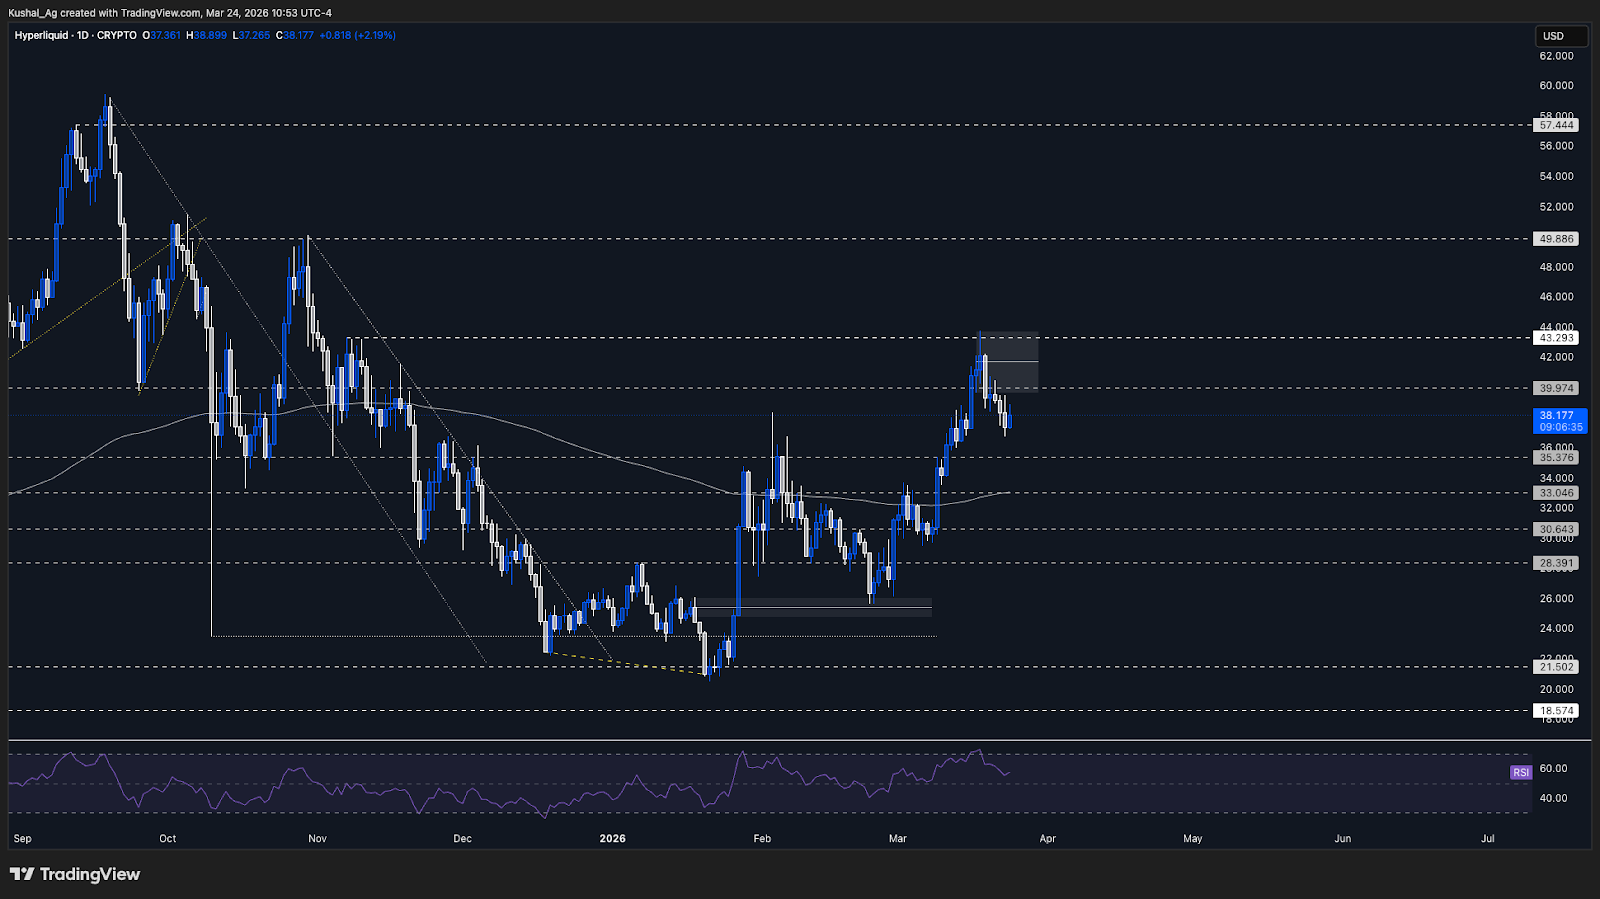
TAHyperliquid has formed a clear daily sell order block, from $39.65 to $43.74, with the midpoint around $41.7. This zone becomes the key area to watch, as it represents a region where supply could re-enter the market.
In the short term, price is likely to pull back into this order block, which justifies a shift in stance from neutral-bearish to neutral. This is not a structural shift yet, but rather an expectation of a retest of supply before the next move.
The initial resistance comes in around $39.65-$39.97, which aligns with the lower bound of the order block. A move above this could see price extend toward the $41.7 midpoint, followed by the broader resistance zone around $43.2-$43.7.
However, this entire region remains a sell zone, and if price shows rejection or weakness upon entry, we would expect a continuation to the downside, shifting the stance back toward neutral-bearish or bearish upon confirmation in price.
On the downside, $35.37 acts as support, with a further move toward $33 likely if weakness resumes. The 200 EMA sits near $33, adding confluence to this downside target. RSI has cooled to around 59 (from overheated levels), allowing room for a short-term move higher before any potential rejection.
Key Levels:
- Support: $35.37
- Resistance: $39.65-$39.97
- Direction: Neutral
- Upside Target: $41.7 & $ 43.2
- Downside Target: $33
Cryptonary’s Take:
Hyperliquid is sitting at a point where the immediate downside momentum has paused, but the broader structure still leans corrective. The formation of the daily sell order block suggests that any short-term upside is likely a retest of supply.The key focus now is how price behaves within the $39.65-$43.7 zone. A clear rejection from this region would reinforce the bearish structure and likely lead to a move back toward $35 & $33. Until that confirmation appears, maintaining a neutral stance is appropriate while waiting for the next directional signal.
Aura
TAPrice continues to consolidate within the same range, with no meaningful structural changes yet, indicating continued sideways price action.
Momentum is still weak, with RSI around 42, showing only a slight recovery but no strong directional push.
The 200 EMA continues to slope downward near 0.037, reflecting broader weakness, while price remains dependent on external strength, particularly from Solana, for any meaningful move.
AURA/USD Chart:
Cryptonary’s Take:
AURA remains in a low-momentum consolidation phase, with no independent strength visible yet. The asset continues to track broader ecosystem moves, and a meaningful upside move is likely if/when Solana shows sustained strength. Until then, the expectation remains for sideways, choppy price action.Closing Thoughts
We maintain our neutral-bearish stance on Bitcoin, as price continues to struggle below key resistance and structure remains weak unless $70,500 is reclaimed.On the other hand, we’ve pivoted to a neutral-bullish stance on Ethereum (short-term), as $2,116 continues to hold firmly, supported by strength in the ETH/BTC ratio, which suggests potential short-term outperformance. The formation of a daily buy order block on ETH, contrasted with the daily sell order block on Hyperliquid, highlights the divergence in current market structure across assets.
Given this, we are placing greater emphasis on asset-specific setups rather than a Bitcoin-led view, as the market, especially majors, are not moving very uniformly as of now. While this mixed positioning is not typical, it reflects the current conditions, and we will continue to reassess dynamically as price action evolves.
Continue reading by joining Cryptonary Pro
$1,548 $1,197/year
Get everything you need to actively manage your portfolio and stay ahead. Ideal for investors seeking regular guidance and access to tools that help make informed decisions.
For your security, all orders are processed on a secured server.
As a Cryptonary Pro subscriber, you also get:
3X Value Guarantee - If cumulative documented upside does not reach 300% during your 12-month membership, you can request a full refund. Terms
24/7 access to experts with 50+ years’ experience
All of our top token picks for 2025
On hand technical analysis on any token of your choice
Weekly livestreams & ask us anything with the team
Daily insights on Macro, Mechanics, and On-chain
Curated list of top upcoming airdrops (free money)
3X Value Guarantee
If cumulative documented upside does not reach 300% during your 12-month membership, you can request a full refund.
Our track record speaks for itself
With over 2.4M tokens and widespread misinformation in crypto, we cut through the noise and consistently find winning assets.
Our track record speaks for itself
With over 2.4M tokens and widespread misinformation in crypto, we cut
through the noise and consistently find winning assets.


Frequently Asked Questions
Can I trust Cryptonary's calls?
Yes. We've consistently identified winners across multiple cycles. Bitcoin under $1,000, Ethereum under $70, Solana under $10, WIF from $0.003 to $5, PopCat from $0.004 to $2, SPX blasting past $1.70, and our latest pick has already 200X'd since June 2025. Everything is timestamped and public record.
Do I need to be an experienced trader or investor to benefit?
No. When we founded Cryptonary in 2017 the market was new to everyone. We intentionally created content that was easy to understand and actionable. That foundational principle is the crux of Cryptonary. Taking complex ideas and opportunities and presenting them in a way a 10 year old could understand.
What makes Cryptonary different from free crypto content on YouTube or Twitter?
Signal vs noise. We filter out 99.9% of garbage projects, provide data backed analysis, and have a proven track record of finding winners. Not to mention since Cryptonary's inception in 2017 we have never taken investment, sponsorship or partnership. Compare this to pretty much everyone else, no track record, and a long list of partnerships that cloud judgements.
Why is there no trial or refund policy?
We share highly sensitive, time-critical research. Once it's out, it can't be "returned." That's why membership is annual only. Crypto success takes time and commitment. If someone is not willing to invest 12 months into their future, there is no place for them at Cryptonary.
Do I get direct access to the Cryptonary team?
Yes. You will have 24/7 to the team that bought you BTC at $1,000, ETH at $70, and SOL at $10. Through our community chats, live Q&As, and member only channels, you can ask questions and interact directly with the team. Our team has over 50 years of combined experience which you can tap into every single day.
How often is content updated?
Daily. We provide real-time updates, weekly reports, emergency alerts, and live Q&As when the markets move fast. In crypto, the market moves fast, in Cryptonary, we move faster.
How does the 3X Value Guarantee work?
We stand behind the value of our research. If the documented upside from our published research during your 12-month membership does not exceed three times (3X) the annual subscription cost, you can request a full refund. Historical context: In every completed market cycle since 2017, cumulative documented upside has exceeded 10X this threshold.
TermsRecommended from Cryptonary


