Save 23% ($351) & Get a Free 1-1 Call with our Team ⏰ : 0d 2h 59m 43s
Market Direction

Disclaimer: This analysis is for informational purposes only and not financial advice.
TLDR:
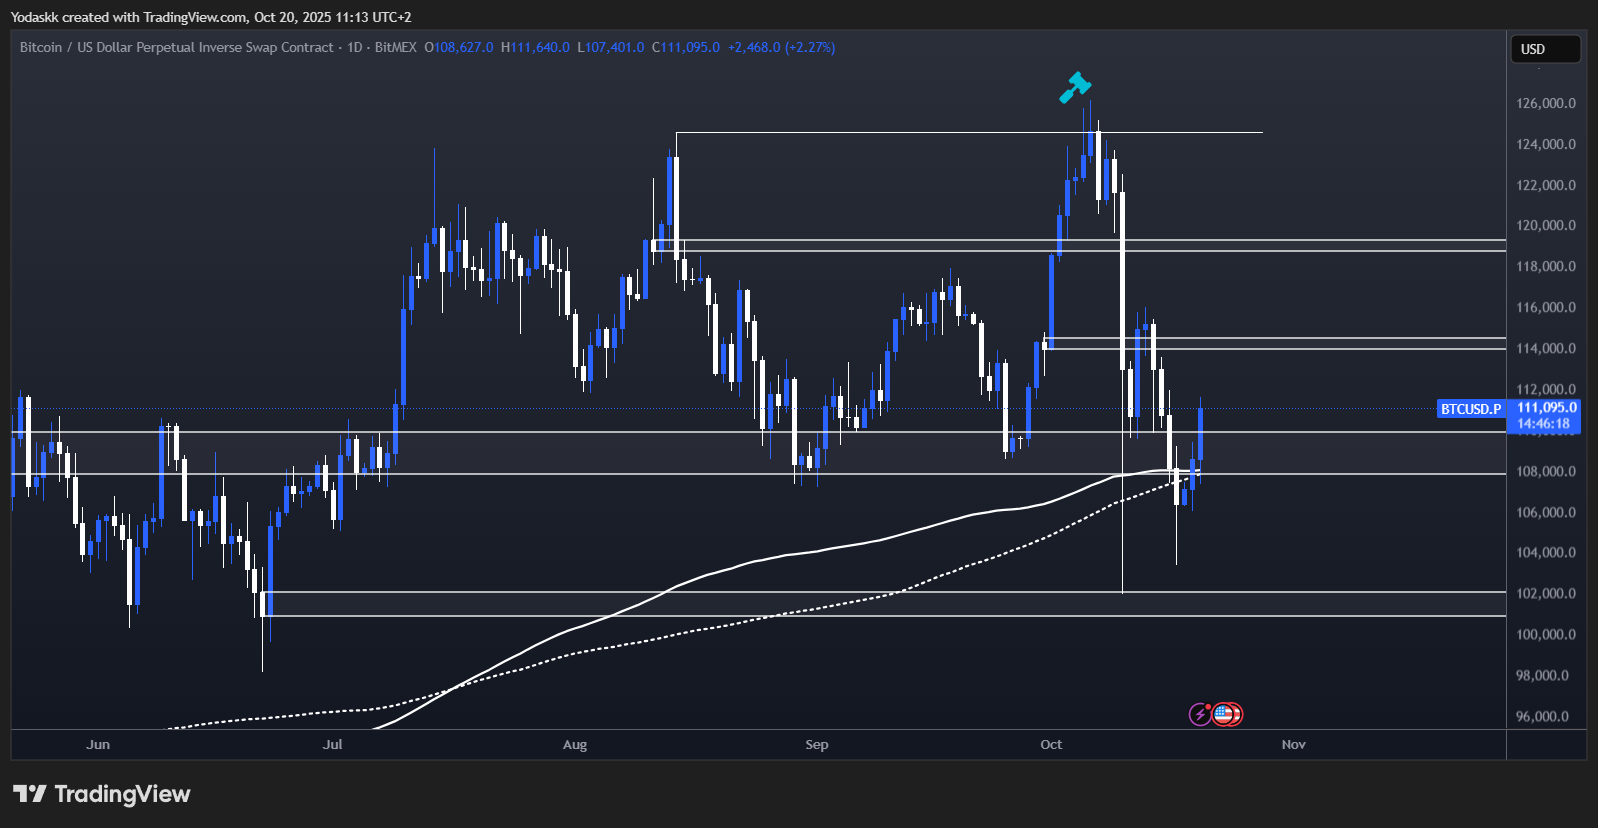
- BTC: False breakdown below $108k, needs to hold $108k-$110k to remain bullish. Eyes on $114k, $119k next. Breakdown below $107k targets $102k.
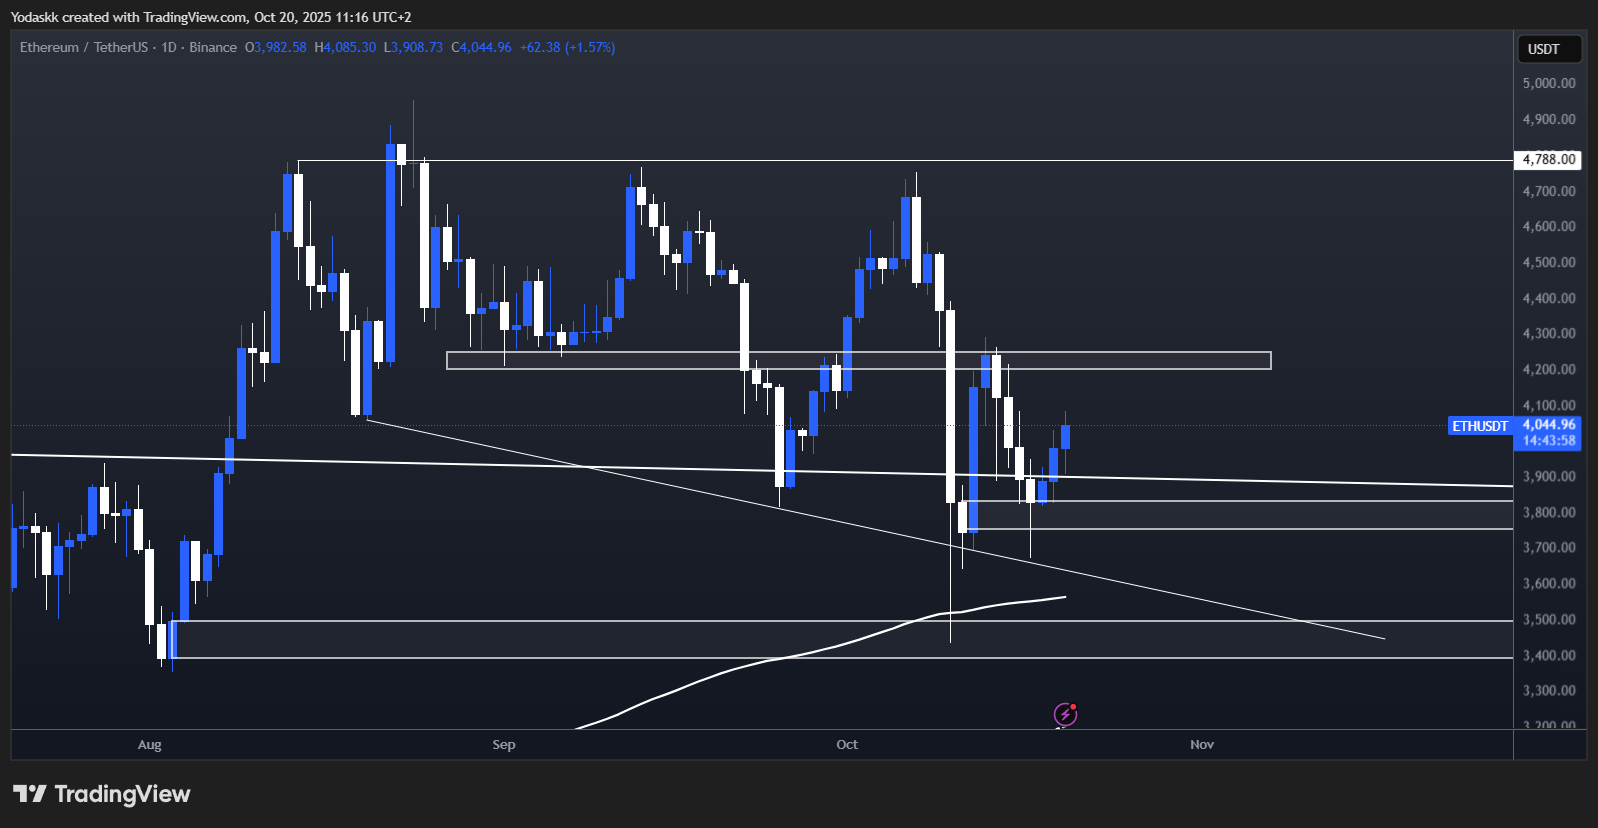
- ETH: Bounce from $3,750, resistance at $4,060, next aim $4,250. Loss of $3,700 opens $3,400-$3,500 test.
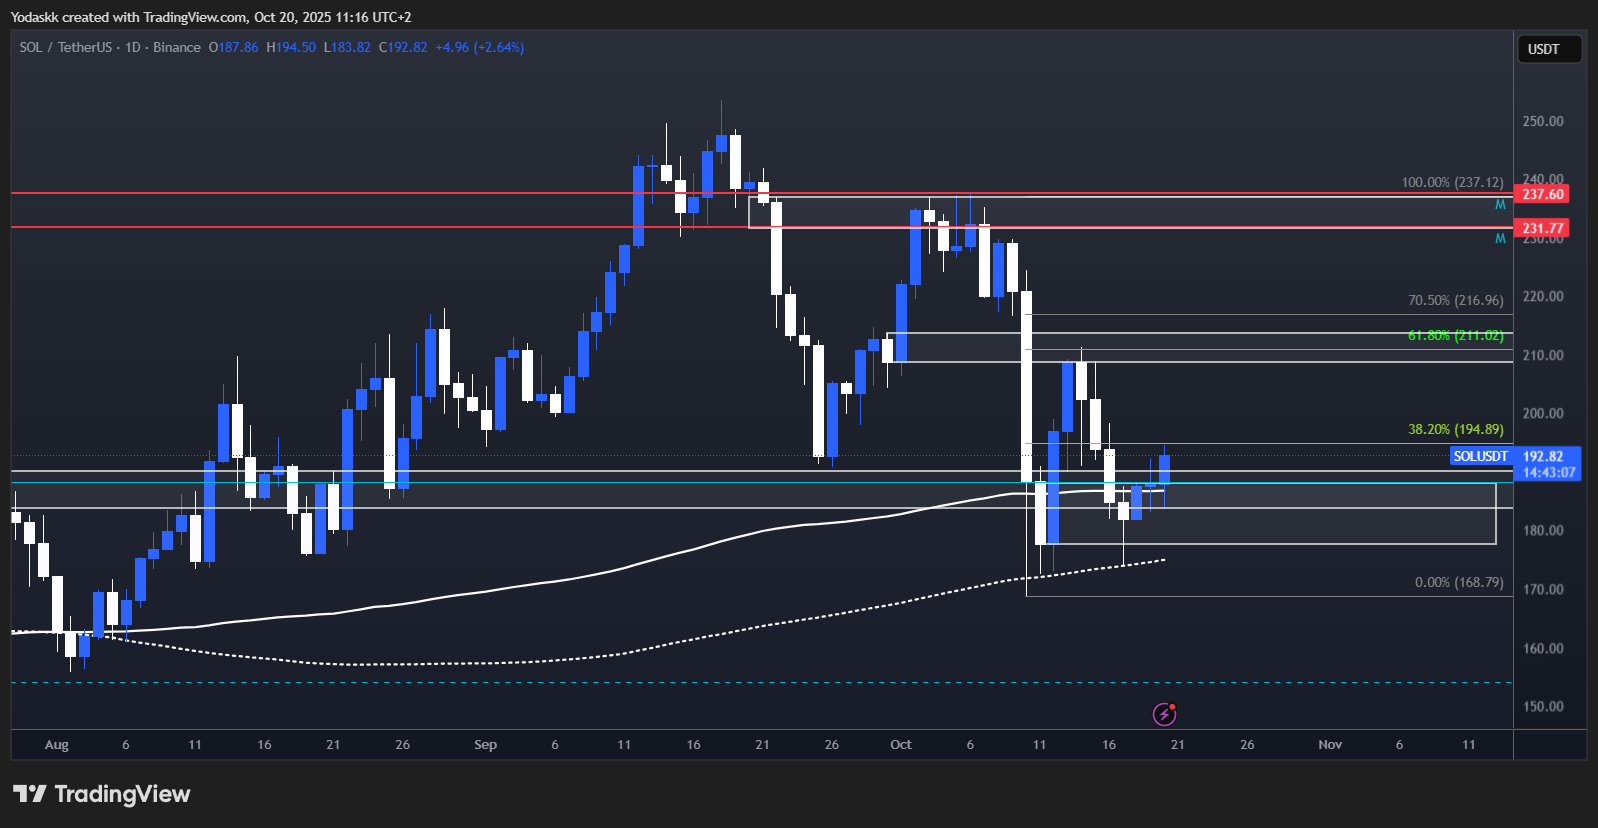
- SOL: Double bottom in play above $178; $213 breakout could open $237+. Breakdown below $175 turns focus to $155-$120.
- HYPE: Potential double bottom, weaker bounce. Next upside $43-$44, breakdown below $35.5 could revisit $32 or $28.
- AURA: Rangebound $0.065–$0.1, grinding higher. Reclaiming $0.1 and 200-day signals jump to $0.15, breakdown below $0.05 brings dip-buyers.
BTC:
- Price Range: $108,000 – $124,000
- Bias: Neutral to Bullish
- Resistance and Key Level to Reclaim: $114,000 - $115,000
- Support Zone: $108,000 – $110,000
- Breakdown Trigger: $107,000 – $108,000
If $108k-$110k is lost, we would target $102k. If it breaks below $98k-$100k, things get a bit riskier, and it could damage our bullish thesis since it would break the market structure on longer timeframes. But if $108k-$110k holds, BTC looks good again.
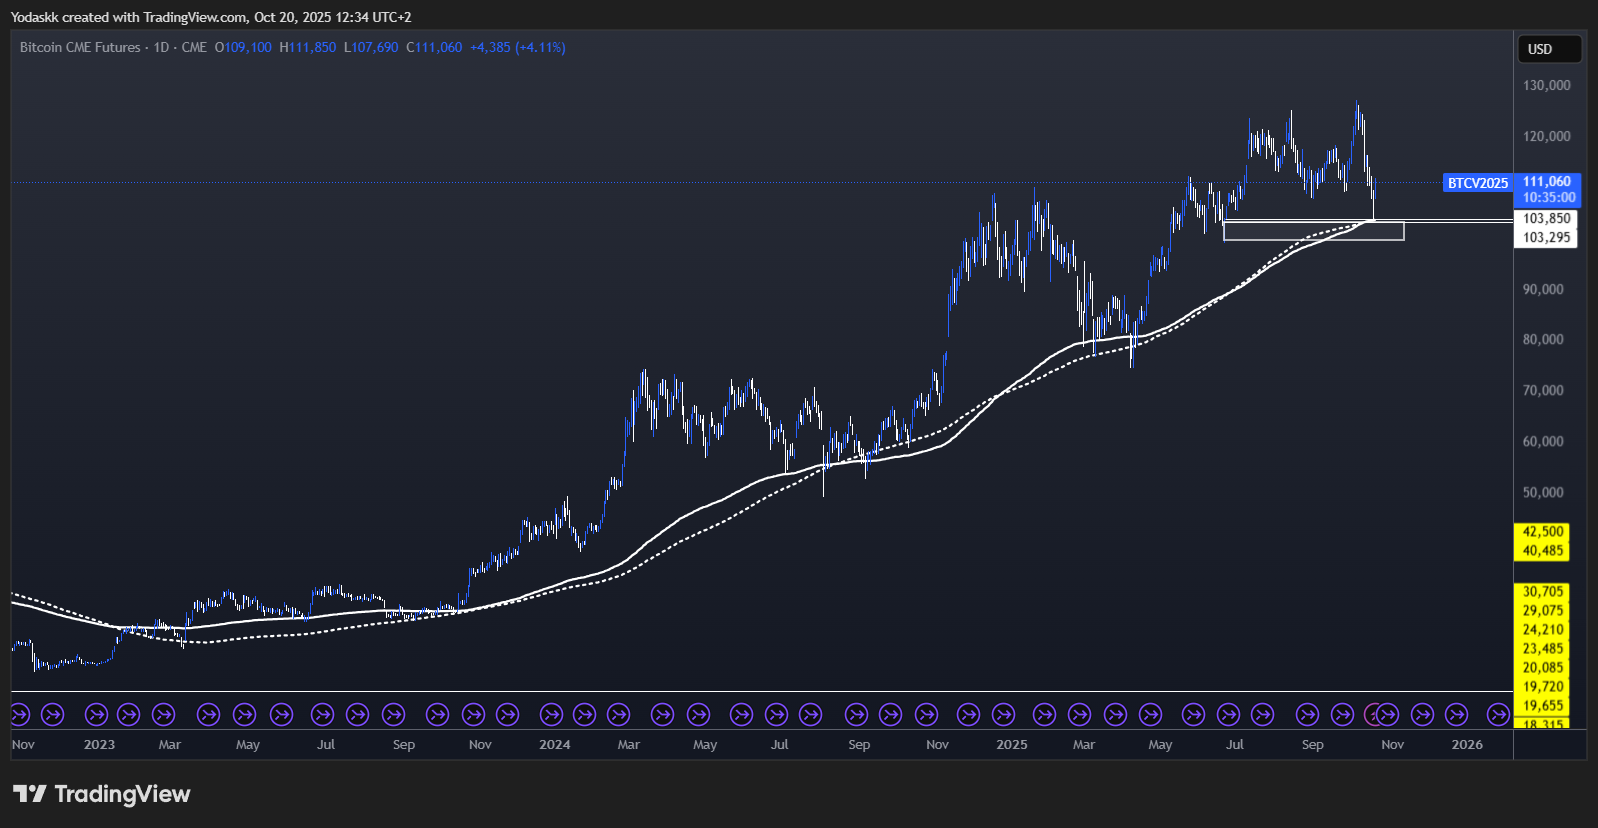
Also, note that the BTC low was at the 200-Day EMA+SMA (long-term important moving averages) on the CME chart (which is the most used chart by institutions). All major lows for the past 3 years have occurred around the 200-Day EMA+SMA on the CME chart.
Technical analysis
- False breakdown below $108k-$110k support appears to have resolved back into range
- Upside reaction targets $114k, $119k; below $108k opens move to $102k
- 200-Day EMA+SMA continues to serve as macro price floor
Cryptonary's take
BTC looks like a false breakdown below our support at $108k. Many alts look very promising with possible double bottoms that would confirm if BTC holds support.- Next Support: $108,000–$110,000
- Next Resistance: $114,000-$115,000
- Direction: Neutral to Bullish
- Upside Target: $119,000
- Downside Target: $102,000
ETH:
- Price Range: $3,750 – $4,250
- Bias: Neutral to Bullish
- Resistance: $4,250
- Support Zone: $3,750 – $3,850
- Breakdown Trigger: $3,700
Technical analysis
- Held key $3,750 support, bounced to resistance at $4,060
- Bullish scenario: reclaim $4,250 and advance to $4,800
- Bearish scenario: break $3,700 opens $3,400-$3,500 test
Cryptonary's take
ETH holds structure above $3,750, mirroring BTC. Next steps hinge on BTC's ability to hold support.- Next Support: $3,750–$3,850
- Next Resistance: $4,250
- Direction: Neutral to Bullish
- Upside Target: $4,800
- Downside Target: $3,400-$3,500
SOL:
- Price Range: $178 – $210
- Bias: Neutral to Bullish
- Resistance and Key Level to Reclaim: $213
- Support Zone: $178 – $190
- Breakdown Trigger: Break below $175
Technical analysis
- Double bottom holding above $178, eyes on $213 trigger
- Breakout above $213 targets $237+
- Breakdown below $175, range opens down to $120
Cryptonary's take
SOL's structure is constructive as long as $178 support holds. Watch for a confirmation move above $213 for bullish momentum.- Next Support: $178–$190
- Next Resistance: $213
- Direction: Neutral to Bullish
- Upside Target: $237
- Downside Target: $155–$120
HYPE:
- Price Range: $36 – $44
- Bias: Neutral
- Resistance and Key Level to Reclaim: $43–$44
- Support Zone: $36.5–$37.5
- Breakdown Trigger: Break below $35.5
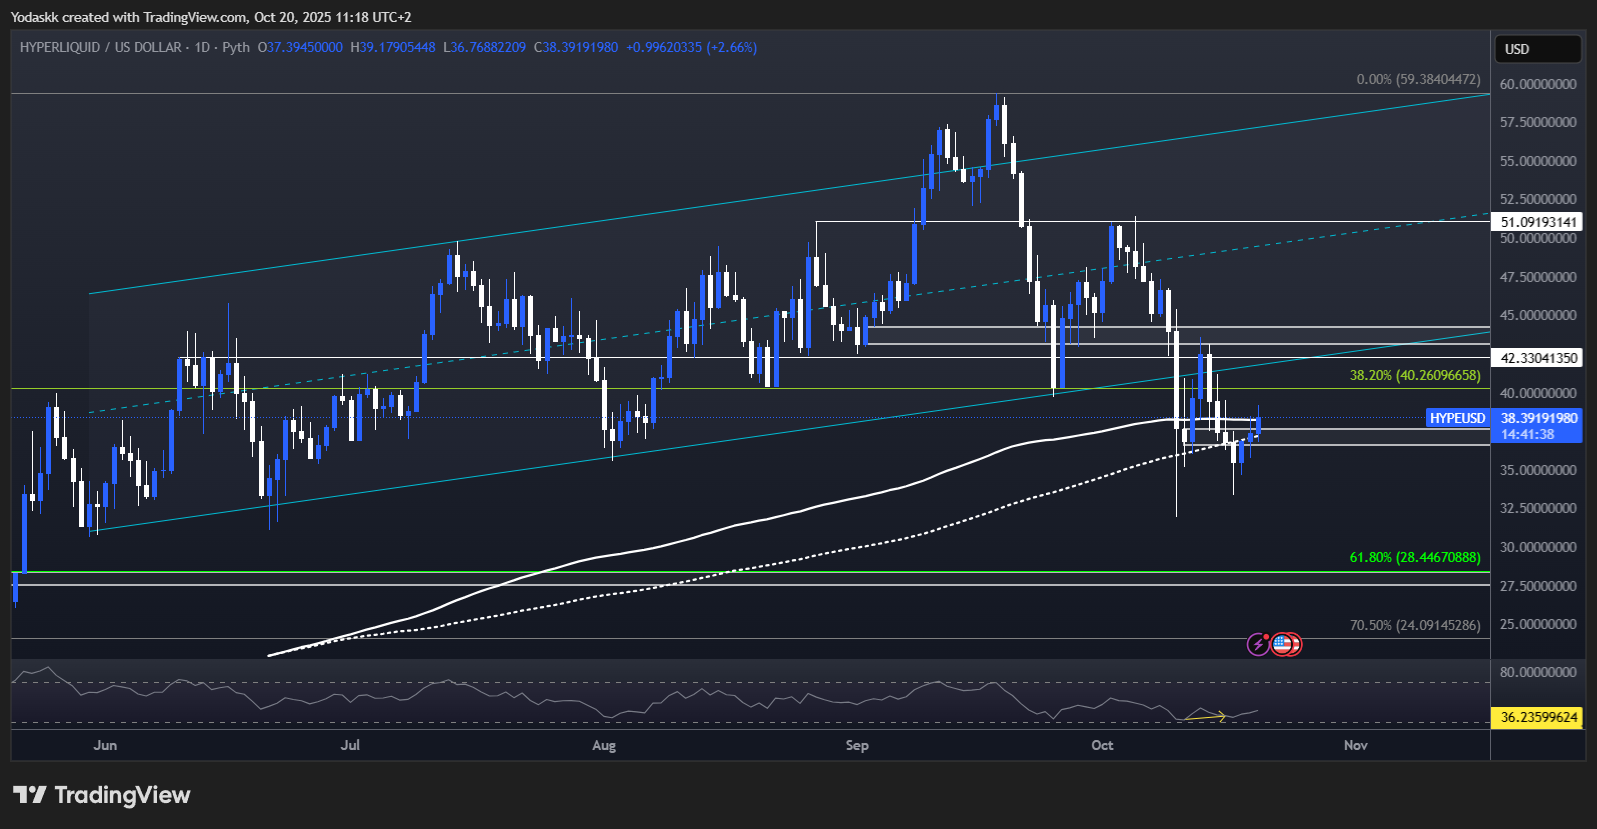
Technical analysis
- Potential double bottom, RSI bullish divergence
- Resistance at $43–$44 is key for further upside
- Break below $35.5 opens $32, then $28
Cryptonary's take
HYPE needs to clear $43 and hold above $37.5 to build a stronger base. Weak bounce could present dip buy zones at $32-$28.- Next Support: $36.5–$37.5
- Next Resistance: $43–$44
- Direction: Neutral
- Upside Target: $44+
- Downside Target: $32–$28
AURA:
- Price Range: $0.065 – $0.1
- Bias: Bullish
- Resistance and Key Level to Reclaim: $0.1
- Support Zone: $0.065
- Breakdown Trigger: Break below $0.05
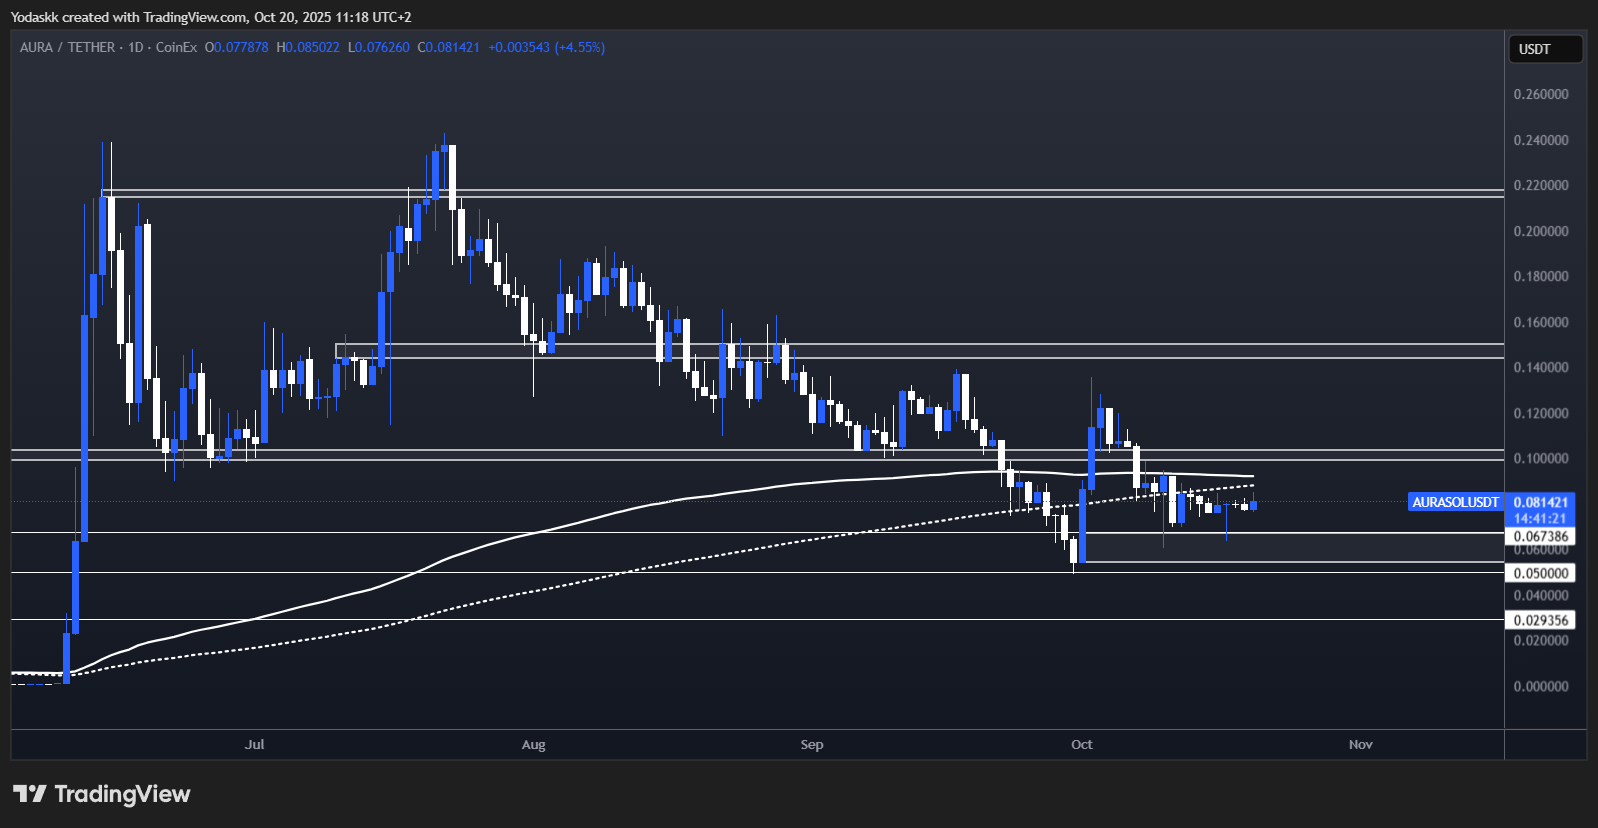
Technical analysis
- Rangebound between $0.065 and $0.1
- Clear above $0.1 opens $0.15+
- Sub $0.05 welcomes dip-buyers
Cryptonary's take
AURA consolidates with bullish re-accumulation vibes; price reclaim above $0.1 could set off next rally leg.- Next Support: $0.065
- Next Resistance: $0.1
- Direction: Bullish
- Upside Target: $0.15
- Downside Target: $0.05
Recommended from Cryptonary


PRO
Market Direction
13 min read
Mar 10, 2026

PRO
Market Direction
12 min read
Mar 6, 2026
PRO
Market Direction
10 min read
Mar 3, 2026
