Save 23% ($351) & Get a Free 1-1 Call with our Team ⏰ : 0d 2h 59m 43s
BTC, ETH and More: Downside Risks Grow Across Majors
Relief rallies are becoming weaker. Each push into resistance is seeing less expansion, shorter follow-through, and faster rejection. That shift in behaviour matters. When upside attempts lose momentum, it often signals that liquidity below is unfinished business. Here’s what matters next...

Disclaimer: This is not financial or investment advice. You are responsible for any capital-related decisions you make, and only you are accountable for the results.
Quick bridge from last week…
Last week, we were neutral-bearish on Bitcoin and Ethereum, expecting relief rallies into resistance before continuation lower. For Solana, we were neutral but anticipated a rotation toward the range highs. On Hyperliquid, we maintained a clear bearish stance with defined downside levels.Bitcoin pushed through $68.8K toward $71K before stalling, and Ethereum tagged $2,115 before rolling back to $1,957. Solana rotated to range highs around $89 but failed to secure any closing above it as anticipated. None of the majors broke prior relief highs, reinforcing the corrective nature of the move. Hyperliquid briefly reclaimed $30.6 but failed to hold it for long, flipping it back into resistance and keeping the broader bearish pressure intact.
In today’s report, we are also revisiting stablecoin dominance. Earlier this month, we mapped out a monthly supply zone, and price has since wicked deep into that region and closed back inside it on the weekly timeframe. There is no confirmation yet, but the structure suggests potential topping behavior, something we’ll analyze in more detail in today’s market direction.
TLDR
- Bitcoin: Relief rally looks exhausted, neutral-bearish while ranging $65.6K-$71K. Downside targets $65K and $62K. Break above $71K opens another relief push.
- Ethereum: $1,957 holding, but liquidity sits below $1,900. Break below $1,900 opens $1,752, deviation and reclaim would need current neutral-bearish bias reassessment.
- Solana: Consolidating between $78-$89. Break below $78 reopens $67.7 (then $58.56 if weakness expands), strength above $89 opens $97.7.
- Hyperliquid: Bearish bias intact, $28.39 support key, loss opens $25.4. Reclaim of $33 forces reassessment.
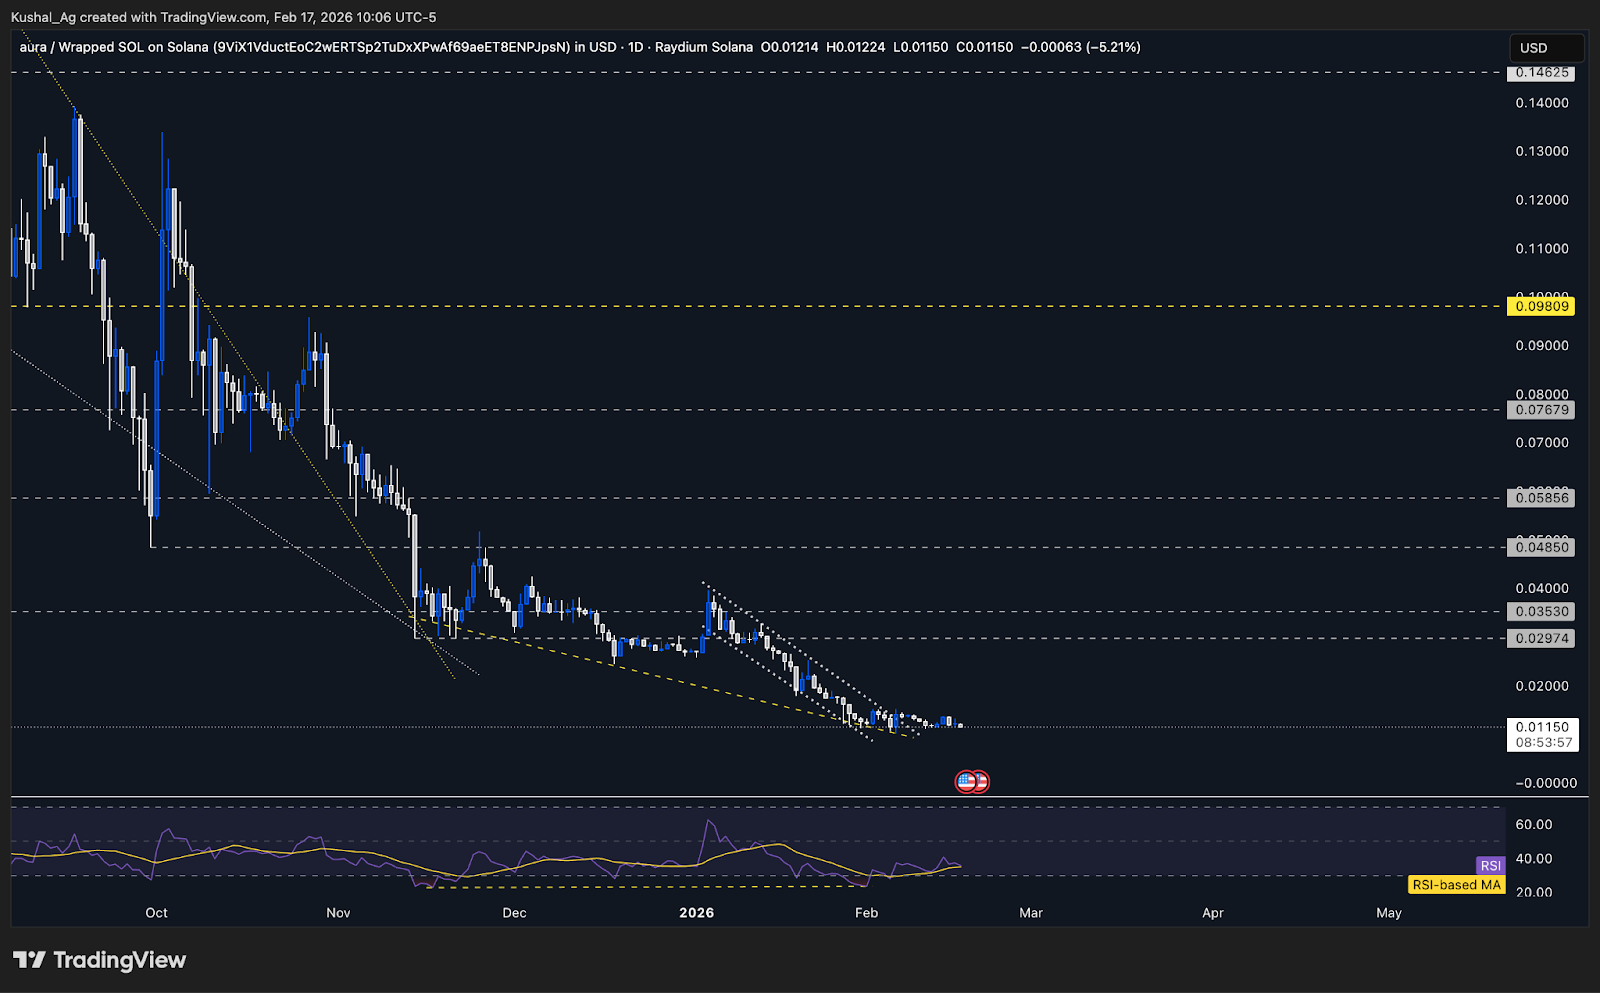
- Aura: Structure flat and compressed, bullish divergence intact but awaiting broader market and Solanas strength for confirmation.
- USDT+USDC Dominance: At HTF supply. Daily break below 10.4% confirms bearish shift (potential risk-on), failure keeps upside pressure intact.
Bitcoin
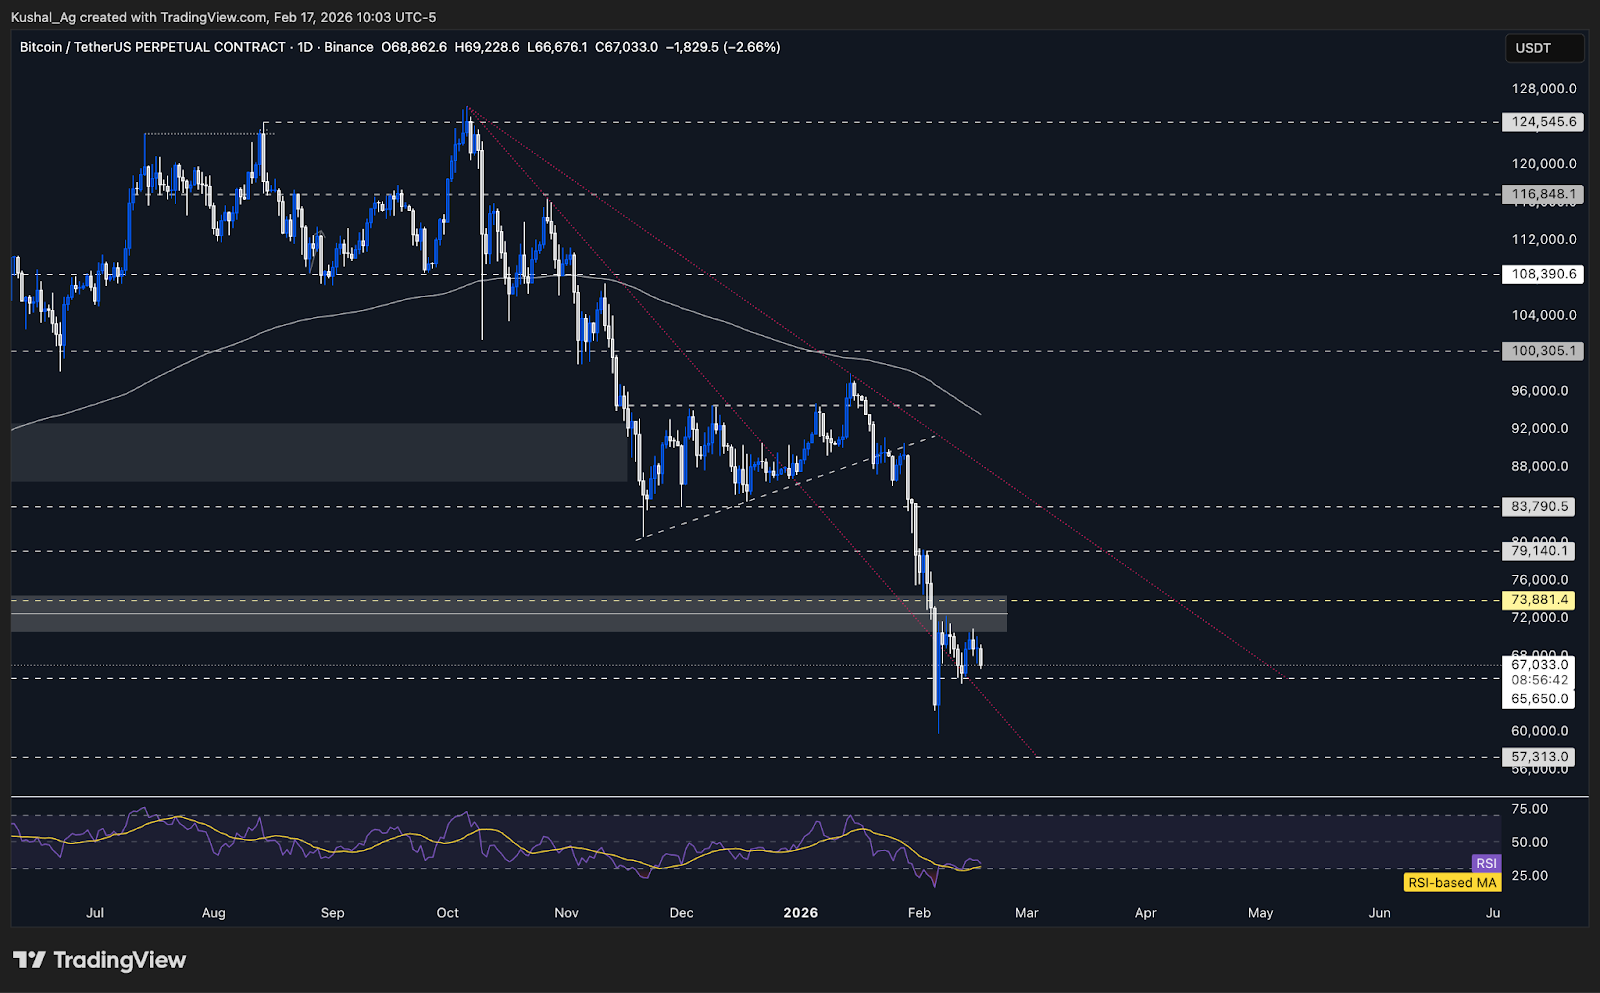
TABitcoin did deliver the short-term relief push we were expecting. Price reclaimed the $68,800 resistance, held above it for a few sessions, and extended toward $71K, just shy of the next mapped resistance near $72,500. That reaction was technically clean, but follow-through was limited, and price has since slipped back below $68,800, which had been acting as intermediate support.
Structurally, Bitcoin remains range-bound. The broader weekly range (originating from the 2nd February weekly candle) is still intact, while the tighter working range sits between $65,650 support and $71K resistance. Price has now rejected from the upper boundary again, suggesting range continuation for now.
Given repeated rejection at range highs, probability favors a move back toward the lower boundary. A test of $65,650 looks likely, and if that level breaks, $62K (around the 5th February low region) becomes the next downside objective. Below that, we reassess momentum and structure.
On the trendline front, Bitcoin is currently trading above the first reclaimed descending trendline, but still well below the larger macro downtrend resistance (near $79K-$80K). A retest of the broken trendline could coincide with the $63K-$64K region, which aligns with the downside bias.
The 200EMA continues sloping downward near $93,500, reflecting broader bearish pressure. RSI has recovered from extreme oversold levels but remains weak around 35 with average near 31, suggesting relief has already played out and momentum is not yet supportive of sustained upside.
Key Levels
- Support: $65,650
- Resistance: $71,000
- Direction: Neutral-Bearish
- Upside Target: $73,800
- Downside Target: $62,000
Cryptonary's Take
Bitcoin remains rangebound here, and repeated rejection from the upper boundary shifts the bias slightly back toward the downside. As long as price stays below $71K, rotation toward $65K-$62K remains the higher probability path.Conversely, if we see a flush below $62K followed by a reclaim, that could open the door for a bullish divergence setup. For now, however, the structure favors controlled downside rotation within range.
Ethereum
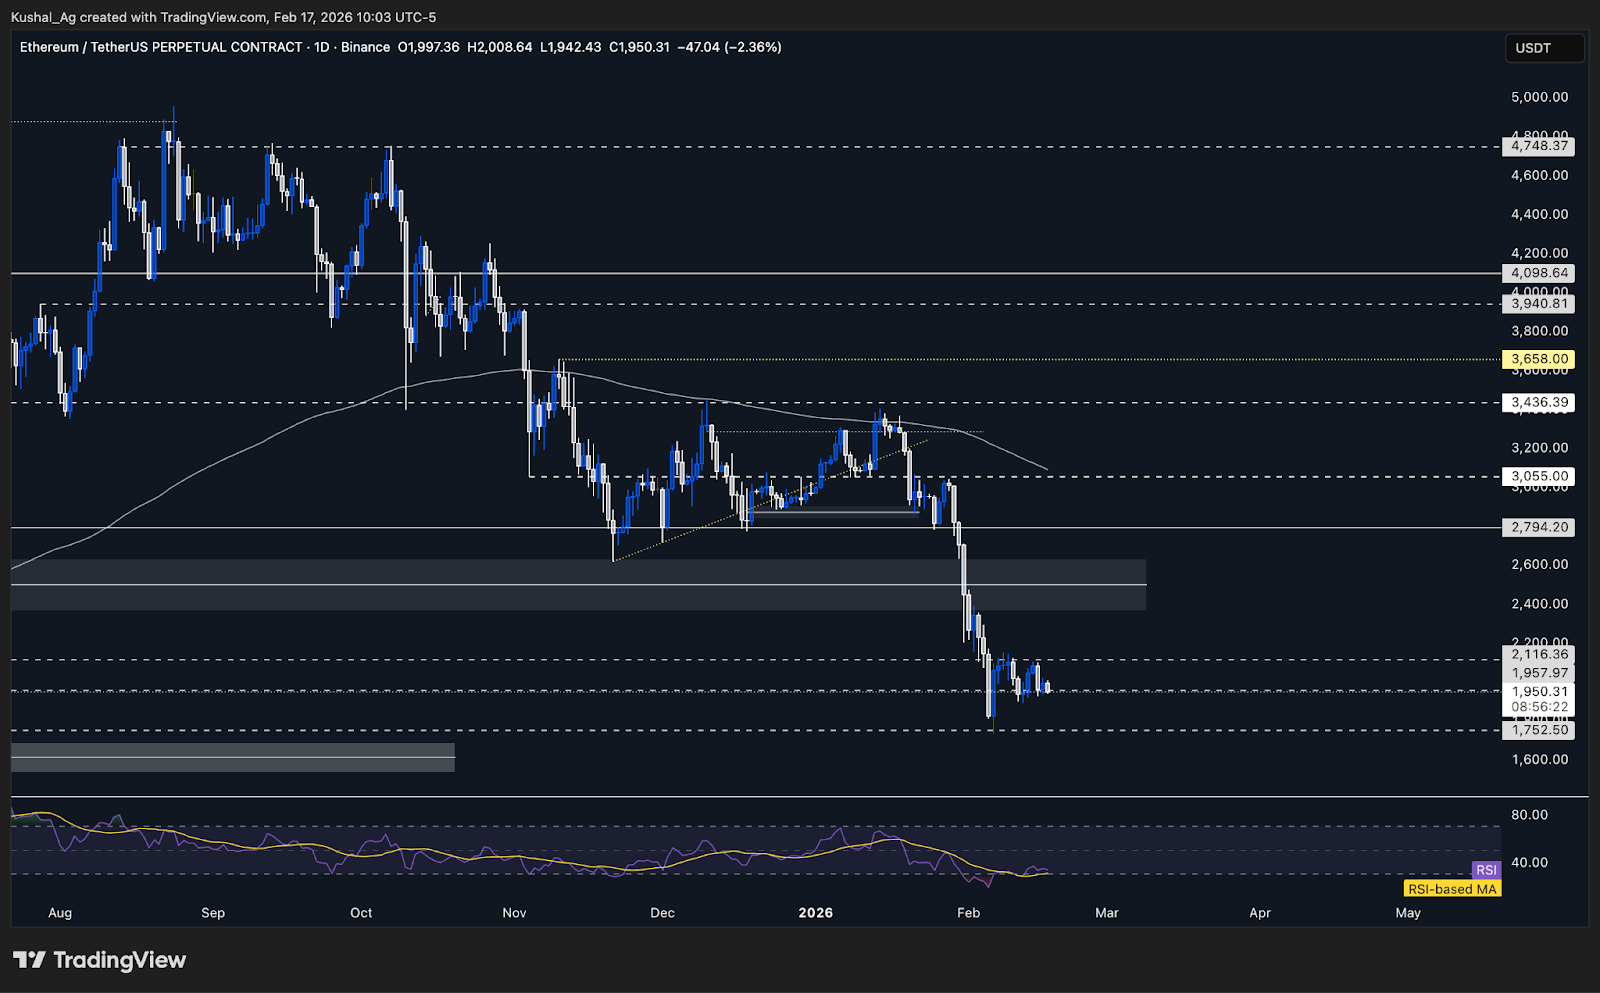
TAEthereum has returned to the $1,957 support zone after delivering the relief rally toward $2,100 that we mapped out previously. The move played out from support to resistance, and price is now back testing the same demand area. This time, however, the bounce appears weaker and momentum is less convincing.
The $1,957 level continues to hold for now, but liquidity now sits clearly below the $1,900 level, specifically around the 11th February daily candle low. That area becomes the next key magnet if weakness persists. As long as price remains capped below $2,150, the bias stays tilted to the downside.
A clean break and daily acceptance below $1,900 would open continuation toward $1,752, which remains the next major downside objective. That aligns with our broader neutral-bearish stance across majors. On the other hand, if we see a deviation below $1,900 followed by a strong reclaim of $1,950 with time acceptance, we would reassess the bearish bias.
If instead price holds $1,957 and reclaims $2,150 with strength, that would invalidate the immediate neutral-bearish thesis and reopen $2,367 on the upside. For now, that is not the base case, as the prior relief rally appears exhausted.
The 200 EMA on the daily timeframe continues to slope downward near $3,090, reflecting broader structural pressure. RSI has recovered from extreme oversold levels and now sits around 35 with average at 30, but momentum remains weak overall.
There is also a conditional setup to monitor: a decisive daily close below $1,820 followed by a strong reclaim of lost support could form a bullish RSI divergence structure. That scenario is not active yet but is something to track if deeper downside prints first.
Key Levels
- Support: $1,957
- Resistance: $2,150
- Direction: Neutral-Bearish
- Upside Target: $2,367
- Downside Target: $1,752
Cryptonary’s Take
Ethereum remains in a fragile position. While $1,957 continues to hold, the presence of liquidity below $1,900 increases the probability of another sweep before any sustainable reversal attempt. Unless $2,150 is reclaimed decisively, rallies are likely to be corrective in nature.The base case remains downside continuation toward $1,752 if $1,900 gives way. Only a strong deviation-and-reclaim structure below key lows or a decisive break above resistance would shift this bias. Until then, neutral-bearish remains the anchor stance.
Solana
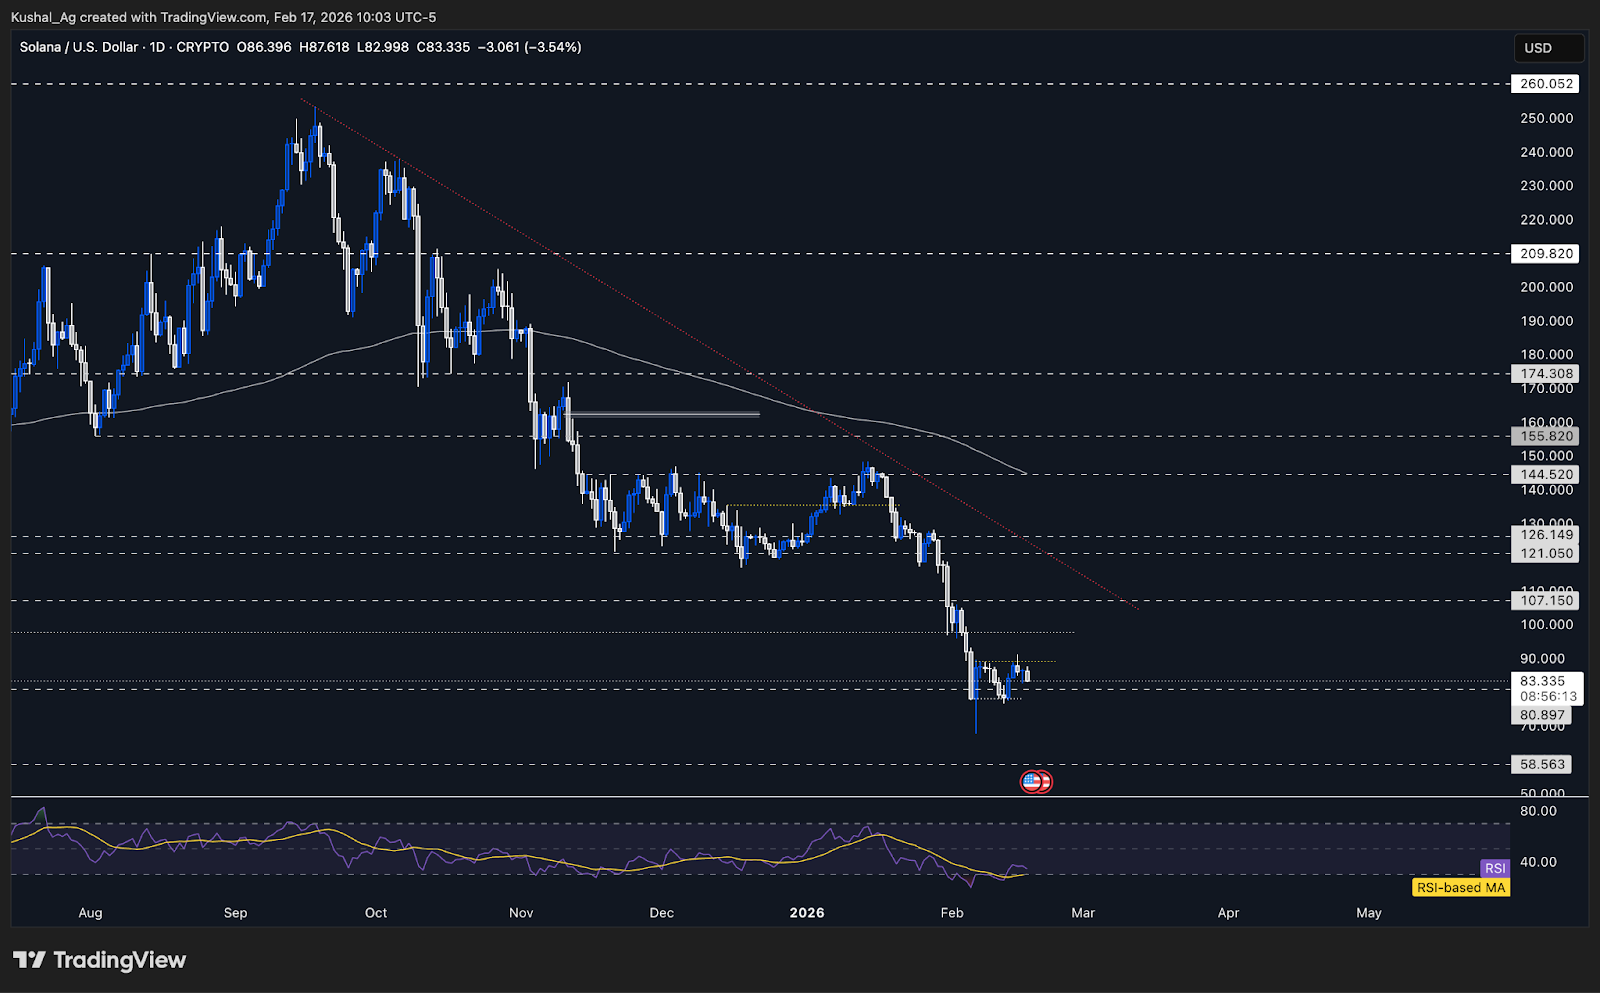
TASolana previously held the range lows near the $78 region and delivered the expected relief move toward the upper boundary of the range. Price pushed into the $89 zone, which we had marked as the range high area, but failed to secure any meaningful daily closes above it. The move stalled around $91 where selling pressure came into play.
After briefly poking above $89, Solana has started to reject from the range highs and roll slightly lower. Structurally, there has been no decisive breakout on either side. The asset continues to trade inside the broader consolidation between roughly $78 on the bottom and $89 on the top.
As long as Solana remains inside this range, the base case remains continued chop. A clean daily close above $89 with follow-through would open the path toward $97.7. However, given broader market weakness, that is not the primary scenario at the moment.
On the downside, a break below $78 would likely send the price back toward $67.7, the recent swing low. If broader market pressure accelerates, deeper downside extensions could develop from there, but that would require confirmation through daily closes below support.
The 200 EMA on the daily timeframe continues to slope downward around $144.5, reflecting the larger bearish structure still in play. RSI has recovered modestly to around 35 from deeper oversold conditions with average at 30, but momentum remains weak overall and does not yet signal strength.
Key Levels
- Support: $78
- Resistance: $89
- Direction: Neutral
- Upside Target: $97.7
- Downside Target: $67.7
Cryptonary’s Take
Solana remains range-bound and reactive to Bitcoin’s movement. The recent push into range highs failed to produce acceptance, reinforcing the idea that price is still consolidating.Until we see a decisive break above $89 or below $78, the expectation remains continued range behavior. Strength above range highs would shift short-term momentum higher, while a breakdown below range support would reopen downside continuation toward $67.7.
Hyperliquid
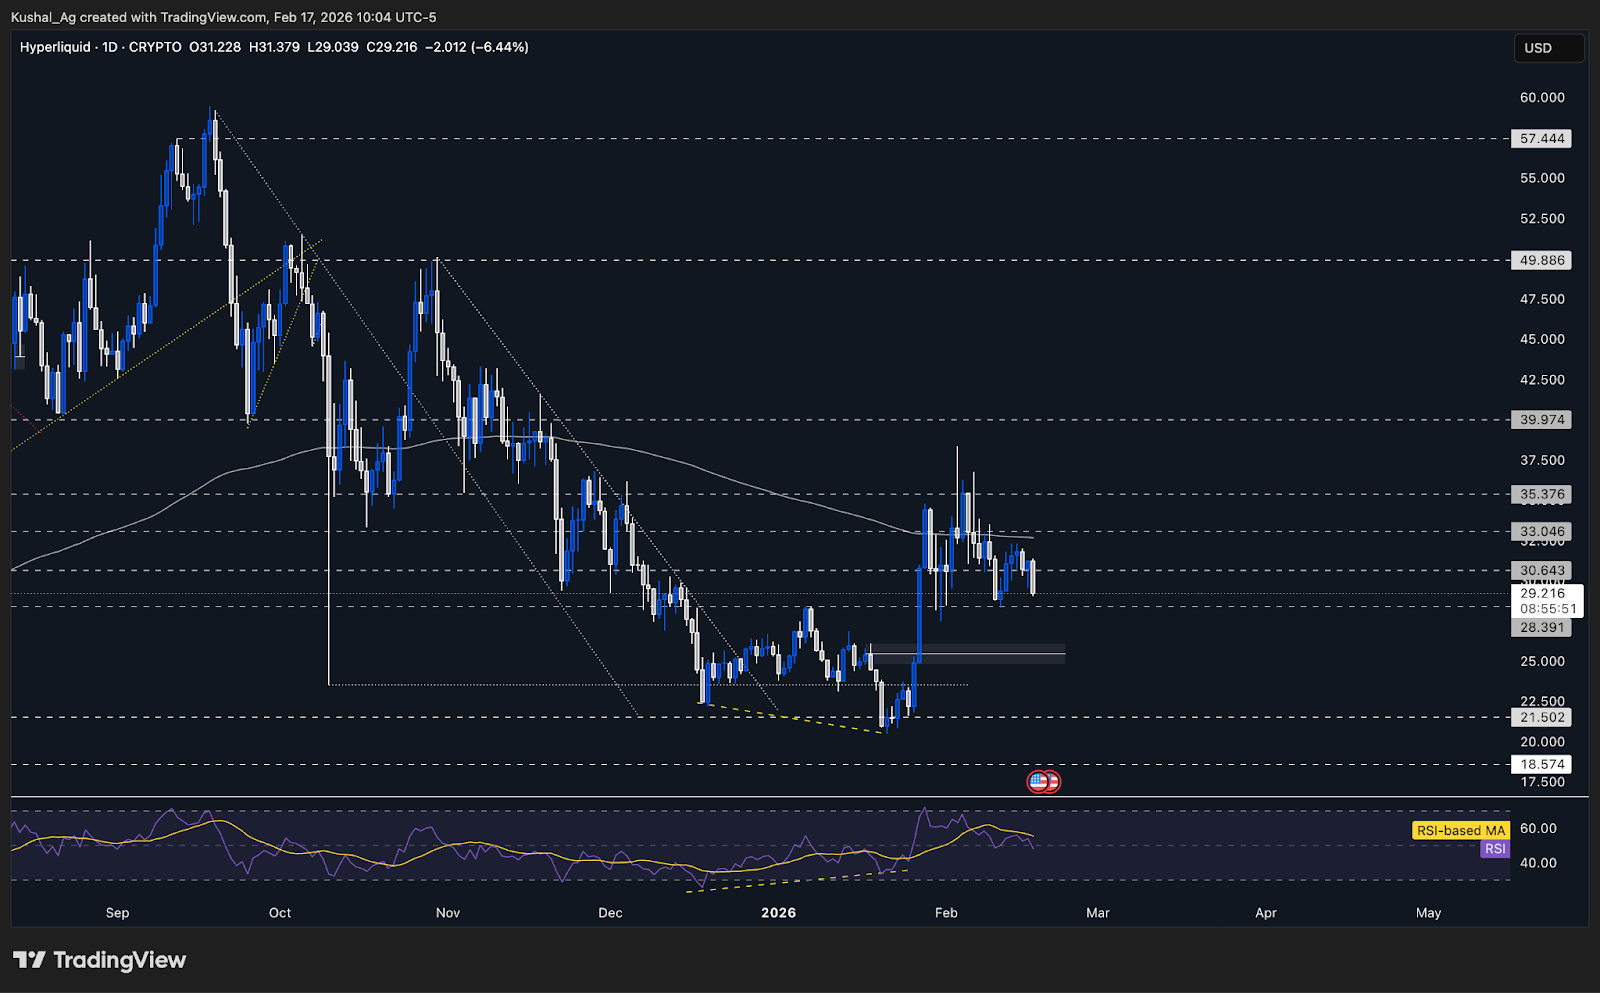
TAIn the previous analysis, Hyperliquid had tapped the first downside target around $28.39 and delivered a clean bounce from that level. Price briefly reclaimed $30.64 and even flipped it into short-term support, but the move lacked follow-through. Before reaching the $33 invalidation zone we outlined, price rolled over again from the $32-$32.5 region.
The $30.64 level, which temporarily acted as support, has now flipped back into resistance. This reinforces the broader bearish structure. The previously identified bearish divergence continues to play out, and momentum has failed to expand meaningfully on rebounds.
As long as price remains below $30.64, downside pressure remains the dominant theme. The first support band lies between $27.5 and $28.39. A decisive daily close below that region would open $25.4 as the next downside objective.
If $25.4 fails to hold, we could see prices revisit the low $20s again, potentially around the $21-$22 region. That area would likely attract stronger reassessment from a structural standpoint, but for now it remains a conditional scenario.
The 200 EMA on the daily timeframe is flattening around $32.6, reflecting loss of bullish momentum. RSI is hovering near 50 with an average around 55, showing neutral momentum. A breakdown below the $28 region would likely coincide with RSI rolling lower as well.
Key Levels
- Support: $27.5-$28.39
- Resistance: $30.64
- Direction: Bearish
- Upside Target: $33
- Downside Target: $25.4
Cryptonary’s Take
The bearish thesis remains intact for Hyperliquid. Rejection below $33 and failure to hold above $30.64 signal that upside attempts are being sold into.Unless price reclaims $30.64 and shows sustained strength, the path of least resistance remains lower toward $28 and potentially $25.4. Any deeper move into the low $20s would trigger a broader reassessment, but for now, structure favors continued downside pressure.
Aura
TAStructure remains largely unchanged, price continues to compress inside a very tight range for the past two weeks. There has been no meaningful expansion on either side, and volatility remains muted.
Price action closely mirrors Solana’s behavior, staying reactive largely. Until broader market strength returns, Aura is likely to remain range bound and sluggish.
The 200EMA on the daily timeframe continues to slope downward, currently around 0.0495, reflecting ongoing higher-timeframe pressure. Momentum remains weak overall.
RSI is hovering around 35 with an average near 34, showing flattened momentum without strong bullish expansion. There is no confirmed breakout signal yet, just continued compression.
- Direction: Bullish
Cryptonary’s Take
Aura remains in consolidation mode, tracking broader market conditions and not generating any independent strength yet. With structure compressed and momentum muted, the focus shifts to external catalysts, particularly Solana’s behavior and overall market liquidity. A decisive expansion will likely follow a broader market move, but until then, we remain patient.USDC + USDT Dominance
TAPrice is currently reacting inside the monthly supply zone we mapped out in early February. Although dominance wicked as high as 12.5%, there has been no confirmed higher-timeframe close above the supply, which keeps the broader topping structure intact for now.
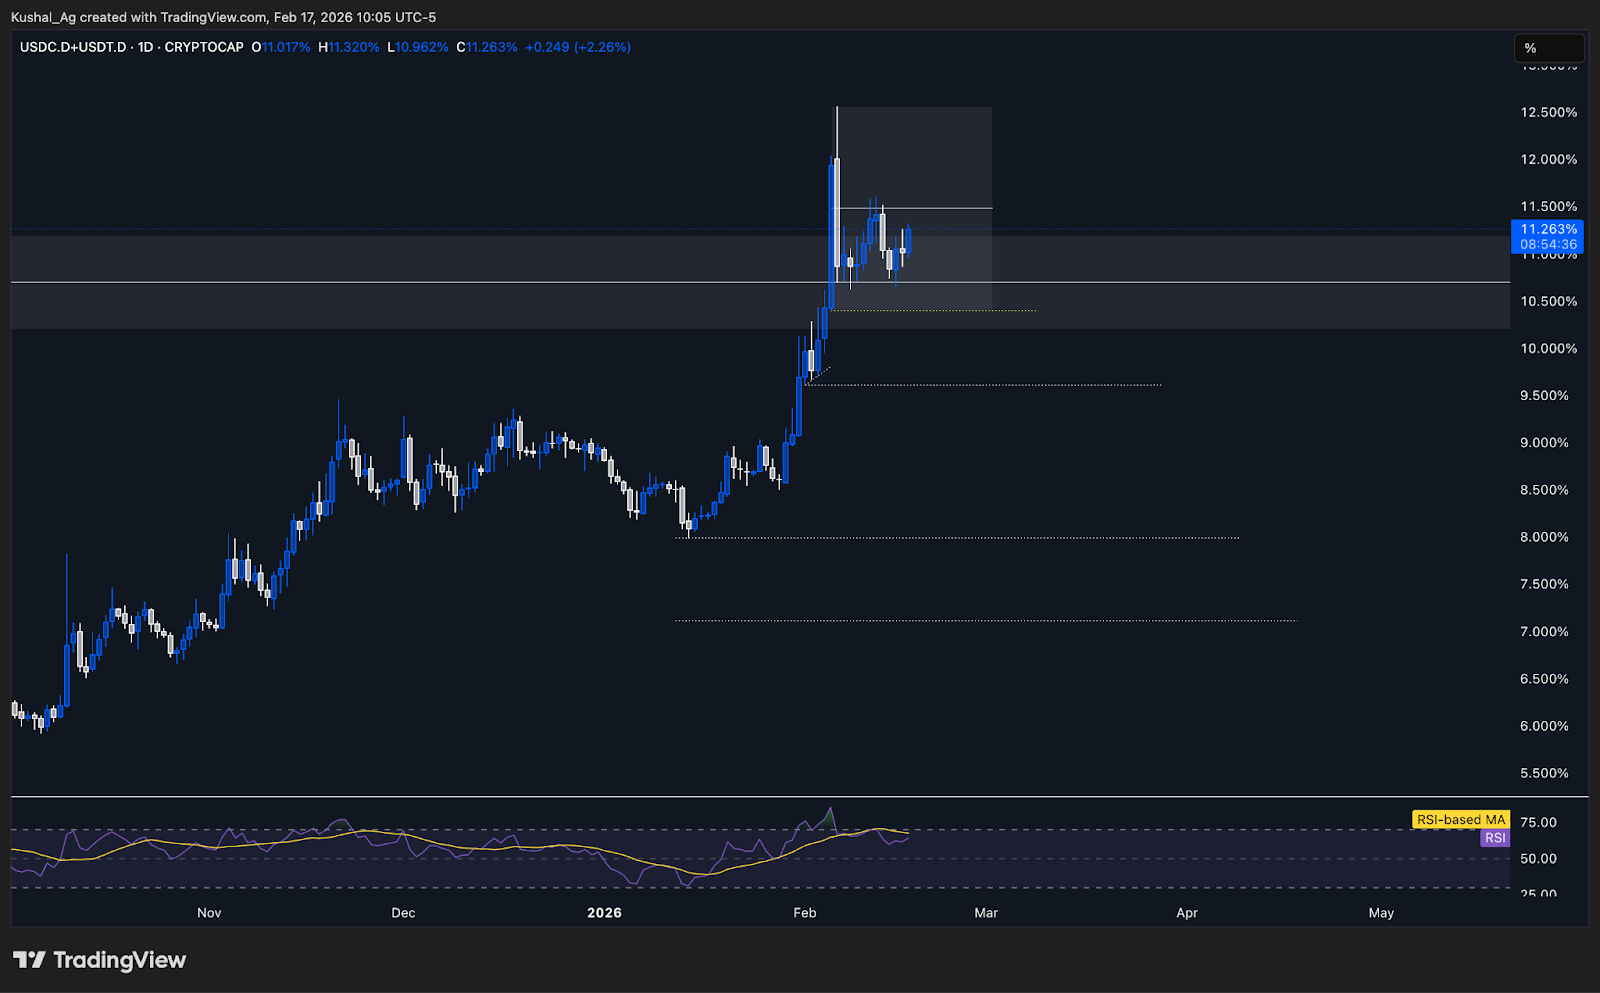
On the daily timeframe, structure is compressing around 10.7%, which is roughly the midpoint of that monthly supply. This level is acting as short-term equilibrium, but momentum appears to be stalling. A potential bearish daily order block is forming, though it remains unconfirmed.
Confirmation requires a decisive daily close below 10.4%. A breakdown beneath that level would validate the bearish order block structure and signal potential capital rotation out of stables and into risk assets.
If confirmed, downside targets come in sequence at 9.6%, followed by 8%, and then 7.1%. These levels would represent progressive risk-on expansion across the broader market.
On the upside, resistance remains layered at 11.48% (50% of the potential bearish order block) and 12.56% (order block high). As long as dominance remains below these levels and fails to reclaim them decisively, the bias leans toward an eventual breakdown.
Chart: USDC + USDT Dominance Supply Zone
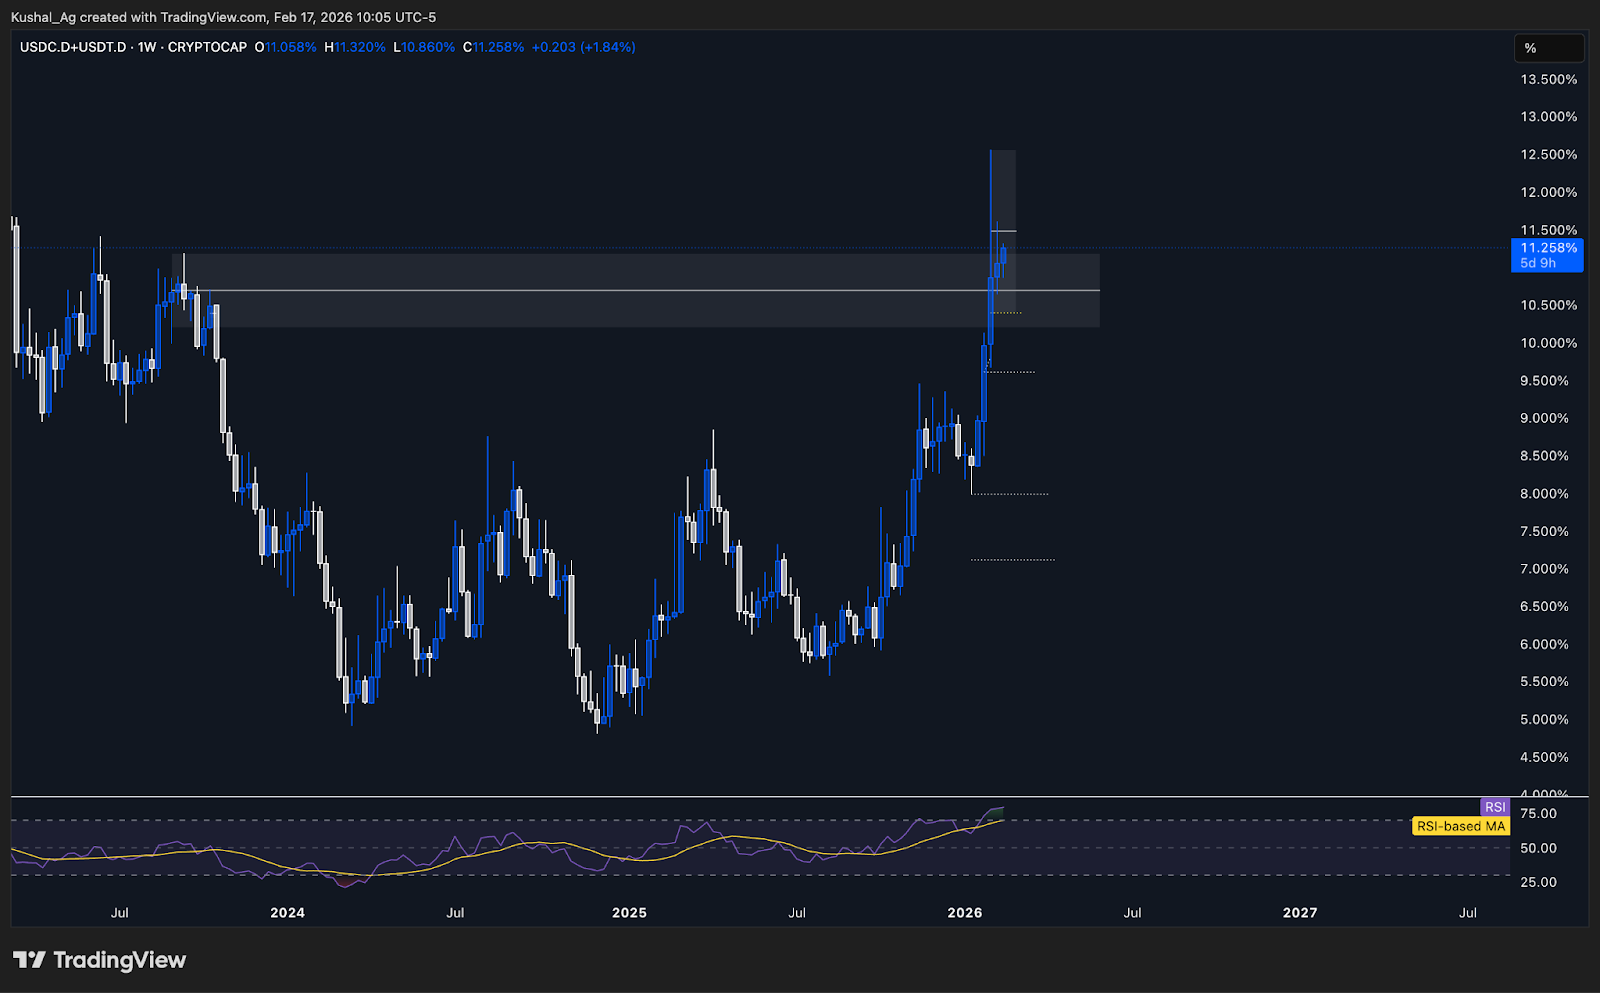
Chart: Stablecoin Dominance Compression & Order Block
Cryptonary’s Take
Stablecoin dominance is at a decisive point inside higher-timeframe supply. A confirmed daily breakdown below 10.4% would likely signal capital rotating back into risk assets, strengthening the case for broader market upside. Until that confirmation comes, however, this remains a potential topping structure, not an active trigger, so we stay patient and reactive to the level and not predict any breakdowns just yet.Closing Thoughts
Across the board, the latest relief rally was weaker than the previous one. Bitcoin and Ethereum both pushed into resistance but failed to expand higher, suggesting increasing downside pressure.With range lows still intact for now but lower targets mapped, the bias leans toward potential downside continuation over the next few sessions unless key resistance levels are reclaimed. Solana remains broadly range-bound within its wider 10-15% band and is likely to continue chopping as long as Bitcoin and Ethereum stay indecisive. Hyperliquid, however, continues to look relatively weaker and remains the more bearish structure among the majors.
The more interesting development comes from stablecoin dominance. While majors look heavy, stablecoin dominance is sitting inside a high-timeframe supply zone. A confirmed breakdown below 10.4% would signal capital rotating out of stables and into risk, potentially triggering a broader risk-on wave across the market. Until that confirmation occurs, we treat it as a setup in progress. We’ll continue monitoring this closely, as it may provide one of the clearest directional signals in the coming sessions.
Continue reading by joining Cryptonary Pro
$1,548 $1,197/year
Get everything you need to actively manage your portfolio and stay ahead. Ideal for investors seeking regular guidance and access to tools that help make informed decisions.
For your security, all orders are processed on a secured server.
As a Cryptonary Pro subscriber, you also get:
3X Value Guarantee - If cumulative documented upside does not reach 300% during your 12-month membership, you can request a full refund. Terms
24/7 access to experts with 50+ years’ experience
All of our top token picks for 2025
On hand technical analysis on any token of your choice
Weekly livestreams & ask us anything with the team
Daily insights on Macro, Mechanics, and On-chain
Curated list of top upcoming airdrops (free money)
3X Value Guarantee
If cumulative documented upside does not reach 300% during your 12-month membership, you can request a full refund.
Our track record speaks for itself
With over 2.4M tokens and widespread misinformation in crypto, we cut through the noise and consistently find winning assets.
Our track record speaks for itself
With over 2.4M tokens and widespread misinformation in crypto, we cut
through the noise and consistently find winning assets.


Frequently Asked Questions
Can I trust Cryptonary's calls?
Yes. We've consistently identified winners across multiple cycles. Bitcoin under $1,000, Ethereum under $70, Solana under $10, WIF from $0.003 to $5, PopCat from $0.004 to $2, SPX blasting past $1.70, and our latest pick has already 200X'd since June 2025. Everything is timestamped and public record.
Do I need to be an experienced trader or investor to benefit?
No. When we founded Cryptonary in 2017 the market was new to everyone. We intentionally created content that was easy to understand and actionable. That foundational principle is the crux of Cryptonary. Taking complex ideas and opportunities and presenting them in a way a 10 year old could understand.
What makes Cryptonary different from free crypto content on YouTube or Twitter?
Signal vs noise. We filter out 99.9% of garbage projects, provide data backed analysis, and have a proven track record of finding winners. Not to mention since Cryptonary's inception in 2017 we have never taken investment, sponsorship or partnership. Compare this to pretty much everyone else, no track record, and a long list of partnerships that cloud judgements.
Why is there no trial or refund policy?
We share highly sensitive, time-critical research. Once it's out, it can't be "returned." That's why membership is annual only. Crypto success takes time and commitment. If someone is not willing to invest 12 months into their future, there is no place for them at Cryptonary.
Do I get direct access to the Cryptonary team?
Yes. You will have 24/7 to the team that bought you BTC at $1,000, ETH at $70, and SOL at $10. Through our community chats, live Q&As, and member only channels, you can ask questions and interact directly with the team. Our team has over 50 years of combined experience which you can tap into every single day.
How often is content updated?
Daily. We provide real-time updates, weekly reports, emergency alerts, and live Q&As when the markets move fast. In crypto, the market moves fast, in Cryptonary, we move faster.
How does the 3X Value Guarantee work?
We stand behind the value of our research. If the documented upside from our published research during your 12-month membership does not exceed three times (3X) the annual subscription cost, you can request a full refund. Historical context: In every completed market cycle since 2017, cumulative documented upside has exceeded 10X this threshold.
TermsRecommended from Cryptonary


