Save 23% ($351) & Get a Free 1-1 Call with our Team ⏰ : 0d 2h 59m 44s
BTC, ETH and More: Key Crypto Support Levels Hold, Larger Move Approaching
Markets are compressing, and pressure is building. While Ethereum delivered on the short-term upside, Bitcoin’s failure to follow through highlights weak momentum across majors. Price has now rotated back into key support zones, keeping conditions choppy and range-bound. With dominance at a critical pivot and macro still unsupportive, the market is nearing a decision point...
Disclaimer: This is not financial or investment advice. You are responsible for any capital-related decisions you make, and only you are accountable for the results.
Quick bridge from earlier this week…
In the previous analysis, we maintained a neutral stance across most majors, with a neutral-bearish view on Hyperliquid, while also outlining short-term 3D upside liquidity setups. We highlighted upside liquidity targets for Bitcoin and Ethereum, expecting a relief move within the range. Since then, Ethereum delivered its 3D target, while Bitcoin failed to follow through for now and rotated back to support, keeping the broader structure intact.Across the board, majors have now returned to key support regions, reinforcing the range-bound and choppy environment. Solana has shown relative weakness, moving into a lower support band, while Hyperliquid completed its first downside target. Overall, price remains compressed with no clear expansion yet. In today’s analysis, we have also introduced Bitcoin dominance + stablecoin dominance, which is now at a key pivot, suggesting a larger move may be approaching.
On the macro side, the backdrop remains unsupportive for risk assets. A strong NFP print (178k vs 57k) and lower unemployment (4.3%) allow the Fed to stay on hold, delaying rate cuts. At the same time, Middle East tensions continue to add uncertainty. For a deeper breakdown, refer to today’s Market Pulse, where we’ve covered this in detail.
Disclaimer: This content is for informational and educational purposes only. It does not constitute financial advice, and should not be relied upon as a basis for making investment decisions. Virtual assets are volatile and may lose their value in full. Past performance does not indicate future results. Always do your own research.
TLDR
- Risk Posture: Defensive
- Bitcoin: BTC continues to hold $65,650 support and remains range-bound. The stance is neutral, with upside toward $70,500-$73,800 if strength builds, while a breakdown opens $62,800-$57,300.
- Ethereum: ETH completed its upside move and rejected from just under $2,170, returning to mid-range. The stance is neutral, with $2,116 as resistance and $1,957 as key support.
- Solana: SOL is holding $78 support after breaking lower, showing slight weakness. The stance is neutral, with a breakdown opening $70-$67.3, while reclaiming $80.89 would improve structure.
- Hyperliquid: HYPE hit $35.37 support and is stabilizing, but structure remains weak. The stance is neutral-bearish, with $33 as the next downside unless $39.97 is reclaimed.
- Aura: AURA remains range-bound with weak momentum, with direction dependent on Solana.
- BTC.D + Stablecoin.D: The index is at a key trendline support within a tight range. Holding and moving higher keeps the market defensive, while a breakdown signals risk-on and altcoin strength.
Bitcoin
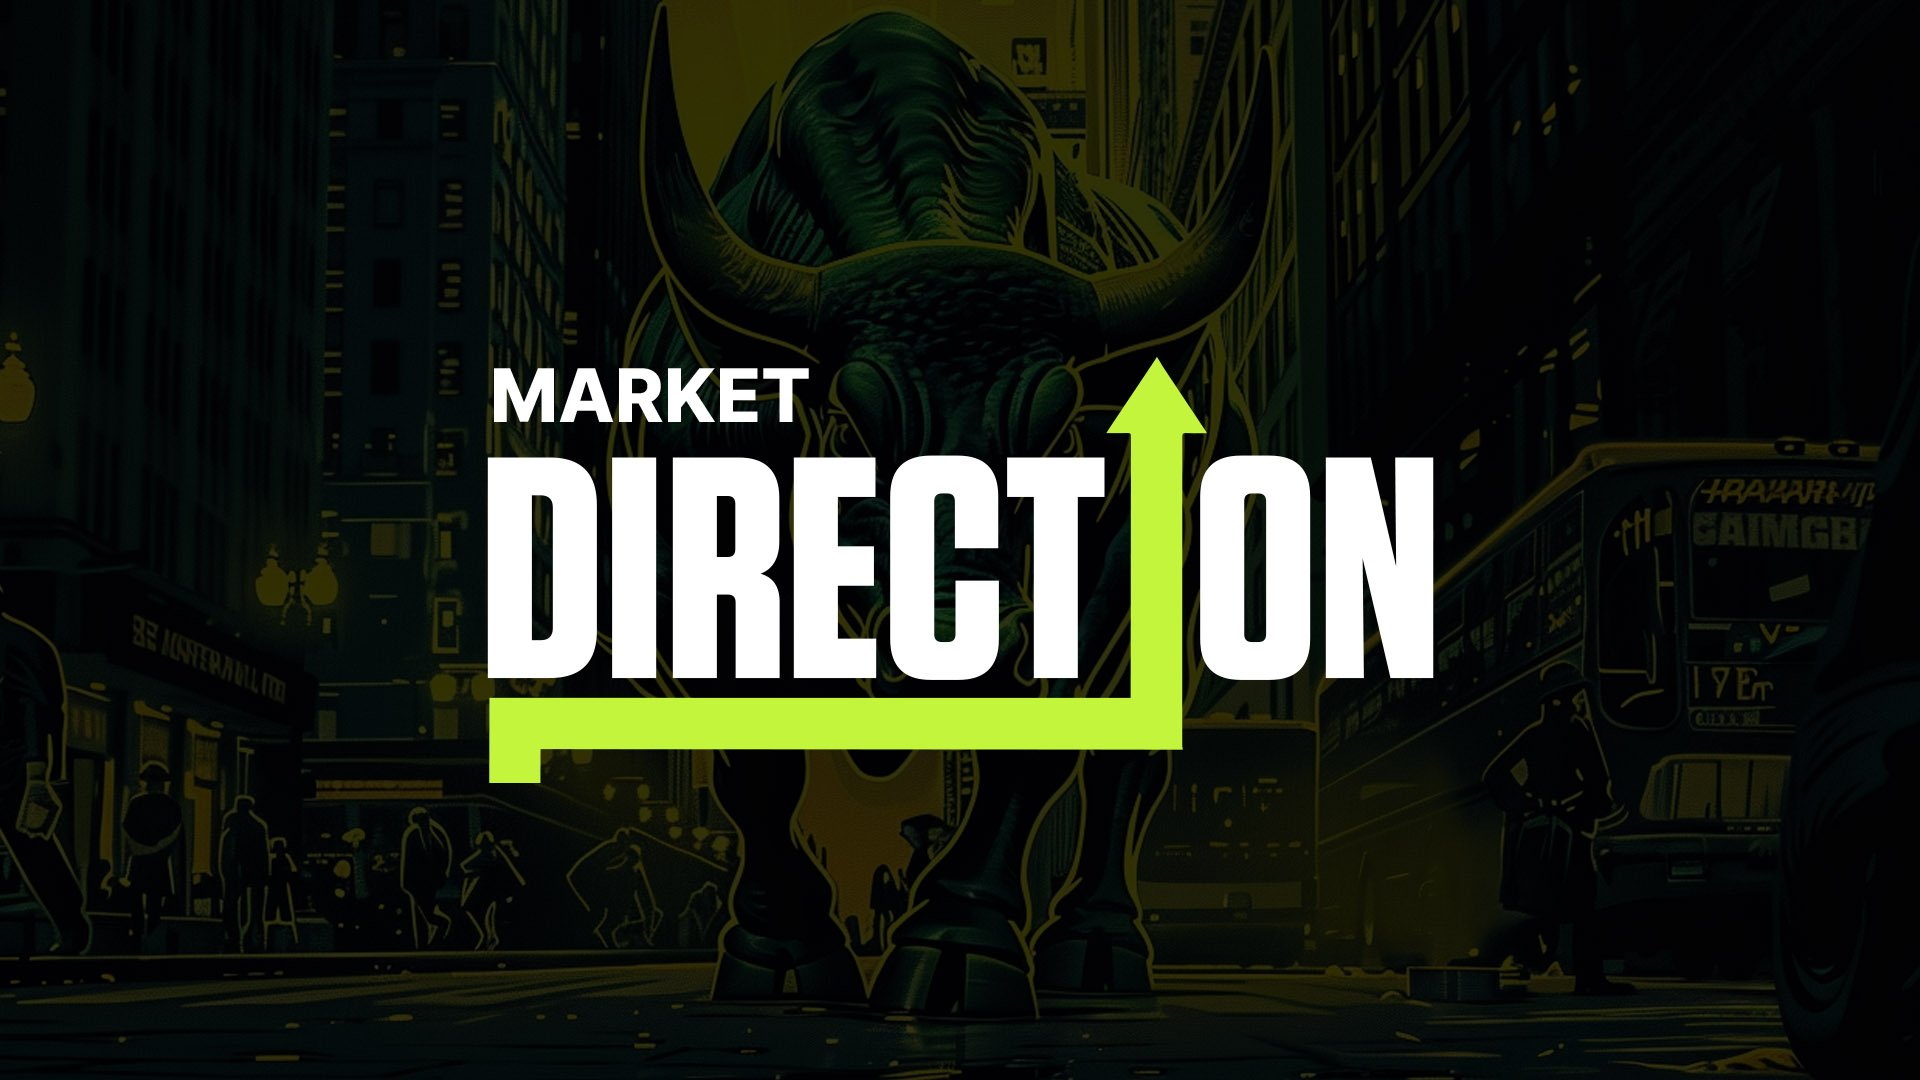
TABitcoin continues to trade within a range, with price once again reacting from the $65,650 support, which has been holding consistently over the past sessions. The expected upside move did not fully materialize, and instead, price has returned to support and remains choppy and sideways.
As long as $65,650 holds, the structure remains range-bound, and we continue with a neutral stance, expecting further consolidation within this band. On the upside, $70,500 remains key resistance, with potential liquidity targets at $71,500 & $73,800 if momentum builds.
However, this setup remains conditional. A break below $65,650 would invalidate the range and shift focus toward downside continuation, targeting $62,800, followed by $57,300.
The 200 EMA continues to trend downward near $84,600, reflecting broader weakness, while RSI remains soft around 43, showing limited recovery in momentum.
Bitcoin Price Chart:
Key Levels:
- Support: $65,650
- Resistance: $70,500
- Direction: Neutral
- Upside Target: $71,500 & $73,800
- Downside Target: $62,800 & $57,300
Cryptonary’s Take:
Bitcoin remains stuck in a clear consolidation phase, with neither bulls nor bears taking control. The repeated defense of $65,650 keeps the structure intact for now, but the lack of strong upside follow-through suggests limited momentum.For now, the base case remains range-bound price action, with patience required. A break of support would shift the outlook quickly toward the downside, while holding current levels keeps Bitcoin in a sideways environment, awaiting a stronger directional trigger.
Ethereum
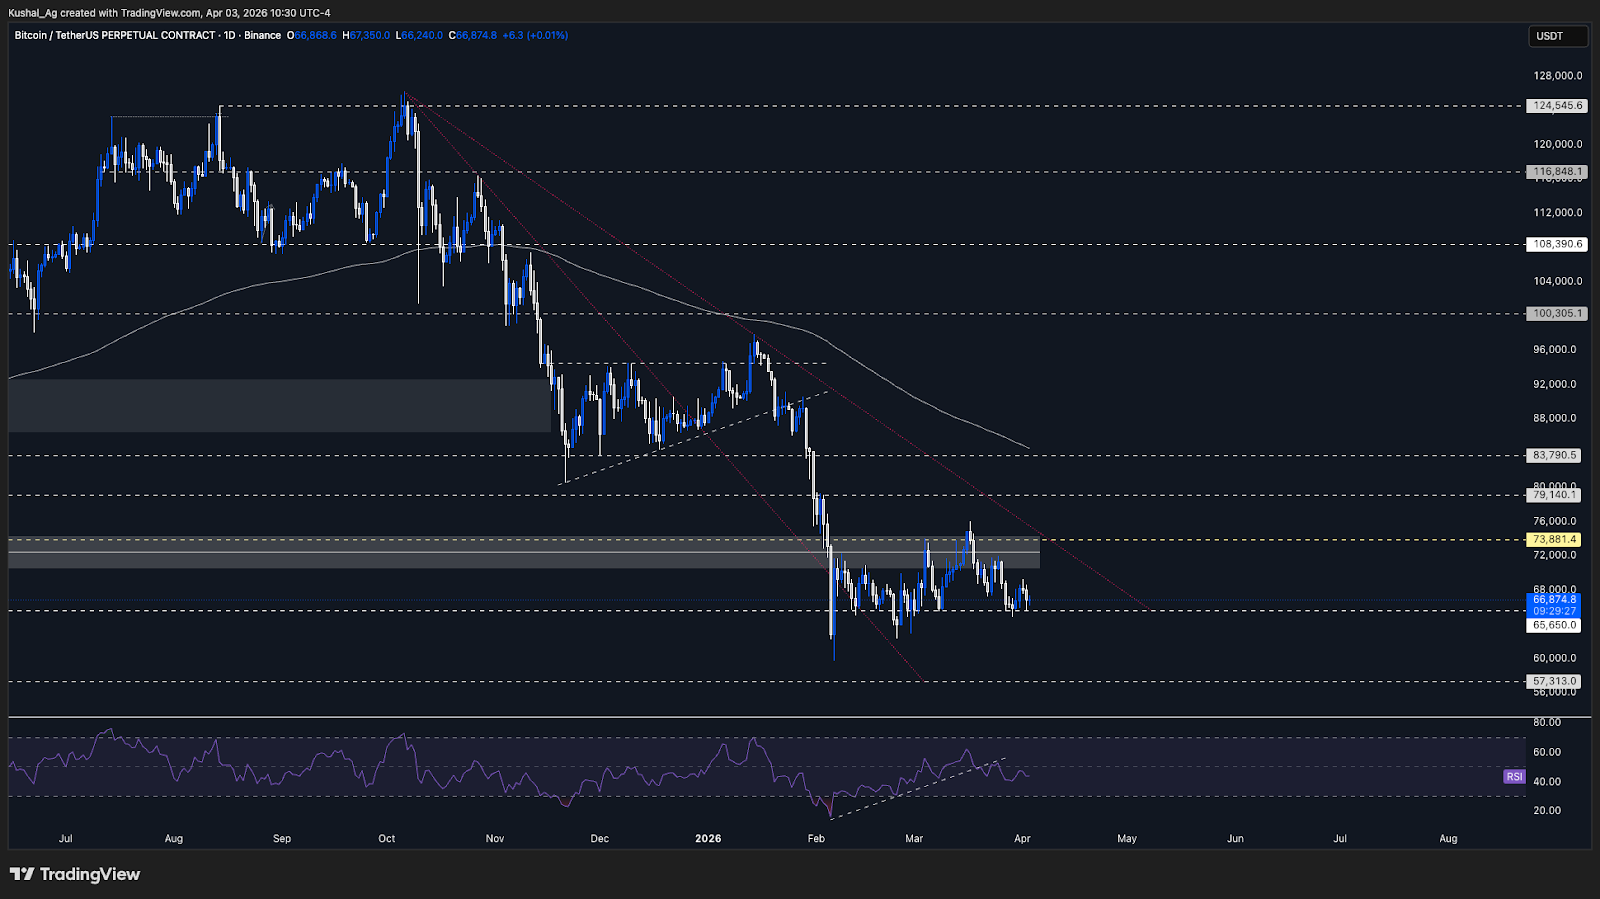
TAEthereum has played out the upside move as anticipated, with price tapping both the $2,116 resistance and the $2,170 target, reaching a high near $2,168 before rejecting. This completes the short-term 3-day upside liquidity setup we had outlined.
Following the rejection, price has now moved back toward the mid-range, and structure continues to remain range-bound, with this broader range in play since early February. Unless we see a decisive breakout, Ethereum is likely to continue chopping within this range.
On the downside, there is now a possibility of price drifting back toward the $1,957 support, which remains the key level to watch. A break below $1,957 would open downside toward $1,820, while holding this level keeps the range intact.
On the upside, $2,116 remains resistance, and only a clean break above this level would re-open continuation toward $2,400.
The 200 EMA continues to trend downward near $2,717, reflecting broader weakness, while RSI is around 47, indicating neutral momentum with no strong directional bias.
Ethereum Price Chart:
Key Levels:
- Support: $1,957
- Resistance: $2,116
- Direction: Neutral
- Upside Target: $2,400
- Downside Target: $1,820
Cryptonary’s Take:
Ethereum has now completed its short-term upside move and is back inside its broader range, reinforcing the idea that the market is still in a consolidation phase.The focus now shifts to range extremes, with $2,116 on the upside and $1,957 on the downside acting as key decision levels. Until one of these breaks, the most likely outcome remains continued sideways price action. For now, the stance remains neutral, with patience required until a clear breakout or breakdown provides the next directional move.
Solana
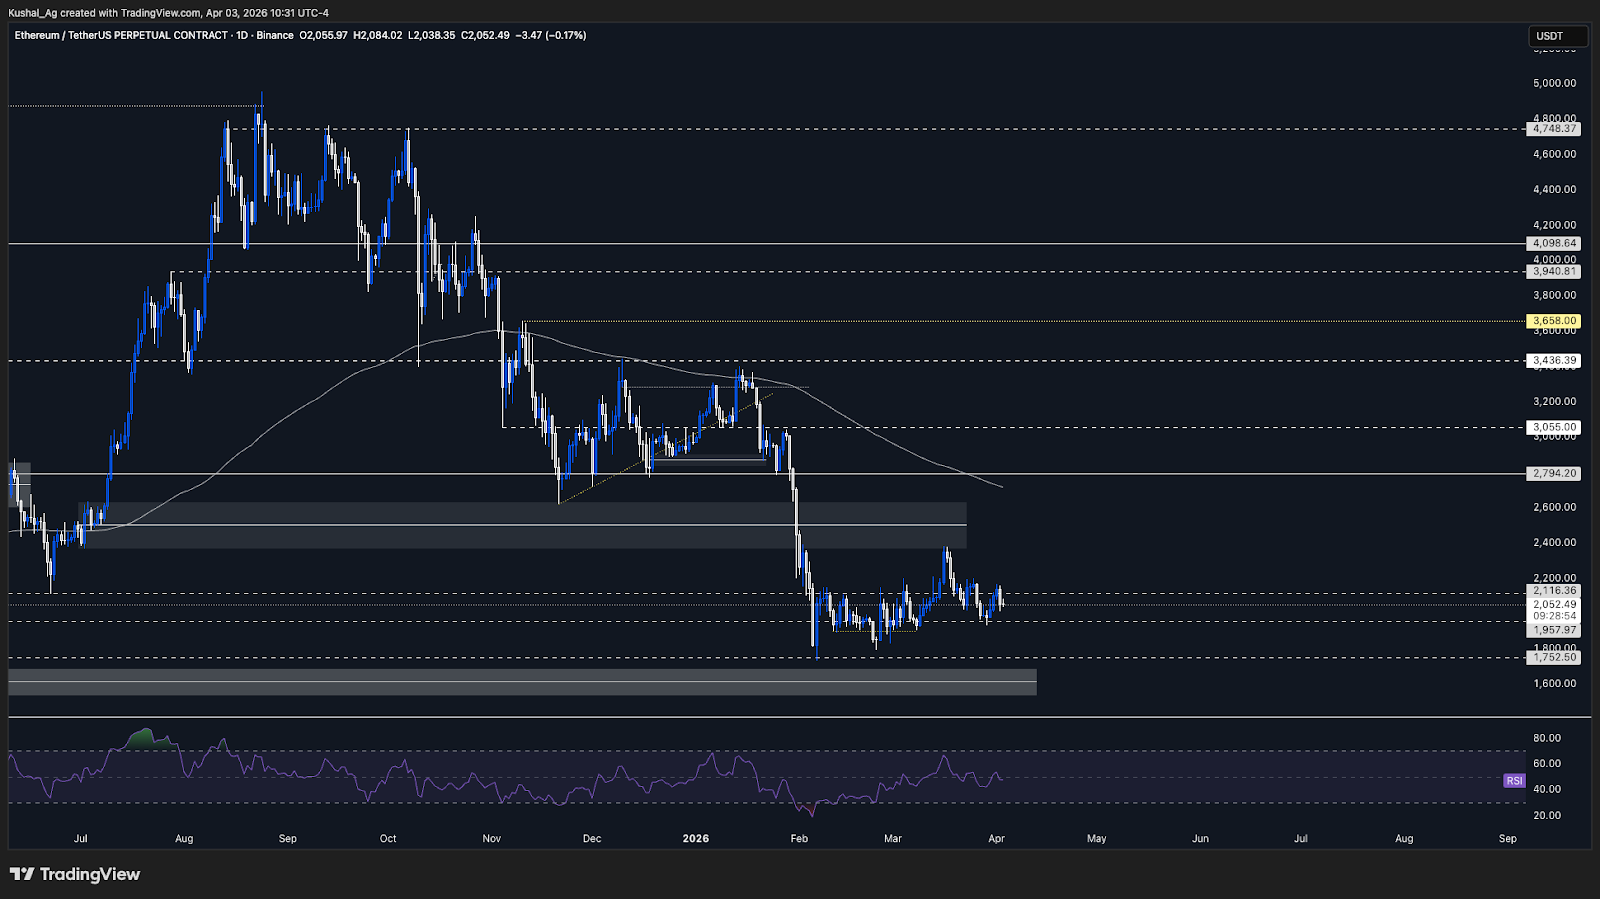
TASolana continues to trade in a range-bound structure, but we are now seeing slight weakness, with price breaking below the $80.89 level and currently holding the $78 support. This shift suggests sellers are gaining some control in the short term.
As long as $78 continues to hold, the stance remains neutral, with price likely to consolidate within the range. However, this level is now critical, as it is the last major support before a deeper move lower.
A break below $78 would confirm further weakness and open downside toward $70, followed by $67.3. In that scenario, we would pivot to a neutral-bearish stance.
On the upside, reclaiming higher levels, particularly $89, would be required to shift momentum back toward a more constructive structure, with $100 as the next upside target.
Solana is also approaching its long-term downtrend trendline, and with price compressing into this region, a rejection from this trendline could align with a breakdown below $78, making this a key area to watch for the next directional move.
The 200 EMA continues to trend downward near $123.3, while RSI remains weak around 38, reflecting sustained soft momentum since the breakdown in late March.
Solana Price Chart:
Key Levels:
- Support: $78
- Resistance: $89
- Direction: Neutral
- Upside Target: $89 & $100
- Downside Target: $70 & $67.3
Cryptonary’s Take:
Solana is showing early signs of weakness, but has not yet confirmed a breakdown. The market is currently at a critical support zone, where holding $78 keeps the structure intact, but a loss of this level would likely accelerate downside.For now, the stance remains neutral, with expectations of continued consolidation. However, this is a fragile range, and the next move will likely be dictated by whether support holds or breaks.
Hyperliquid
TAHyperliquid has continued its bearish momentum, with price now hitting the $35.37 support / downside target and even deviating below it, printing a low near $34.4 before reclaiming the level.
Following this, price has reclaimed $35.37 and is holding above it for now, suggesting a short-term stabilization after completing the initial downside move. However, the broader structure still remains weak.
The stance continues to stay neutral-bearish, with the next downside target at $33, which aligns closely with the 200 EMA ($33.5), making this a strong confluence zone to watch.
As long as price remains below $39.97 resistance, the structure favors continued weakness or consolidation, with any upside likely to be corrective unless that level is reclaimed.
The $33-$33.5 region now becomes a critical demand zone, where we will closely monitor price action for either a base formation or continuation lower.
The 200 EMA is flattening and slightly tilting upward, while RSI is around 46, indicating weak momentum after the recent selloff.
Hyperliquid Price Chart:
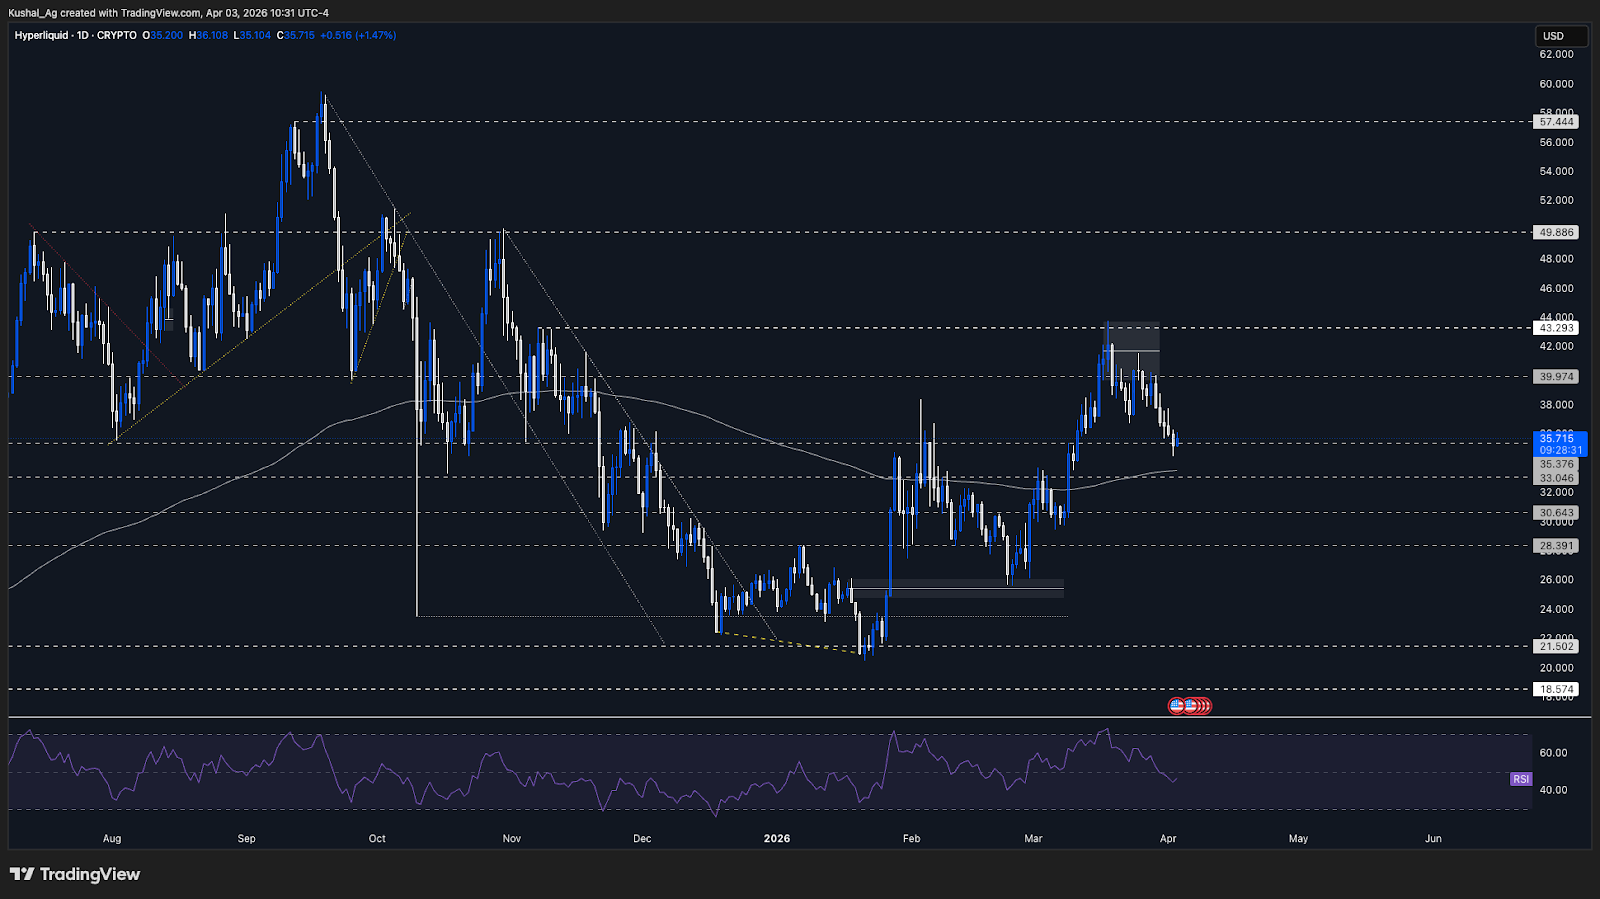
Key Levels:
- Support: $35.37
- Resistance: $39.97
- Direction: Neutral-Bearish
- Upside Target: $43.29
- Downside Target: $33
Cryptonary’s Take:
Hyperliquid has now completed its initial downside move, and the reaction from the $35 region is important in determining what comes next. While the reclaim of support suggests some short-term stabilization, the overall structure still leans weak.The focus now shifts to the $33-$35 zone, which is a high-confluence region. If this area holds, we could see consolidation or a base forming, but a breakdown would open further downside. Until strength is reclaimed above $39.97, the stance remains neutral-bearish.
Aura
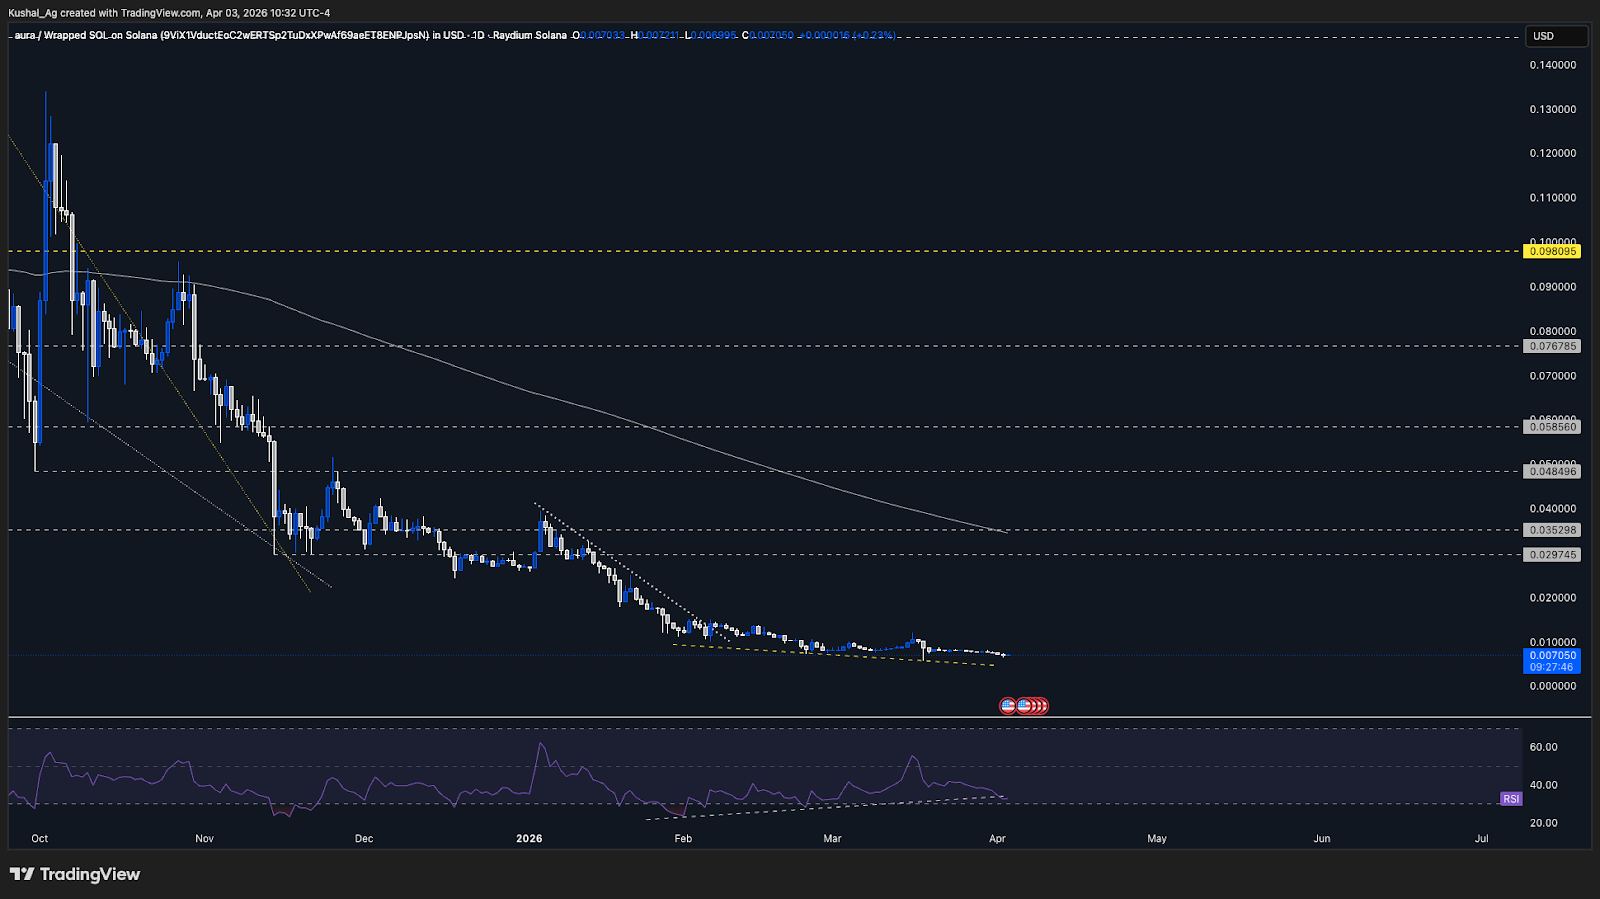
TAAura continues to trade within the same range, with no structural changes and price action remaining flat over the past sessions.
Momentum remains weak for now, with RSI near 32, approaching oversold conditions.
The 200 EMA continues to trend downward near 0.034, and overall direction remains dependent on Solana’s strength, with no independent move yet.
Aura Price Chart:
Cryptonary’s Take:
Aura remains a high-beta extension of Solana, and until we see clear outperformance in Solana, meaningful upside in Aura is unlikely. The current structure is weak, but nearing oversold conditions, which could support a bounce only if the broader market stabilizes. For now, the focus remains on Solana’s price action, as that will dictate whether Aura sees renewed strength or continues to drift sideways within its range.BTC.D + Stablecoin.D
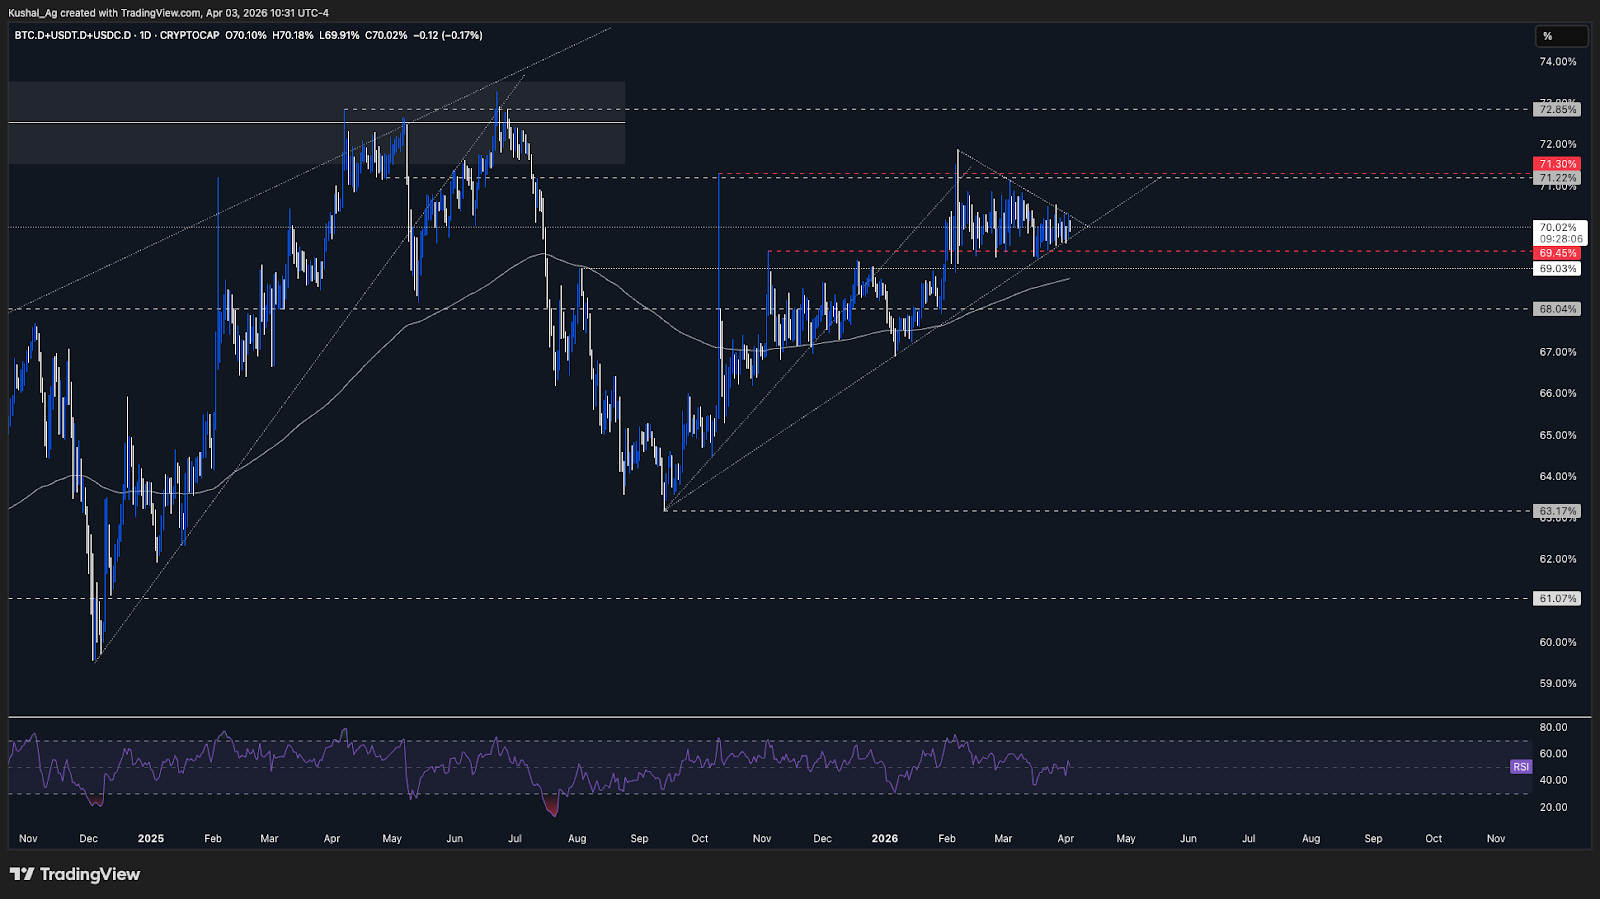
TAThe index is now testing the second major uptrend trendline that has been in play since September 2025, placing it at a key inflection point.
Price has been tightly range-bound between 69.45% and 71.3% since early February, indicating compression before a potential expansion move.
As long as the uptrend trendline holds, continuation toward 71.3% & 72.85% remains on the table, signaling continued pressure on altcoins.
A break below the trendline and 69.45% would be the first sign of weakness, opening downside toward 68.75% (200 EMA), followed by 68%.
A deeper breakdown below 68% would confirm a larger structural shift, targeting 63.17%, which would likely align with a risk-on phase for crypto.
BTC Dominance + Stablecoin Dominance Chart:
Cryptonary’s Take:
This index is now at a critical decision point, with both the uptrend and tight range nearing resolution. The direction of this breakout will likely dictate the next major phase for the market.For now, the market remains in compression, and patience is key. A confirmed breakdown would open the door for altcoin strength and broader risk-on, while holding and breaking higher would keep the environment defensive and selective.
Closing Thoughts
The market continues to stay range-bound, with all focus now on the key support regions across majors. As long as these levels hold, the base case remains choppy and sideways price action, with no clear directional expansion yet.A break below these supports would be the trigger for downside continuation across the market, and that is the primary risk we are monitoring. Until that happens, there is no reason to force a directional bias, and the stance remains neutral across majors, with Hyperliquid still leaning neutral-bearish given its relative weakness.
We have also introduced Bitcoin dominance + stablecoin dominance into the analysis, as this combined index is now at a critical pivot zone. The prolonged consolidation suggests the market is building toward a larger move, and a breakout or breakdown here could define the next phase. For now, the approach remains being patient and reactive.
Continue reading by joining Cryptonary Pro
$1,548 $1,197/year
Get everything you need to actively manage your portfolio and stay ahead. Ideal for investors seeking regular guidance and access to tools that help make informed decisions.
For your security, all orders are processed on a secured server.
As a Cryptonary Pro subscriber, you also get:
3X Value Guarantee - If cumulative documented upside does not reach 300% during your 12-month membership, you can request a full refund. Terms
24/7 access to experts with 50+ years’ experience
All of our top token picks for 2025
On hand technical analysis on any token of your choice
Weekly livestreams & ask us anything with the team
Daily insights on Macro, Mechanics, and On-chain
Curated list of top upcoming airdrops (free money)
3X Value Guarantee
If cumulative documented upside does not reach 300% during your 12-month membership, you can request a full refund.
Our track record speaks for itself
With over 2.4M tokens and widespread misinformation in crypto, we cut through the noise and consistently find winning assets.
Our track record speaks for itself
With over 2.4M tokens and widespread misinformation in crypto, we cut
through the noise and consistently find winning assets.


Frequently Asked Questions
Can I trust Cryptonary's calls?
Yes. We've consistently identified winners across multiple cycles. Bitcoin under $1,000, Ethereum under $70, Solana under $10, WIF from $0.003 to $5, PopCat from $0.004 to $2, SPX blasting past $1.70, and our latest pick has already 200X'd since June 2025. Everything is timestamped and public record.
Do I need to be an experienced trader or investor to benefit?
No. When we founded Cryptonary in 2017 the market was new to everyone. We intentionally created content that was easy to understand and actionable. That foundational principle is the crux of Cryptonary. Taking complex ideas and opportunities and presenting them in a way a 10 year old could understand.
What makes Cryptonary different from free crypto content on YouTube or Twitter?
Signal vs noise. We filter out 99.9% of garbage projects, provide data backed analysis, and have a proven track record of finding winners. Not to mention since Cryptonary's inception in 2017 we have never taken investment, sponsorship or partnership. Compare this to pretty much everyone else, no track record, and a long list of partnerships that cloud judgements.
Why is there no trial or refund policy?
We share highly sensitive, time-critical research. Once it's out, it can't be "returned." That's why membership is annual only. Crypto success takes time and commitment. If someone is not willing to invest 12 months into their future, there is no place for them at Cryptonary.
Do I get direct access to the Cryptonary team?
Yes. You will have 24/7 to the team that bought you BTC at $1,000, ETH at $70, and SOL at $10. Through our community chats, live Q&As, and member only channels, you can ask questions and interact directly with the team. Our team has over 50 years of combined experience which you can tap into every single day.
How often is content updated?
Daily. We provide real-time updates, weekly reports, emergency alerts, and live Q&As when the markets move fast. In crypto, the market moves fast, in Cryptonary, we move faster.
How does the 3X Value Guarantee work?
We stand behind the value of our research. If the documented upside from our published research during your 12-month membership does not exceed three times (3X) the annual subscription cost, you can request a full refund. Historical context: In every completed market cycle since 2017, cumulative documented upside has exceeded 10X this threshold.
TermsRecommended from Cryptonary


