Save 23% ($351) & Get a Free 1-1 Call with our Team ⏰ : 0d 2h 59m 43s
BTC, ETH and More: Key Levels Are Being Rejected
With volatility compressing and major assets colliding with critical zones, the market is setting up for its next decisive move. Some charts are stabilising, others are losing momentum, but the story they’re telling is becoming far clearer. Let’s walk through it together...

Disclaimer: This is not financial or investment advice. You are responsible for any capital-related decisions you make, and only you are accountable for the results.
Quick bridge from earlier this week…
Earlier this week, we noted that majors were pushing into key resistance zones after catching momentum off support. Since then, the market has delivered a mixed follow through. BTC managed to push through $90,200 before rejecting from $93,150, the neckline of its potential daily double bottom formation. ETH reclaimed $3,055 and moved higher into its next range, printing a local high near $3,240 before starting to chop, but the reclaim held. SOL also pushed above $140 briefly but failed to hold, sliding back into its prior range. HYPE pushed into $35.37 but faced strong supply again and retraced back inside the same range it was trading in as before.In short, several resistance levels were reclaimed on the first attempt, but not all held. The broader takeaway is that buyers are active at support and can force moves into resistance, but sellers are still defending those upper zones aggressively.
Most majors are now sitting right at or just above their reclaimed support levels, which have once again become the critical pivot points. The next move depends on whether these levels flip into stable support or whether price continues to reject and retrace back into the lower ends of the ranges.
TLDR
- BTC: BTC reclaimed $90,200 but rejected from $93,150. Still range bound. Needs a clean break above $93,150 for continuation, $90,200 must hold.
- ETH: ETH reclaimed $3,055 and is now trading inside the $3,055-$3,436 range. Neutral until a retest of $3,055 holds and momentum pushes toward the range high.
- SOL: SOL failed to hold above $140 again and rotated back into its lower range. Neutral-bearish while below $140.43, $126.15 remains key support.
- HYPE: HYPE rejected strongly from $35.37 and fell back into the lower range. Neutral-bearish unless $33.04 is reclaimed, with $35.37 as the key breakout level above.
BTC
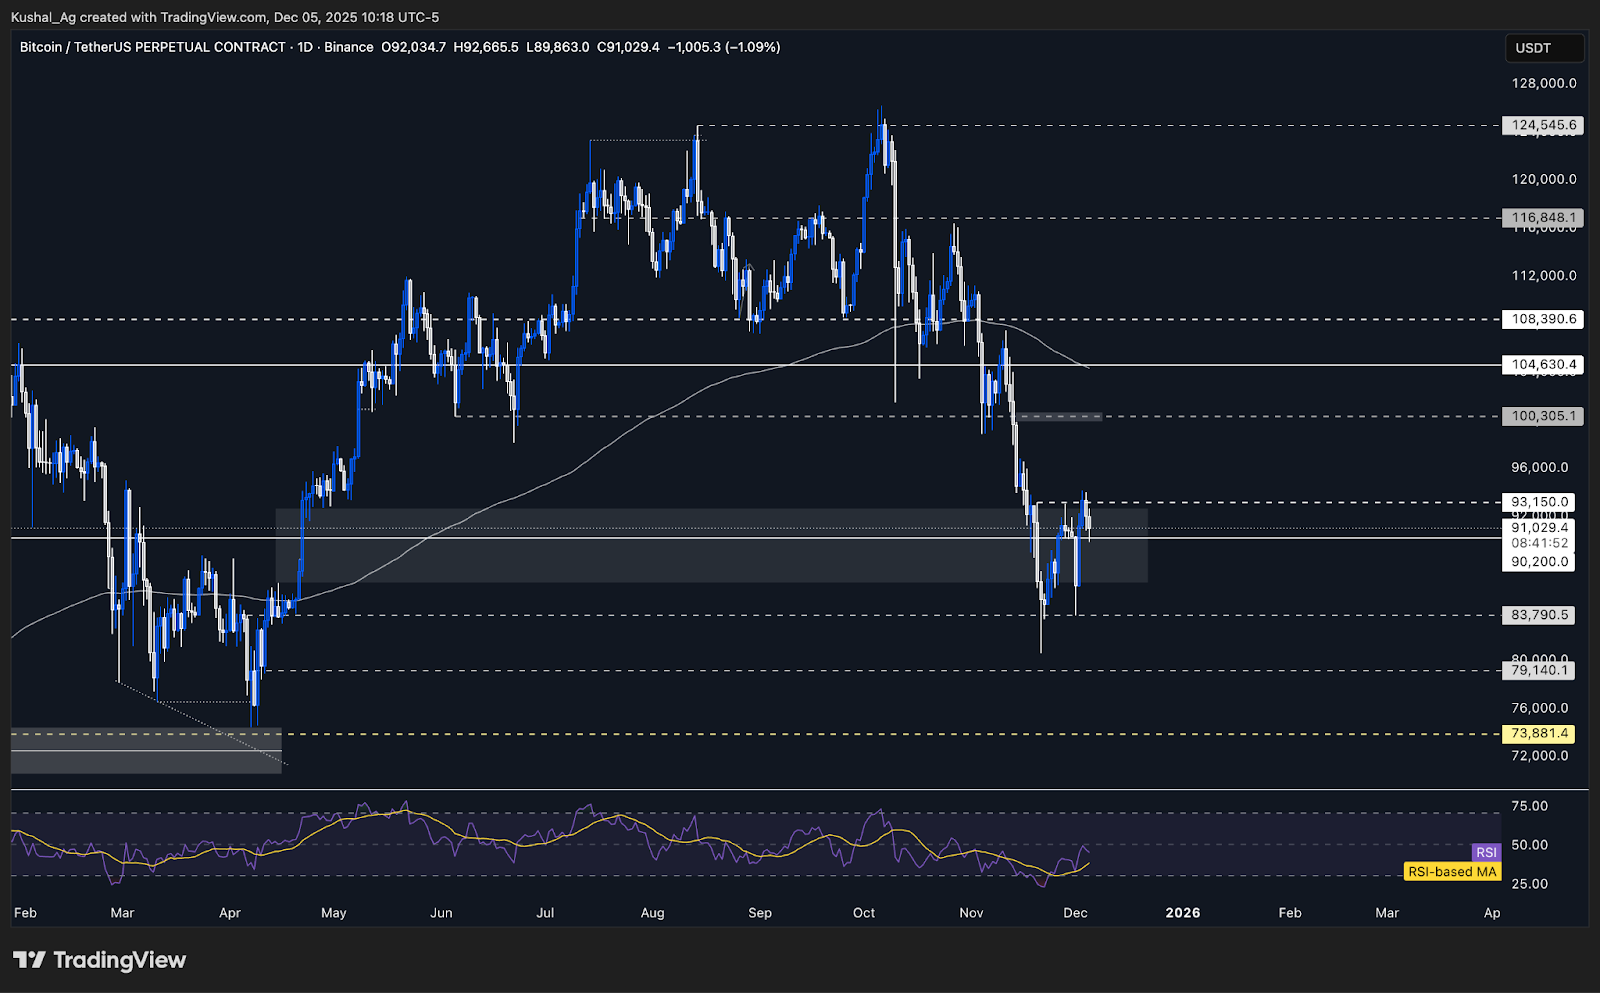
TA:In the last update, BTC was pushing into the $90,200 resistance. Since then, price reclaimed the level but rejected from $93,150, which acts as the neckline of a potential double bottom formation on the daily timeframe.
This makes $93,150 a critical breakout level for BTC, clearing it would open room for continuation toward six figures.
BTC is now ranging between $90,200 support and $93,150 resistance, similar to the tight consolidation seen in late November before the December 1st flush.
The upside target remains $100,300, while the downside target is $86,450 if support at $90,200 fails.
RSI is recovering but still soft, trading around 44 with average at 38. Momentum improves only if price can sustain above $90,200 and challenge $93,150 again. The 200 EMA sits near $104,300, mostly unchanged from earlier this week.
Key Levels:
- Next Support: $90,200
- Next Resistance: $93,150
- Direction: Neutral
- Upside Target: $100,300
- Downside Target: $86,450
Cryptonary’s Take:
BTC continues to grind within a narrow range, with $90,200 acting as the line in the sand. As long as price holds above this area, the structure remains stable and the path back toward $93,150 stays open. A clean break above $93,150 would confirm the daily neckline break and significantly strengthen the case for continuation toward $100,300 and beyond.However, losing $90,200 would weaken the short term structure and bring $86,450 back into play. That scenario would make the chart more fragile and delay any attempt at upside expansion. For now, BTC remains neutral inside a well defined range, and the next move depends entirely on whether $90,200 can continue to act as reliable support.
ETH
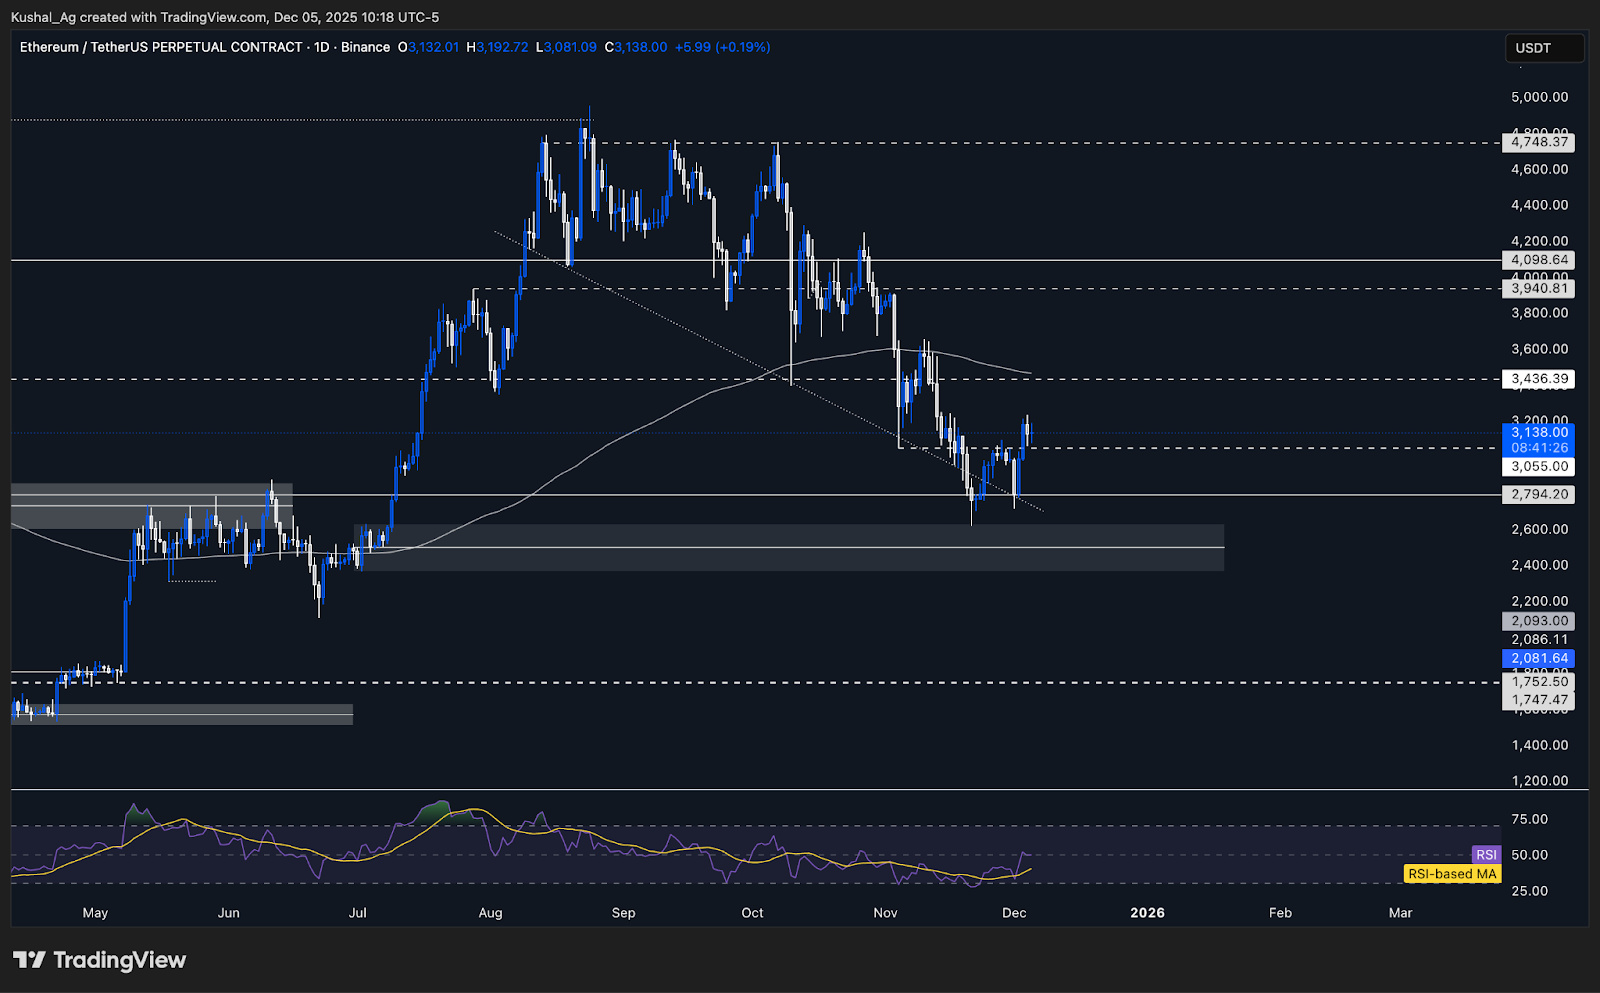
TA:On Tuesday earlier this week, ETH was pushing into the $3,055 resistance. Since then, price has cleanly reclaimed this level and moved higher into the next range.
ETH made a local swing high around $3,240, placing price firmly inside the new range between $3,055 (support) and $3,436 (resistance).
A retest of $3,055 has not yet occurred, so a pullback toward this level remains possible. Even a brief liquidity sweep into the $2,980 area could still form part of a healthy retest before continuation.
If price holds above $3,055 and reclaims $3,436, the next upside target becomes $3,660, while the downside target on a breakdown is $2,794.
RSI has recovered well, now hovering around 49 with average at 40, shifting from oversold back into neutral territories. The daily 200 EMA sits around $3,470, just above the range high, forming a major supply cluster.
Key Levels:
- Next Support: $3,055
- Next Resistance: $3,436
- Direction: Neutral
- Upside Target: $3,660
- Downside Target: $2,794
Cryptonary’s Take:
ETH has made meaningful progress by reclaiming $3,055 and pushing into the upper half of the range. The break above the double bottom neckline adds constructive momentum to the structure, but the chart still needs to show whether $3,055 can hold as a firm support zone. A retest of this level would be normal and, if defended, would strengthen the foundation for a push toward $3,436 and eventually $3,660.However, the upper end of the range presents a significant supply cluster. The combination of $3,436 resistance and the 200 EMA around $3,470 will make this area difficult to break on the first attempt. ETH will need a strong catalyst or broader market strength to push cleanly through that zone.
For now, we maintain a neutral stance. ETH has taken an important step forward in structure, but confirmation requires sustained holding above $3,055 and a strong response when price reaches the range high. A breakdown below $3,055 would delay the bullish thesis and reopen $2,794.
SOL
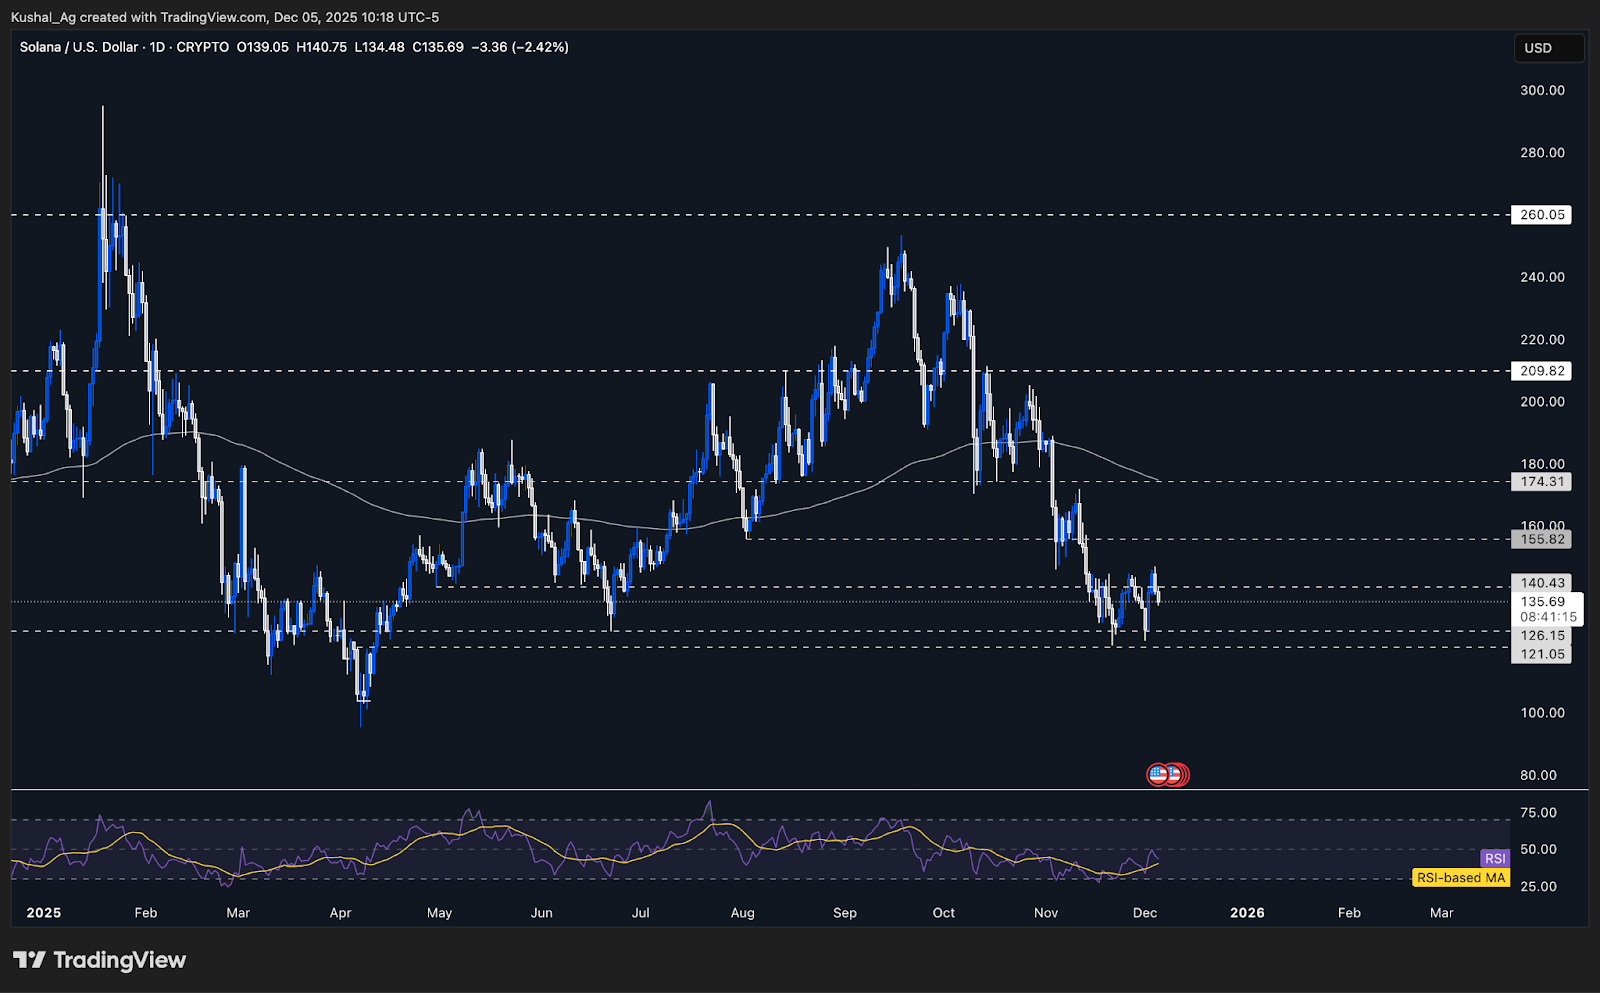
TA:SOL attempted to reclaim $140.43 again, briefly trading above it, but failed to hold the level and rejected immediately on the following candle.
Price is now back inside the same range as before, with $140.43 acting as resistance and $126.15 as support. The downside target remains $121.05, while the upside target is $155.82 if Solana can break the range high.
There is also potential intermediate support around $133, which may come into play if broader market conditions remain constructive.
The daily 200 EMA is trading near $174.6 and is now sloping downward, reflecting weakening higher timeframe momentum.
RSI briefly pushed toward neutral but rolled over again, now hovering around 43 with average around 40, indicating that momentum remains subdued.
Key Levels:
- Next Support: $126.15
- Next Resistance: $140.43
- Direction: Neutral-Bearish
- Upside Target: $155.82
- Downside Target: $121.05
Cryptonary’s Take:
SOL has now failed its reclaim attempt of $140 for the second time, reinforcing the idea that this resistance carries meaningful supply. Until Solana can close above $140.43 and build a stable base for multiple days, buyers remain on the back foot and short-term structure leans cautiously lower.The broader range remains intact, but the inability to hold above $140 keeps SOL stuck in the lower half of its structure. Support at $126.15 continues to be the critical line for bulls, losing this level would expose $121.05 and weaken the chart further. On the flip side, a clean reclaim of $140.43 would neutralize the current bias and open the way toward $155.82.
For now, we maintain a neutral-bearish stance. Momentum remains weak, the 200 EMA is sloping down, and repeated rejection at $140 signals the presence of active sellers. A meaningful shift in behaviour requires a reclaim of the range high which is $140.43.
HYPE
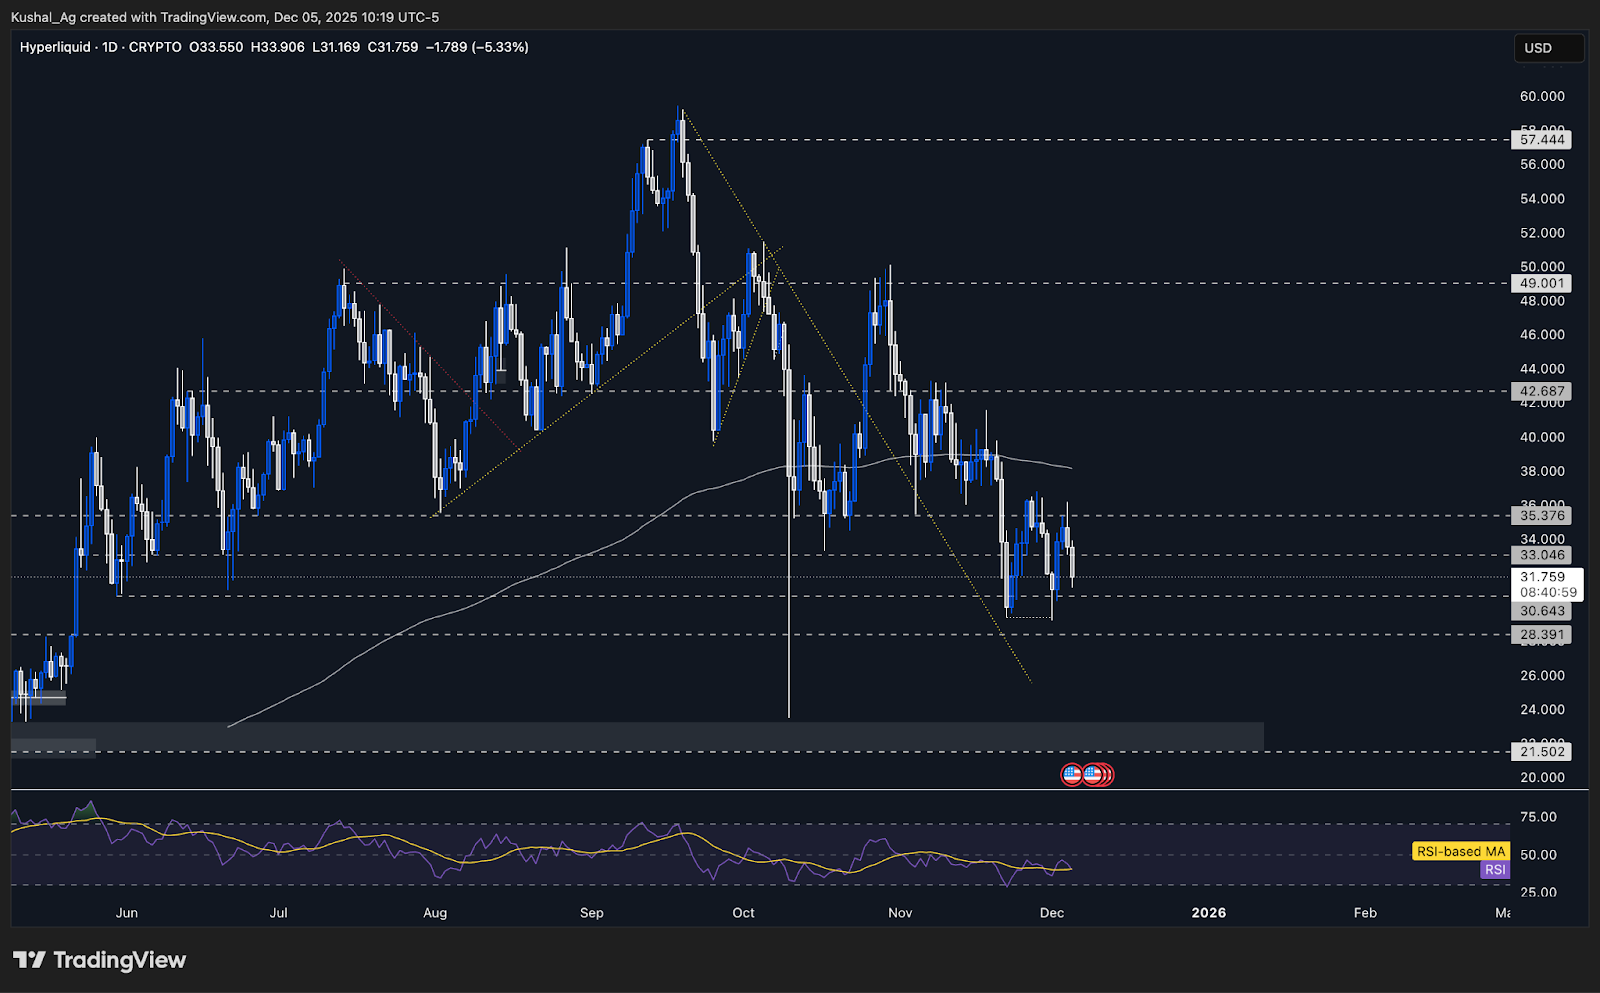
TA:Previously, HYPE was pushing into the $33.04 resistance and briefly reclaimed it, moving toward $35.37.
Price faced a strong rejection at $35.37, immediately losing momentum and failing to hold above $33.04. It has since rotated back into the lower range.
HYPE is now trading between $33.04 (resistance) and $30.64 (support), with $28.39 as the next downside target. The upside target remains $35.37, which has repeatedly acted as a major supply zone.
The daily 200 EMA is still flattened around $38.10, indicating choppy higher timeframe momentum and a lack of clear directional bias.
RSI is soft around 39 with average at 40, reflecting weak follow through after the heavy rejection at $35.37.
Key Levels:
- Next Support: $30.64
- Next Resistance: $33.04
- Direction: Neutral-Bearish
- Upside Target: $35.37
- Downside Target: $28.39
Cryptonary’s Take:
HYPE continues to show signs of weakness, with the latest rejection at $35.37 reinforcing this level as a dominant ceiling in the current structure. The inability to sustain above $33.04 and the rotation back into the lower range keeps the short-term outlook neutral-bearish, especially with RSI and the 200 EMA both reflecting a lack of positive momentum.For sentiment to shift, HYPE must reclaim $33.04 first, and more importantly $35.37, as this level has consistently attracted sellers. A reclaim of the 200 EMA around $38.10 would be the technical trigger required for a broader trend reversal. Until then, HYPE is likely to remain range bound with a downward lean.
We maintain a neutral-bearish stance. Stronger structural signals are required before considering a shift toward a more constructive outlook.
Closing Thoughts
BTC and ETH have reclaimed the resistance levels we’ve been tracking, while SOL and HYPE remain under pressure after failing to hold their breakouts. ETH is currently the stronger one in this lot, holding above the $3,000 region, and if it can maintain a base here, a push toward $3,500 becomes likely, a move that could lift broader altcoin momentum as well.With the FOMC meeting on December 9-10, some de-risking is normal, and intraday wicks below support shouldn’t be mistaken for structural breaks. What matters now is whether majors can convert these reclaimed levels into true support through strong bases. If they do, continuation becomes the base case.
Recommended from Cryptonary


