Save 35% ($551) & Get a Free 1-1 Call with our Team ⏰ : 0d 2h 59m 44s
BTC, ETH and More: Major Altcoins Test Breakouts
After weeks of choppy price action, majors are reclaiming key levels and taking liquidity, but most are now sitting just below major resistance and trendlines. This is a critical decision zone — and in this report, we break down what confirms a breakout vs. another range move.

Disclaimer: This is not financial or investment advice. You are responsible for any capital-related decisions you make, and only you are accountable for the results.
Quick bridge from earlier this week…
In the previous analysis, we maintained a neutral stance across most majors, with a neutral-bearish view on Hyperliquid, while expecting Bitcoin to tap its $71,500 upside liquidity. Since then, Bitcoin has delivered that move, pushing through resistance and completing the pending liquidity target. This move has also driven strength across majors, with Ethereum validating its breakout above $2,170 and shifting its stance.Solana has also broken out of its long-term downtrend, although follow-through remains limited so far, keeping it within a broader range structure. Hyperliquid, on the other hand, has shown relative strength and invalidated the neutral-bearish thesis by reclaiming key resistance at $39.97, leading us to reassess the structure and shift stance in this analysis. Alongside this, we have added Total Market Cap into today’s MD, as price is now approaching a key zone near resistance and the broader downtrend.
On the macro side, the backdrop remains uncertain. Markets have moved higher on potential US-Iran de-escalation and short positioning squeezes, but developments remain fragile with peace talks still unclear and key disruptions in the region persisting. At the same time, elevated oil prices and higher inflation continue to limit the Fed’s ability to cut rates, keeping the broader environment unsupportive. For a deeper breakdown, refer to today’s Market Update.
Disclaimer: This content is for informational and educational purposes only. It does not constitute financial advice, and should not be relied upon as a basis for making investment decisions. Virtual assets are volatile and may lose their value in full. Past performance does not indicate future results. Always do your own research.
TLDR
- Risk Posture: Neutral
- Bitcoin: BTC has broken above $70,500 and tapped $71,500 liquidity, now attempting to hold above former resistance. The stance remains neutral, with $73,800 as the next key level, while a loss of $70,500 brings $65,650-$62,800 back into focus.
- Ethereum: ETH has broken above $2,116 and $2,170, validating a shift to a neutral-bullish stance. Holding above these levels opens continuation toward $2,400-$2,500, while a loss of support brings $1,957 into play.
- Solana: SOL has broken its long-term downtrend but lacks follow-through. The stance remains neutral, with a move toward $89-$93.1 possible, while a breakdown below $80.89 brings $78 and lower levels back into focus.
- Hyperliquid: HYPE has broken above $39.97, invalidating the neutral-bearish stance. The stance is now neutral, with strength above current levels opening $43.7 and potentially $50, while a loss of support brings $35.37 back into play.
- Aura: AURA remains range-bound with low momentum, with direction dependent on broader market strength, particularly Solana.
- Total Market Cap: TOTAL remains range-bound but is now testing key resistance at $2.46T and the downtrend trendline. A breakout opens $2.65T-$2.72T, while failure keeps the range intact.
Bitcoin
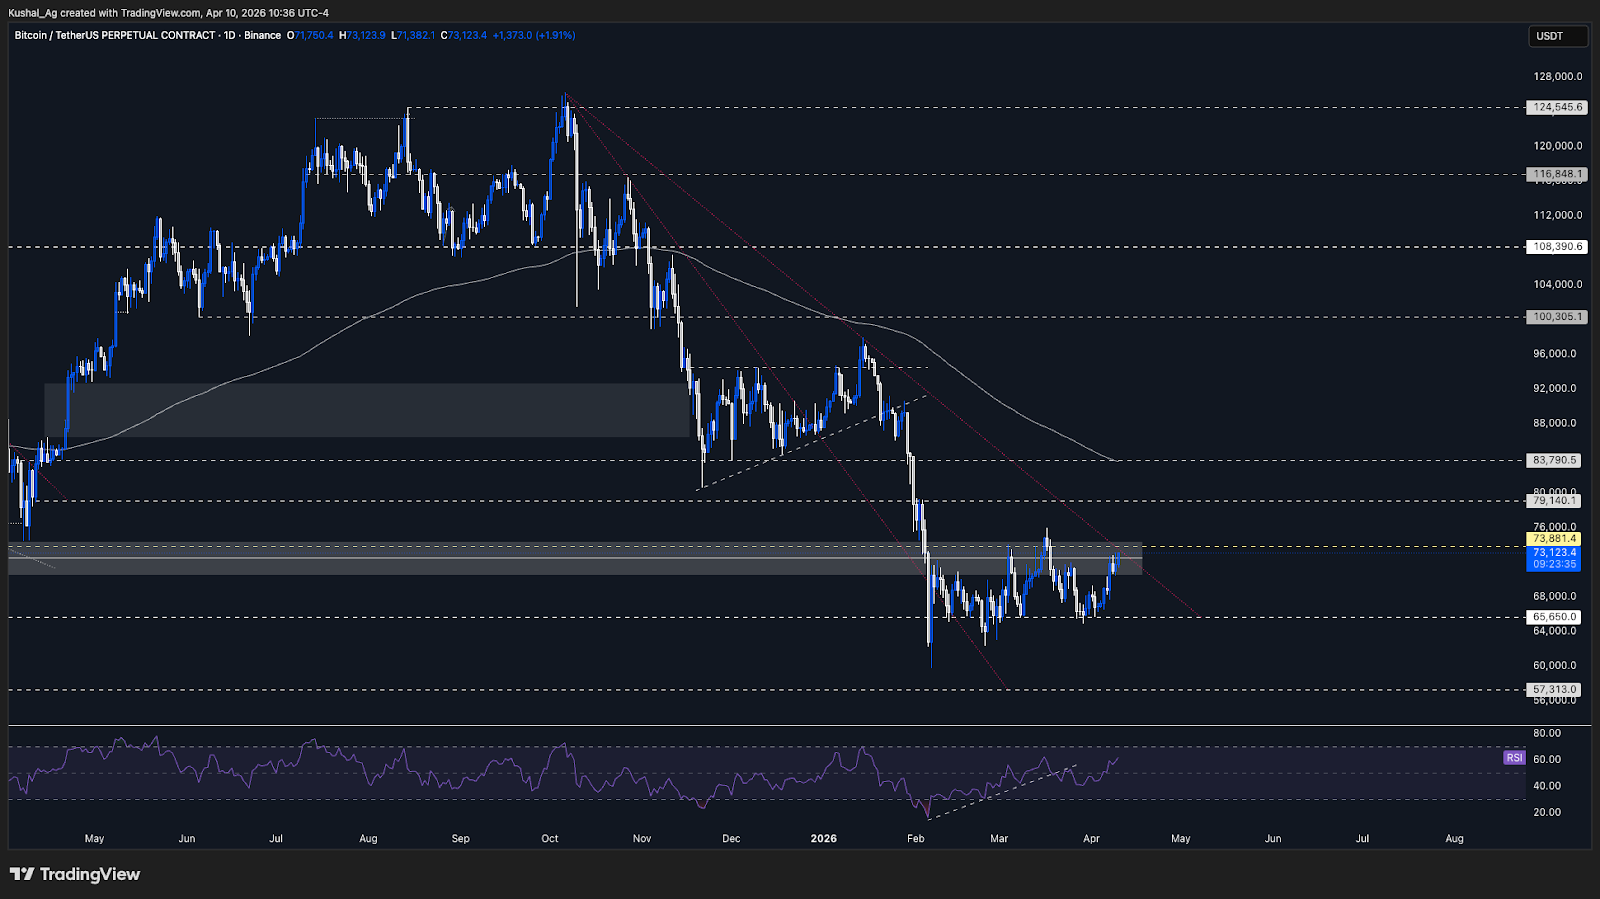
TASince the previous analysis, Bitcoin has delivered the upside move we were tracking, with price pushing through the $70,500 resistance and tapping the $71,500 upside liquidity, which had been pending for a while. This move has now been completed.
More importantly, price is now attempting to hold above $70,500, which has flipped from resistance into support. This shift is important, as Bitcoin is trying to build a base above this level in the short term.
However, the structure is now moving into a key area. Bitcoin is trading just below the long-term downtrend trendline in place since October 2025. This becomes the immediate region to watch, as it will likely determine whether this move extends further or stalls.
On the upside, $73,800 remains the next key level, which is yet to be tapped. A clean break above the downtrend trendline, followed by sustained acceptance above $73,800, would be required to shift structure and move toward $79,140. Until that happens, this still remains within a broader range structure.
On the downside, $70,500 now acts as immediate support. A loss of this level would bring the structure back into the range, with $65,650 and $62,800 coming back into focus.
The 200 EMA continues to trend downward near $83,600, reflecting broader weakness, while RSI has recovered to around 60, showing improved momentum but still awaiting confirmation through price.
Key Levels:
- Support: $70,500
- Resistance: $73,800
- Direction: Neutral
- Upside Target: $79,140
- Downside Target: $65,650 & $62,800
Cryptonary’s Take:
Bitcoin has shown short-term strength by breaking above $70,500 and completing the move into $71,500, but the real test now lies just ahead. Price is sitting right below the long-term downtrend, making this a key decision zone.Holding above $70,500 is constructive, but without a breakout above the trendline and $73,800, this still looks like a move within a broader range. For now, the stance remains as is, with focus on how price reacts in this region. A breakout would open the next leg higher and make us reassess our current stance.
Ethereum
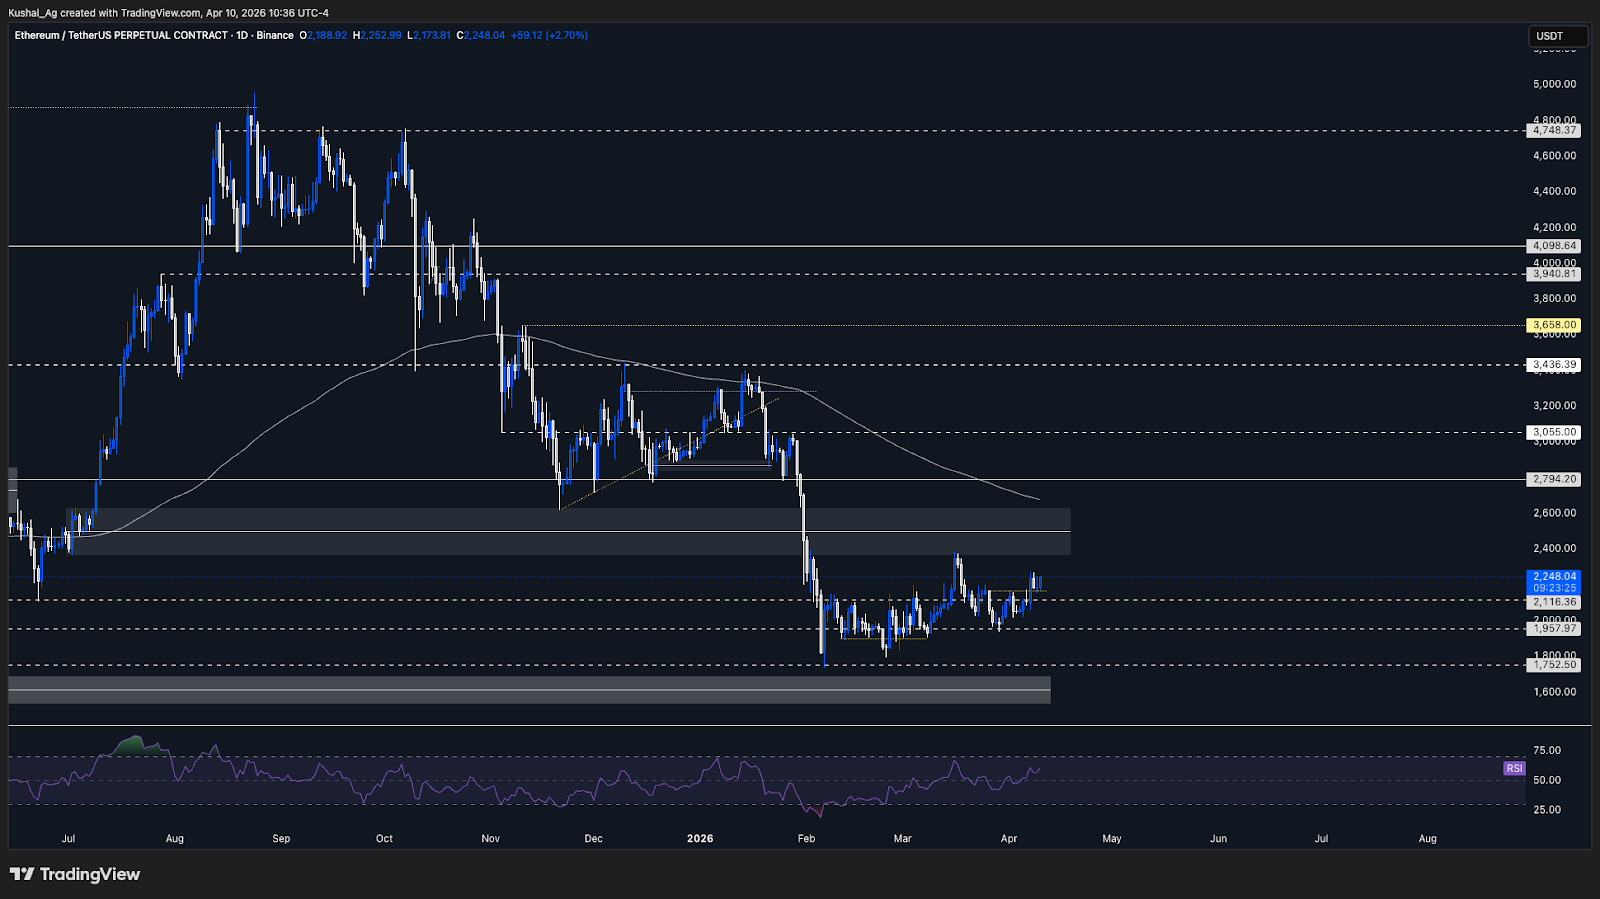
TAEthereum has now broken above both the $2,116 resistance and the $2,170 level, which was the previous upside liquidity target. This confirms the breakout we were tracking, and the trigger for shifting stance to neutral-bullish has now been validated.
Since the breakout, price is attempting to hold and build a base above the $2,170 region. This is important, as holding above this zone confirms strength and shifts the structure away from a range into a more constructive setup.
As long as Ethereum continues to hold above $2,170 and $2,116, the expectation remains for continuation toward $2,400, which now acts as the next key resistance and upside target. A further extension toward $2,500 remains possible if momentum sustains.
On the downside, a loss of $2,170 would weaken the current structure, bringing $1,957 and $1,820 back into focus. However, for now, the breakout remains intact and structure leans constructive.
The 200 EMA continues to trend downward near $2,677, reflecting broader weakness, while RSI is around 58, showing improving momentum and supporting the current move higher.
Key Levels:
- Support: $2,170 & $2,116
- Resistance: $2,400
- Direction: Neutral-Bullish
- Upside Target: $2,400 & $2,500
- Downside Target: $1,957 & $1,820
Cryptonary’s Take:
Ethereum has confirmed strength by breaking above key resistance levels and holding above them, validating the shift to a neutral-bullish stance. The focus now is on whether price can sustain above this breakout zone and continue toward higher targets.At the same time, the ETH/BTC chart is at a key point. Price is trading just below the short-term downtrend trendline, and a strong daily close above 0.0315 would confirm a breakout. This would likely lead to Ethereum outperforming Bitcoin, with a move toward 0.034 on the table (8-10% outperformance).
If both ETH/USD and ETH/BTC continue to hold strength, it strengthens the case for further upside. The stance remains neutral-bullish, with structure supporting continuation as long as key levels hold.
Solana
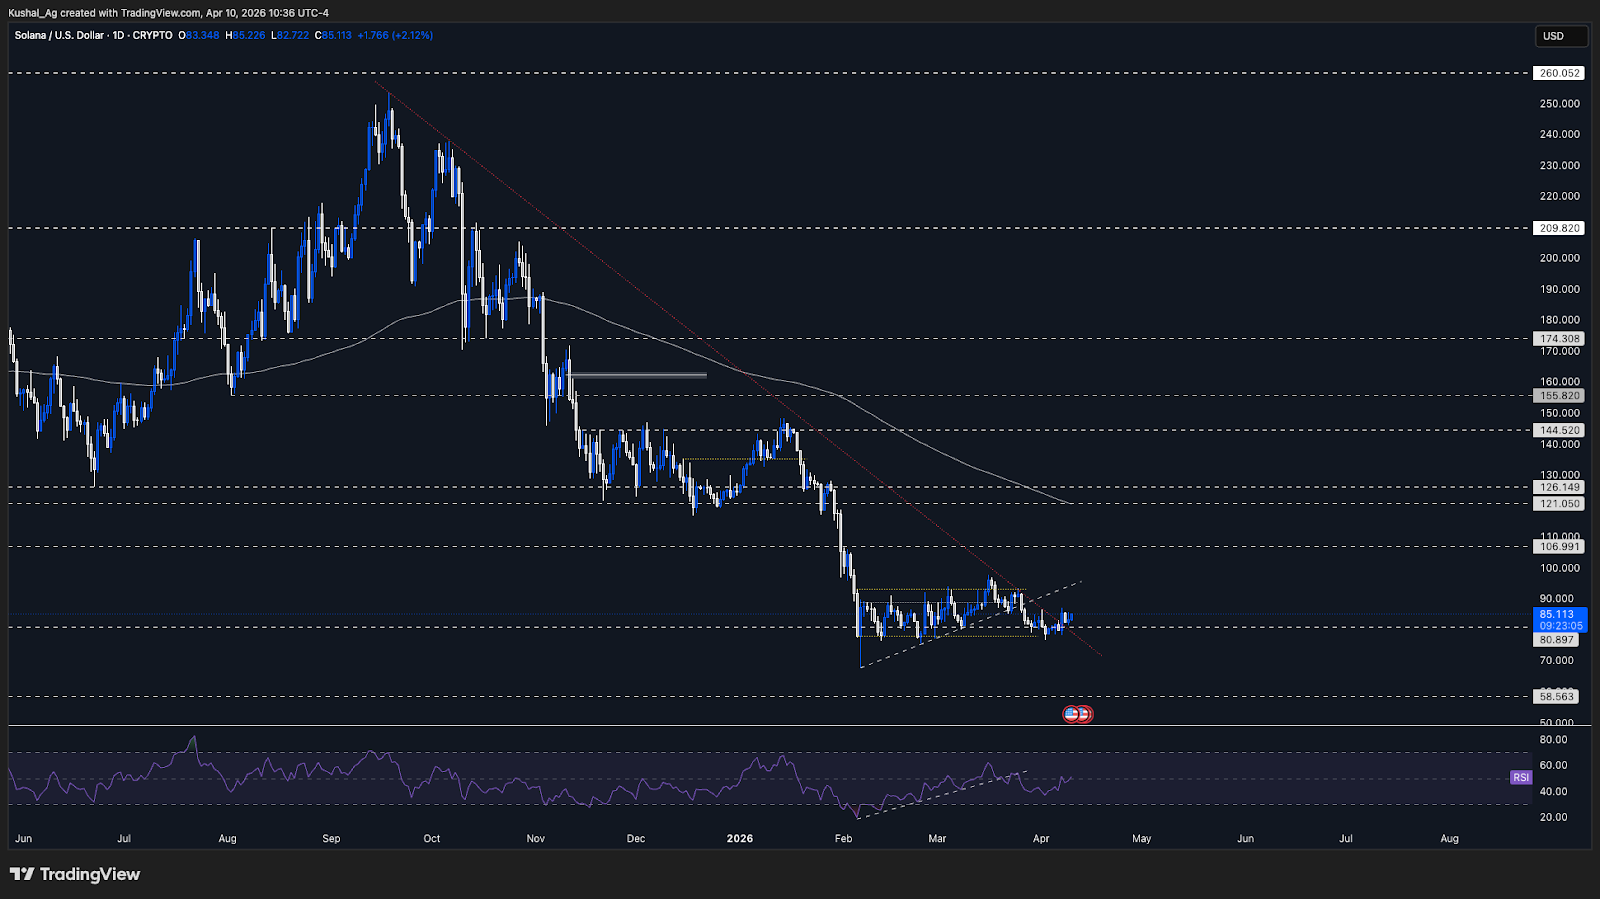
TASolana has broken out of the long-term downtrend trendline that has been in place since September 2025, with price holding above the breakout and consolidating just above the $80.89 support region.
This shifts the short-term structure slightly constructive. While follow-through has been limited so far, the fact that support continues to hold post-breakout keeps the breakout in play for now.
As long as $80.89 continues to hold, the base case leans toward sideways consolidation with a bullish bias, with potential for price to push toward the range highs at $89 and $93.1. A move into this region is likely if strength continues across majors.
However, confirmation is still required. Price needs to hold this base and build acceptance above current levels for the breakout to fully materialize into continuation.
On the downside, a loss of $80.89 followed by a break below $78 would invalidate the current setup and shift structure back toward weakness, opening $70 and $67.3.
The 200 EMA continues to trend downward near $120.6, reflecting broader weakness, while RSI is around 48, recovering into neutral territory but still slightly lagging.
Key Levels:
- Support: $80.89 & $78
- Resistance: $89 & $93.1
- Direction: Neutral-Bullish
- Upside Target: $100
- Downside Target: $70 & $67.3
Cryptonary’s Take:
Solana has broken out of its long-term downtrend and is now holding above key support, keeping the breakout structure intact in the short term. While continuation has not fully materialized yet, the setup is leaning constructive.If price is able to hold this base and build strength, a move toward the range highs becomes likely. For now, the stance shifts to neutral-bullish, with confirmation dependent on sustained strength above current levels.
Hyperliquid
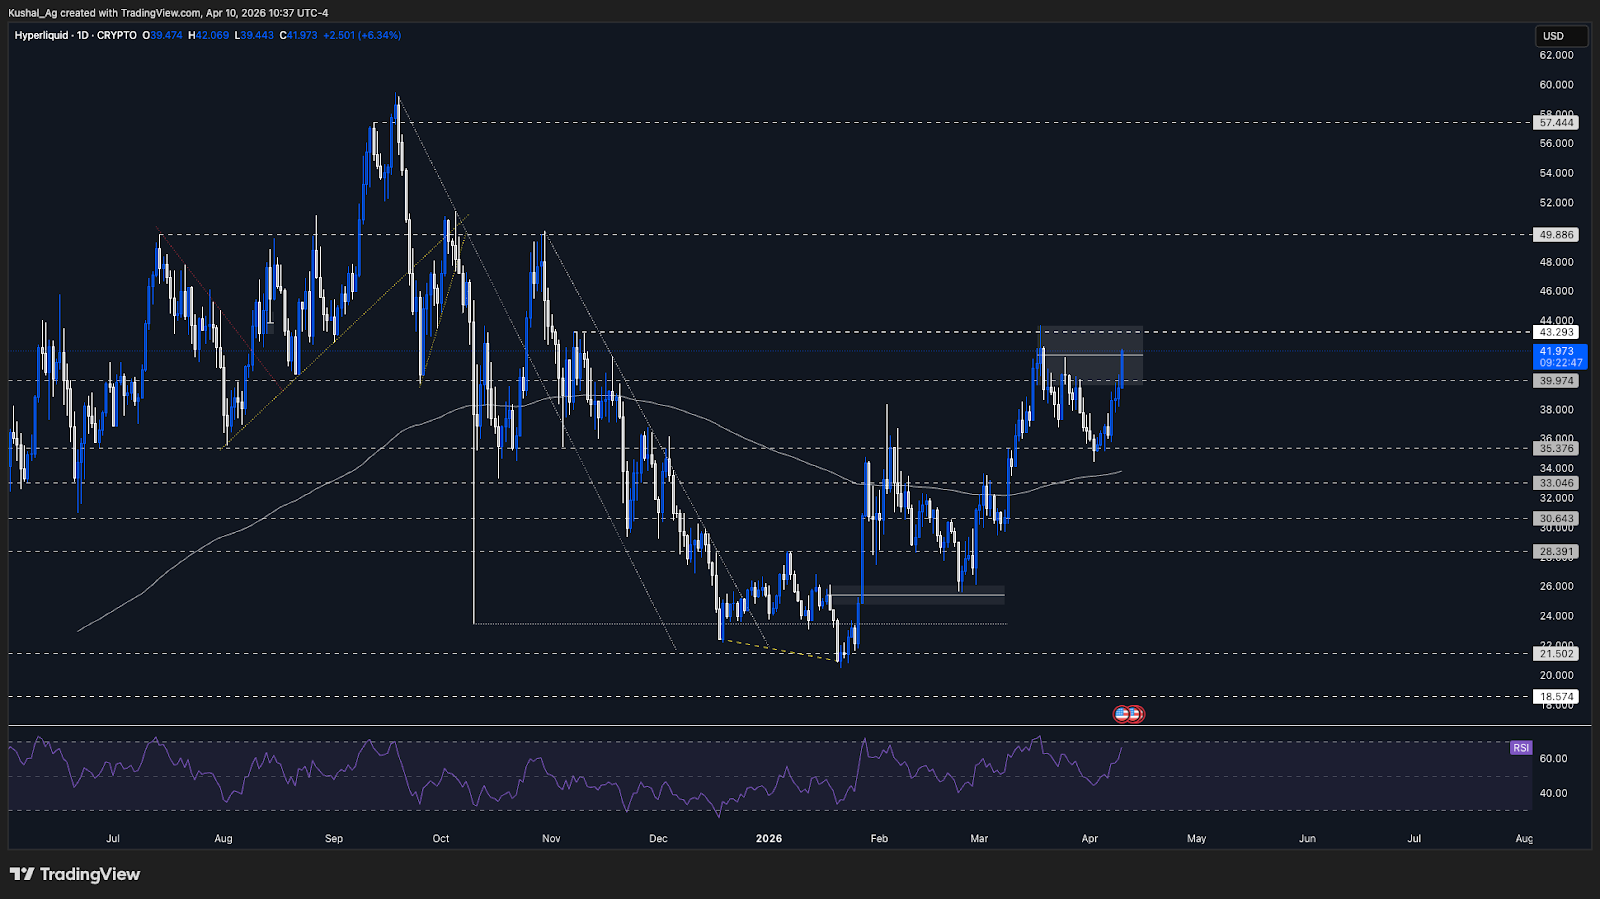
TAHyperliquid has shown relative strength since reacting from the $35.37 region, with price now pushing higher and breaking above the $39.97 resistance, which was also our invalidation level for the neutral-bearish stance.
Initially, price did see some rejection from this region, but the recent impulse move has pushed it cleanly above resistance, bringing price back into the daily sell order block from where the previous rejection occurred. With this move, the prior neutral-bearish stance is now invalidated, and we shift back to a neutral stance.
Price is now trading around the midpoint of this sell order block, near $41.7, with the upper bound of the zone coming in around $43.7. This becomes the immediate area to watch, as price reaction here will determine the next move.
If price is able to hold above $39.97 and show strength or consolidation within this region, it would support a shift toward a more constructive structure. A confirmed break above $43.7 on the daily timeframe would be required to move toward a neutral-bullish stance, opening upside toward $50.
On the downside, a loss of $39.97 would weaken the current move and bring $35.37 back into focus.
The 200 EMA continues to trend upward near $33.85, with Hyperliquid still trading above it, highlighting relative strength compared to other majors. RSI is around 66, reflecting strong momentum after the recent move.
Key Levels:
- Support: $39.97
- Resistance: $43.29 & $43.7
- Direction: Neutral
- Upside Target: $50
- Downside Target: $35.37
Cryptonary’s Take:
Hyperliquid has shifted structure in the short term, with the move above $39.97 invalidating the previous neutral-bearish stance. The asset is now showing relative strength and trading back inside the prior sell zone.The focus now is on how price behaves within this region. Acceptance and consolidation here would support a move higher, while rejection would suggest this is still a reactive move within a broader structure. For now, the stance remains neutral, with a potential shift toward neutral-bullish only if price confirms strength above the $43.7 region.
Aura
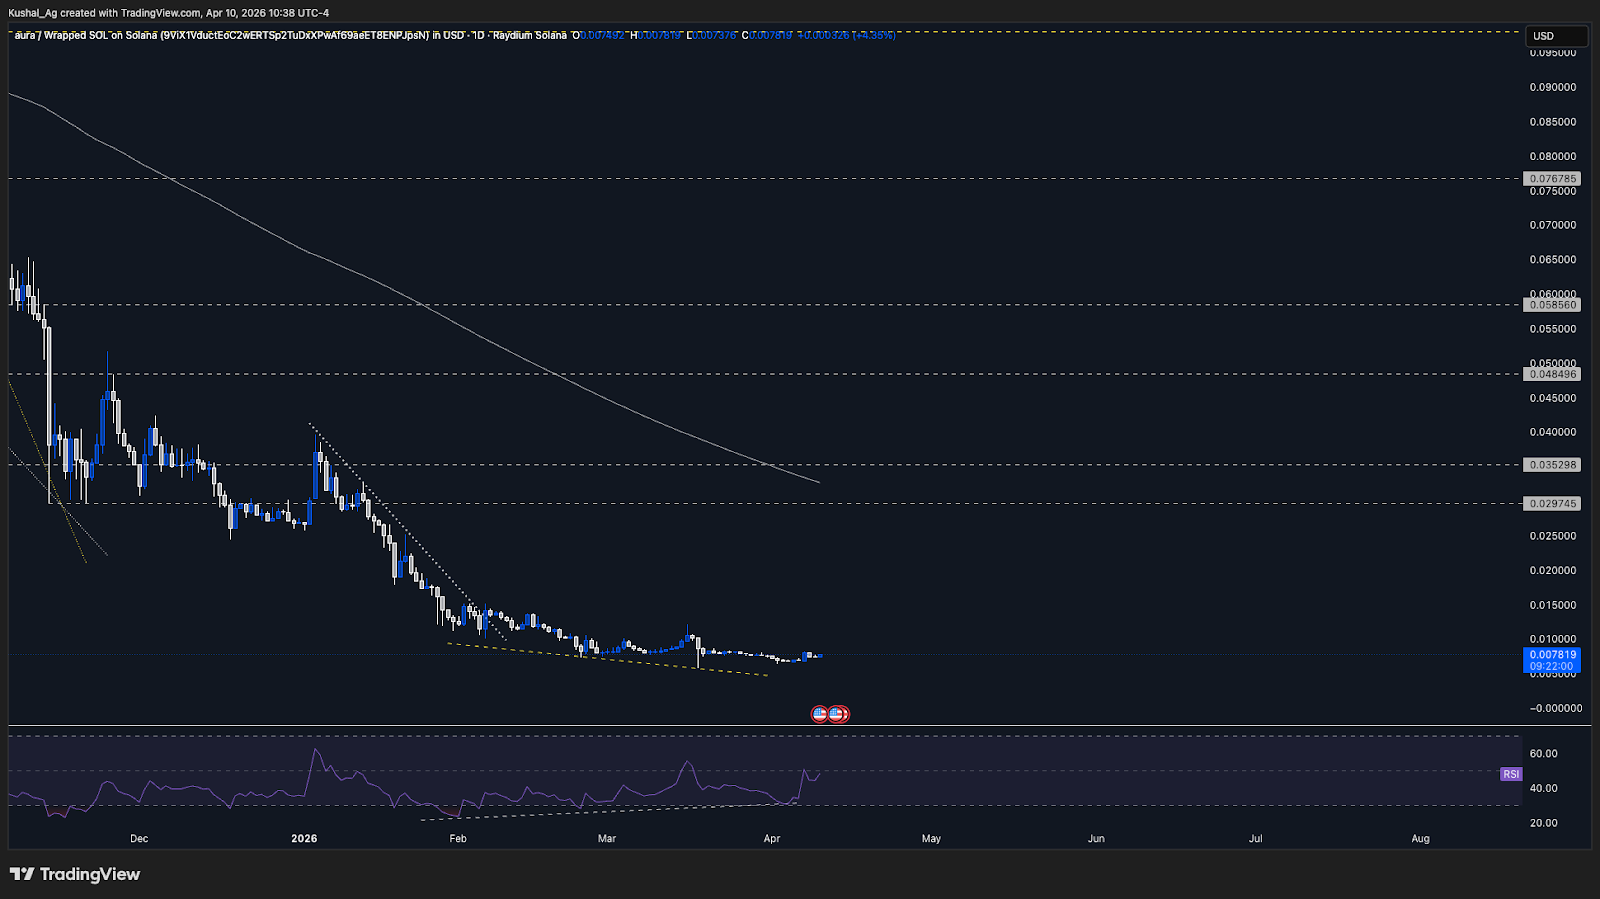
TAAura continues to trade sideways on the daily timeframe, with no structural change and price remaining within its broader range.
The asset remains dependent on broader market strength, particularly Solana, for any meaningful move, with no independent momentum visible just yet.
The 200 EMA continues to trend downward near 0.0327, while RSI has recovered to around 47, moving back into neutral territory but still lacking strong momentum.
AURA/USD Chart:
Cryptonary’s Take:
Aura remains a passive asset in the current environment, with structure still flat and dependent on external strength. Until we see a clear move in Solana and the broader market, Aura is likely to continue trading sideways for now.Total Market Cap
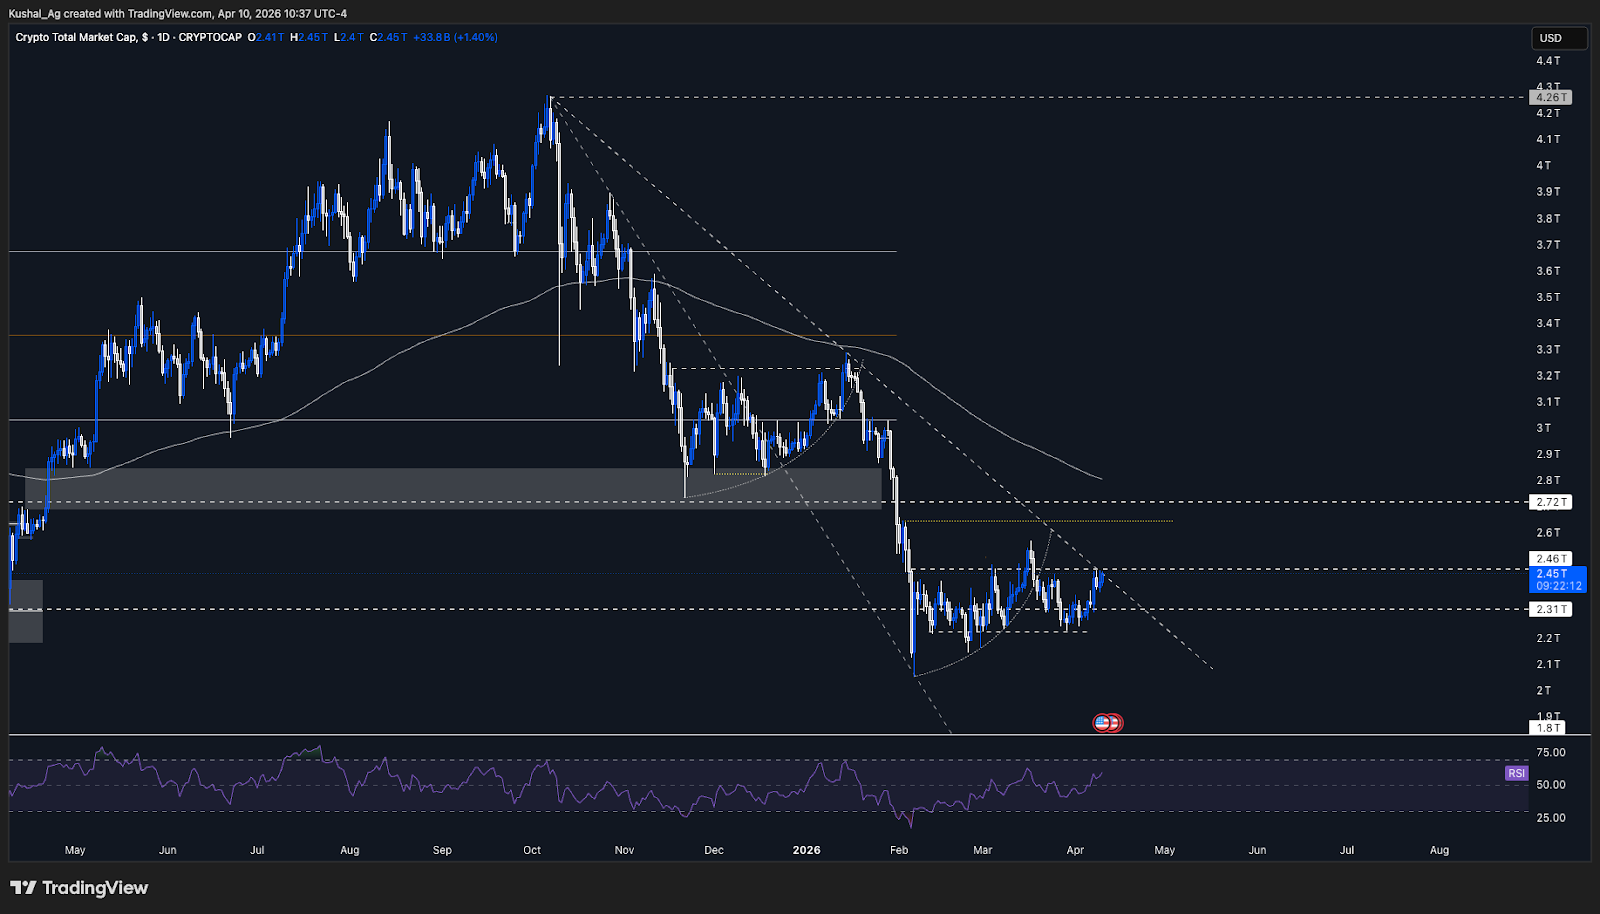
TATotal market cap continues to remain range-bound, holding the support region we had outlined previously. The broader structure has not changed, with price still trading within a defined range.
At the same time, price is now approaching a key area, trading just below the main downtrend trendline in place since October 2025, while also sitting near the $2.46T resistance. This makes it an important region for the next move.
A clean break above the downtrend trendline, along with acceptance above $2.46T, would open the door for a move toward $2.65T and $2.72T in the short to medium term. However, confirmation is key here, as strength needs to sustain above this level for the breakout to hold.
If the breakout lacks follow-through or we see weakness after the move, price could pull back toward the breakout region or rotate back toward the range lows near $2.31T. This keeps the structure conditional despite the setup.
The 200 EMA continues to trend around $2.8T, while RSI is around 58, showing decent momentum but still requiring confirmation through price.
Total Market Cap Chart:
Cryptonary’s Take:
Total market cap is now at a key point, sitting just below both the downtrend trendline and major resistance. This is where the next directional move is likely to be defined. A confirmed breakout with acceptance above $2.46T would shift the structure and support further upside (around 8-10%), but without that, the market remains range-bound.For now, the focus remains on how price behaves in this region, with confirmation needed before positioning for continuation.
Closing Thoughts
The market structure is starting to shift, with signs that the range-bound phase may be nearing an end. However, confirmations are still limited across majors. Ethereum has provided the first validation, with price breaking out and confirming a neutral-bullish structure, and continuation toward $2,400 remains the base case as long as strength holds.On the other hand, Bitcoin and Solana are yet to confirm a breakout, with both still trading near key resistance zones. As a result, the stance remains neutral on these assets until we see clear follow-through. Hyperliquid has shown relative strength, invalidating the previous neutral-bearish stance and outperforming in the short term, which has been reassessed in today’s analysis.
We have also introduced Total Market Cap into today’s MD, as it is now sitting at a key level. A confirmed move above resistance with sustained strength could open an 8-10% move on the upside across the market in the coming sessions. However, confirmations are still pending across most majors, and for now, the approach remains dynamic as we continue to track how price develops around these key levels.
Continue reading by joining Cryptonary Pro
$1,548 $997/year
Get everything you need to actively manage your portfolio and stay ahead. Ideal for investors seeking regular guidance and access to tools that help make informed decisions.
For your security, all orders are processed on a secured server.
As a Cryptonary Pro subscriber, you also get:
Value Guarantee - If cumulative documented upside does not reach 100% during your 12-month membership, you can request a full refund. Terms
24/7 access to experts with 50+ years’ experience
All of our top token picks for 2025
On hand technical analysis on any token of your choice
Weekly livestreams & ask us anything with the team
Daily insights on Macro, Mechanics, and On-chain
Curated list of top upcoming airdrops (free money)
Value Guarantee
If cumulative documented upside does not reach 100% during your 12-month membership, you can request a full refund.
Our track record speaks for itself
With over 2.4M tokens and widespread misinformation in crypto, we cut through the noise and consistently find winning assets.
Our track record speaks for itself
With over 2.4M tokens and widespread misinformation in crypto, we cut
through the noise and consistently find winning assets.


Frequently Asked Questions
Can I trust Cryptonary's calls?
Yes. We've consistently identified winners across multiple cycles. Bitcoin under $1,000, Ethereum under $70, Solana under $10, WIF from $0.003 to $5, PopCat from $0.004 to $2, SPX blasting past $1.70, and our latest pick has already 200X'd since June 2025. Everything is timestamped and public record.
Do I need to be an experienced trader or investor to benefit?
No. When we founded Cryptonary in 2017 the market was new to everyone. We intentionally created content that was easy to understand and actionable. That foundational principle is the crux of Cryptonary. Taking complex ideas and opportunities and presenting them in a way a 10 year old could understand.
What makes Cryptonary different from free crypto content on YouTube or Twitter?
Signal vs noise. We filter out 99.9% of garbage projects, provide data backed analysis, and have a proven track record of finding winners. Not to mention since Cryptonary's inception in 2017 we have never taken investment, sponsorship or partnership. Compare this to pretty much everyone else, no track record, and a long list of partnerships that cloud judgements.
Why is there no trial or refund policy?
We share highly sensitive, time-critical research. Once it's out, it can't be "returned." That's why membership is annual only. Crypto success takes time and commitment. If someone is not willing to invest 12 months into their future, there is no place for them at Cryptonary.
Do I get direct access to the Cryptonary team?
Yes. You will have 24/7 to the team that bought you BTC at $1,000, ETH at $70, and SOL at $10. Through our community chats, live Q&As, and member only channels, you can ask questions and interact directly with the team. Our team has over 50 years of combined experience which you can tap into every single day.
How often is content updated?
Daily. We provide real-time updates, weekly reports, emergency alerts, and live Q&As when the markets move fast. In crypto, the market moves fast, in Cryptonary, we move faster.
How does the Value Guarantee work?
We stand behind the value of our research. If the documented upside from our published research during your 12-month membership does not exceed the annual subscription cost, you can request a full refund. Historical context: In every completed market cycle since 2017, cumulative documented upside has exceeded 10X this threshold.
TermsRecommended from Cryptonary