Save 23% ($351) & Get a Free 1-1 Call with our Team ⏰ : 0d 2h 59m 44s
BTC, ETH and More: Majors Pivot to Neutral-Bullish
Price action has started to improve after several weeks of indecision. A few important structural changes are beginning to emerge that could shape the next phase of the market. Below, we break down what’s developing and the key levels to watch. Let's dive in...
Disclaimer: This is not financial or investment advice. You are responsible for any capital-related decisions you make, and only you are accountable for the results.
Quick bridge from earlier this week…
Earlier this week, we maintained a neutral stance across the majors, while highlighting the potential for relative Solana strength versus Ethereum and closely tracking a possible breakout in Hyperliquid. That breakout has now materialized, with HYPE clearing the $35.37 resistance and prompting us to pivot our stance from neutral to neutral-bullish, as the structure now opens the path for higher short-term targets.We are also beginning to see early signs of relative outperformance from Solana against Ethereum, although the move has not yet developed into a decisive impulse. As a result, while the broader market structure still remains largely range-bound, a few key structural shifts are starting to emerge in Majors, and we have adjusted our stance on select assets accordingly in today’s analysis.
Markets also continue to react to the escalation in the Middle East conflict, which has pushed Brent crude above $107, lifted bond yields, and reinforced tighter financial conditions. Although Bitcoin has held relatively well compared to other asset classes, we discussed these developments and their broader implications for Bitcoin and risk assets in yesterday’s Market Update.
Chart: Bitcoin price action and key pivots
Disclaimer: This content is for informational and educational purposes only. It does not constitute financial advice, and should not be relied upon as a basis for making investment decisions. Virtual assets are volatile and may lose their value in full. Past performance does not indicate future results. Always do your own research.
TLDR
- Risk Posture: Neutral-Defensive
- Bitcoin: BTC has reclaimed the $70,500 level and is now pushing toward the $73,800 resistance. As long as $70,500 holds, the short-term stance remains neutral-bullish, with a potential breakout above $74,000 opening the path toward $79,140.
- Ethereum: ETH is pushing the $2,116 resistance, which has capped price for several weeks. The stance remains neutral, with a confirmed close above $2,116-$2,150 required to shift toward neutral-bullish targeting $2,200-$2,368.
- Solana: SOL has reclaimed the $89 region and is approaching $93.18 resistance. The stance is now neutral-bullish, with continuation toward $100-$106.9 possible if price holds above $89 and breaks through $93.18..
- Hyperliquid: HYPE has delivered the $35.37 breakout, shifting the stance to neutral-bullish. As long as $35.37 holds as support, the market can continue toward $39.97, with $43.27 as the next upside target.
- Aura: AURA remains sideways with limited structural development, though the bullish divergence still holds. If Solana strength continues, we may see spillover momentum into higher-beta ecosystem assets like Aura.
Bitcoin
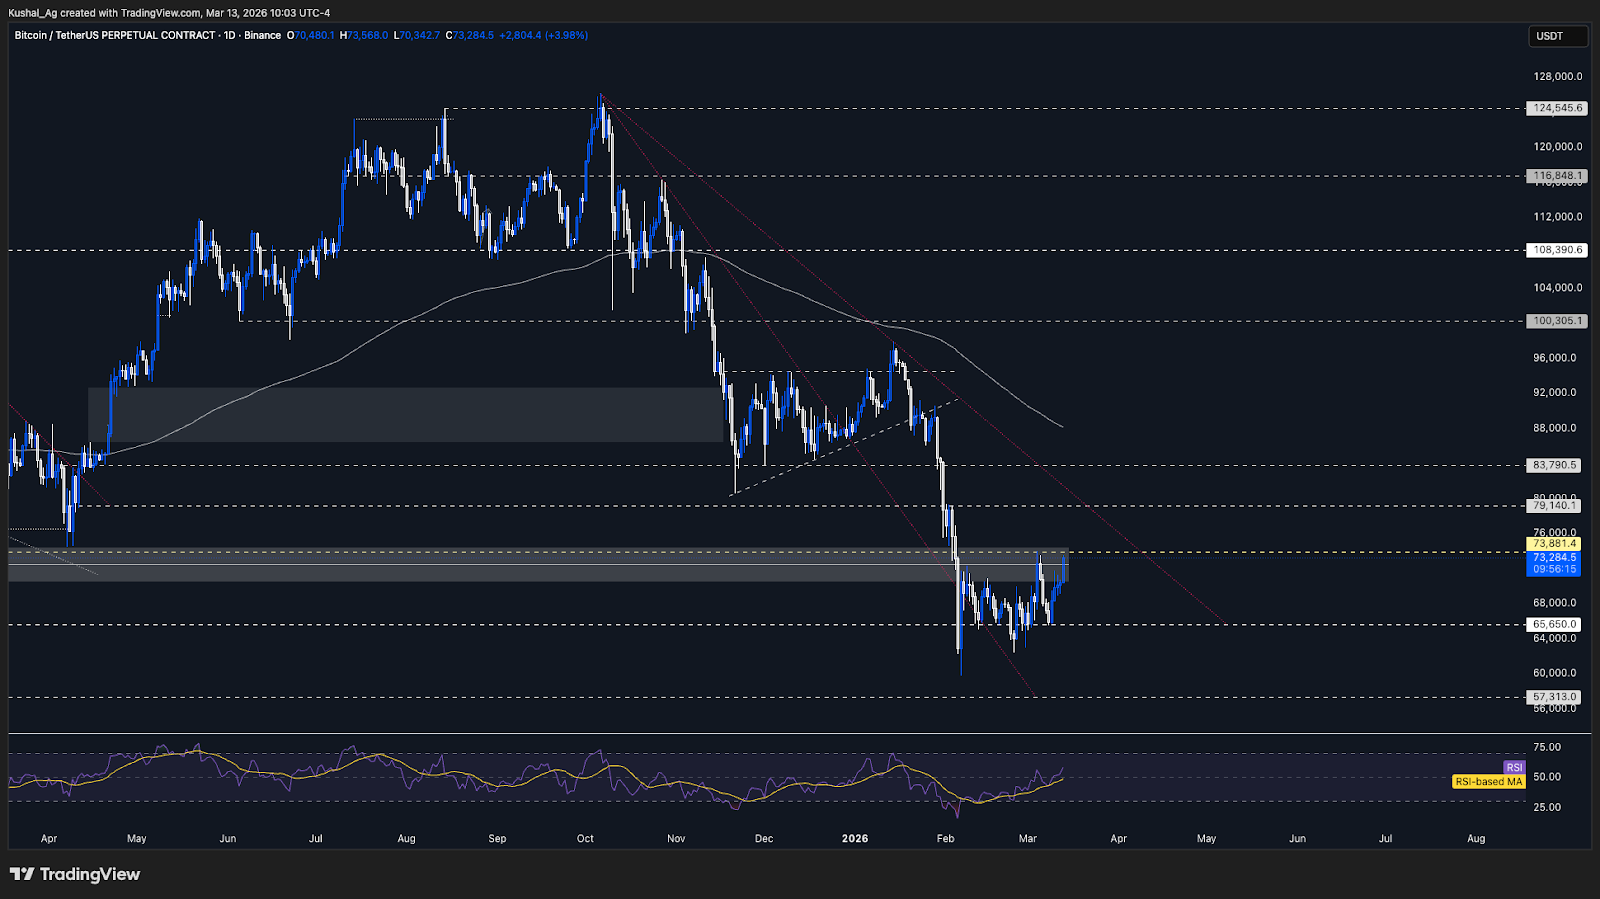
TABitcoin has started to build a clean upside leg after defending the $65,650 pivot, which was the main level we had been tracking in the previous analysis. Since tapping that support, price has printed a strong sequence of bullish daily candles and moved higher inside its range in line with the neutral thesis we had maintained earlier.
The key development here is the breakout above the $70,500 region. This level had capped price for the past few sessions and was also aligning with the 4 hour 200 EMA, making it an important lower-timeframe resistance zone. Bitcoin has now reclaimed that region and is trading above it, which improves the short-term structure.
With this reclaim, price is now moving toward the next major resistance at $73,800. This remains the key upside level for Bitcoin in the current range. A move into that region was already part of our range framework, and now the market is once again approaching that decision zone.
As long as Bitcoin continues to hold above $70,500, the stance shifts from neutral to neutral-bullish. A clean break above $73,800 would likely open the path toward $79,140, which remains the next major upside liquidity level. On the other hand, if Bitcoin loses $70,500 again, we would be pivoting back toward a neutral stance and reassessing structure from there.
The 200 EMA on the daily timeframe continues to slope downward and is currently hovering around $88,200. RSI has recovered well and is now around 57 with an average near 48, which reflects improving momentum and supports the current short-term strength.
Key Levels:
- Support: $70,500
- Resistance: $73,800
- Direction: Neutral-Bullish
- Upside Target: $79,140
- Downside Target: $65,650
Cryptonary’s Take:
Bitcoin is now in a better short-term position after reclaiming the $70,500 region, and that keeps the path open for another move toward the $73,800 resistance. As long as this reclaimed support continues to hold, the market can continue pressing higher within the broader range.That said, the real confirmation still sits above $73,800. If Bitcoin clears that level with strength, then the market likely starts targeting the weekly external liquidity around $79,140. Until then, the structure remains neutral-bullish, but still within a broader range.
Ethereum
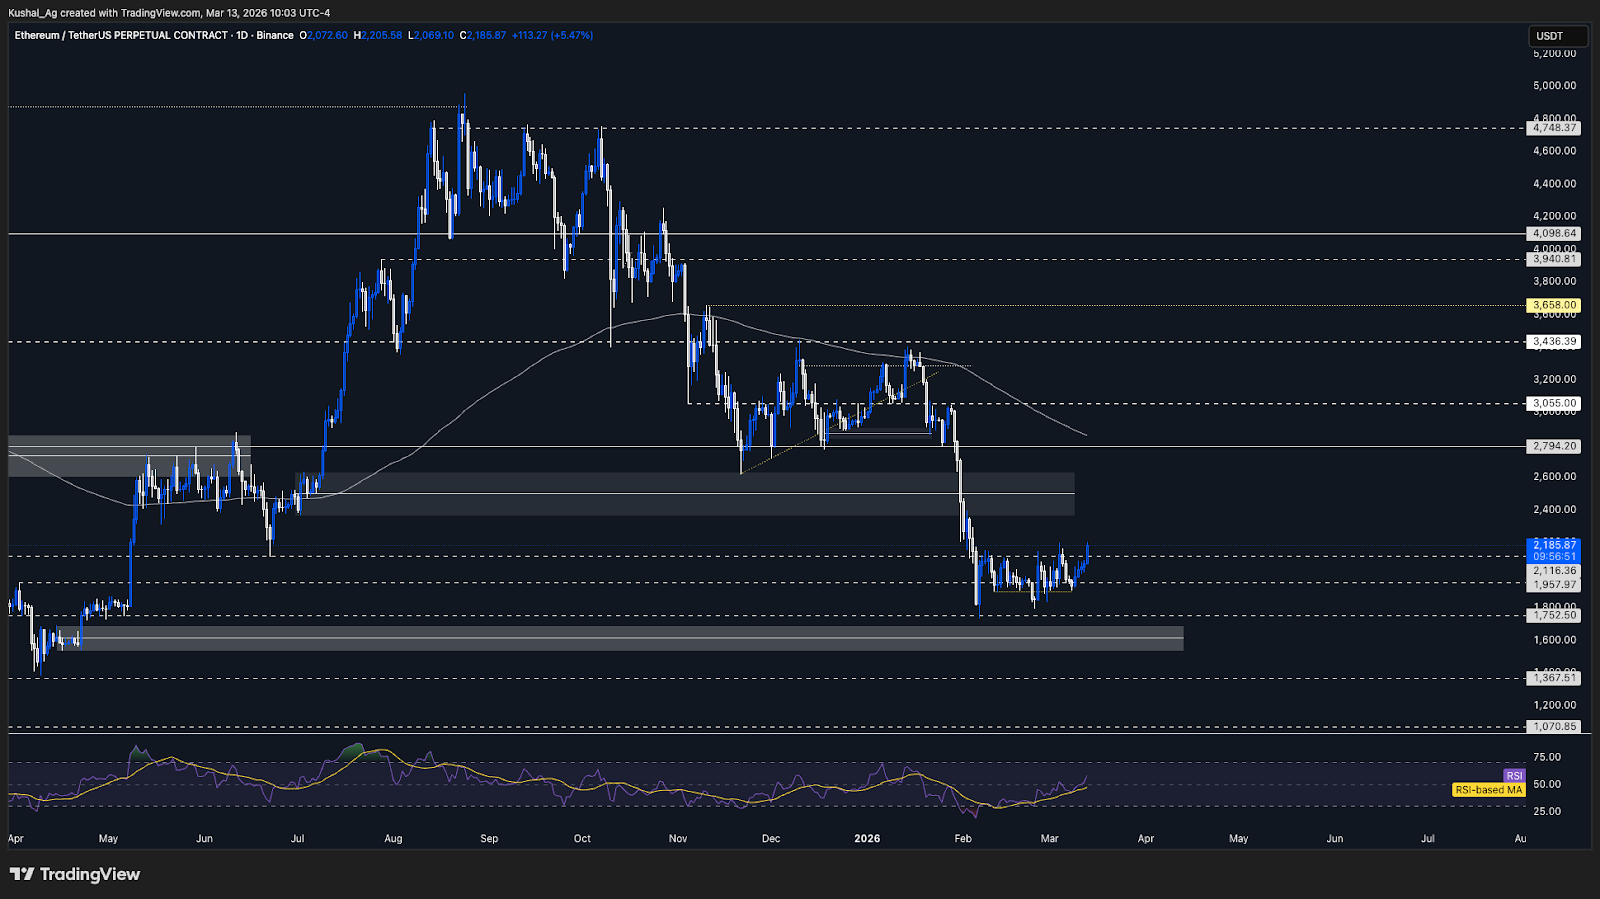
TAEthereum is once again pressing against the $2,116 resistance region, a level that has capped price for roughly the past 5-6 weeks. We saw an earlier breakout attempt in early March, but that move failed to sustain and price rotated back toward the support band, keeping Ethereum within the broader range structure.
The $2,116 level remains the immediate resistance, which price has broken in today's session, and the key confirmation we are looking for is a strong daily close above the $2,150 region, which would confirm that the breakout is holding and that Ethereum is beginning to shift out of the range.
If Ethereum is able to sustain above $2,116-$2,150 after the breakout, the next upside levels we will be tracking are $2,200, followed by the higher resistance around $2,368. These remain the next key liquidity zones on the upside should the breakout confirm.
For now, our stance remains neutral, if Ethereum is able to secure a sustained close above $2,116, we would then pivot toward a neutral-bullish stance, targeting $2,200 initially and $2,368 thereafter.
On the downside, the broader structure remains supported by the $1,900 region, which has acted as the lower boundary of the range. A loss of this support would likely reopen the path toward $1,757, which remains the next downside target should the range break lower.
The 200 EMA on the daily timeframe continues to slope downward and is currently hovering around $2,857, reflecting that the broader higher-timeframe structure remains under pressure. RSI has recovered and is now around 57 with an average near 47, showing improving momentum as Ethereum approaches the key resistance.
Key Levels:
- Support: $1,900
- Resistance: $2,116-$2,150
- Direction: Neutral
- Upside Target: $2,200-$2,368
- Downside Target: $1,757
Cryptonary’s Take:
Ethereum is approaching an important decision zone around $2,116 (currently broken at the time of posting in today's session), which has capped prices for several weeks. A clean breakout and sustained close above this level would signal that the range structure is beginning to resolve to the upside, allowing the market to target $2,200 and $2,368 next. However, until that confirmation arrives, the structure remains range-bound and we continue to maintain a neutral stance, with a sustained hold above $2,116 required before shifting toward a more constructive short-term outlook.At the same time, the ETH/BTC ratio continues to hover around the 0.029 region, which remains a key level we have been tracking. A break above 0.03 would likely mark a shift in relative strength and could allow Ethereum to outperform Bitcoin with a potential 7-10% move higher in the ratio. Conversely, a loss of 0.029 would reinforce the current dynamic of Bitcoin continuing to outperform Ethereum in the near term.
Solana
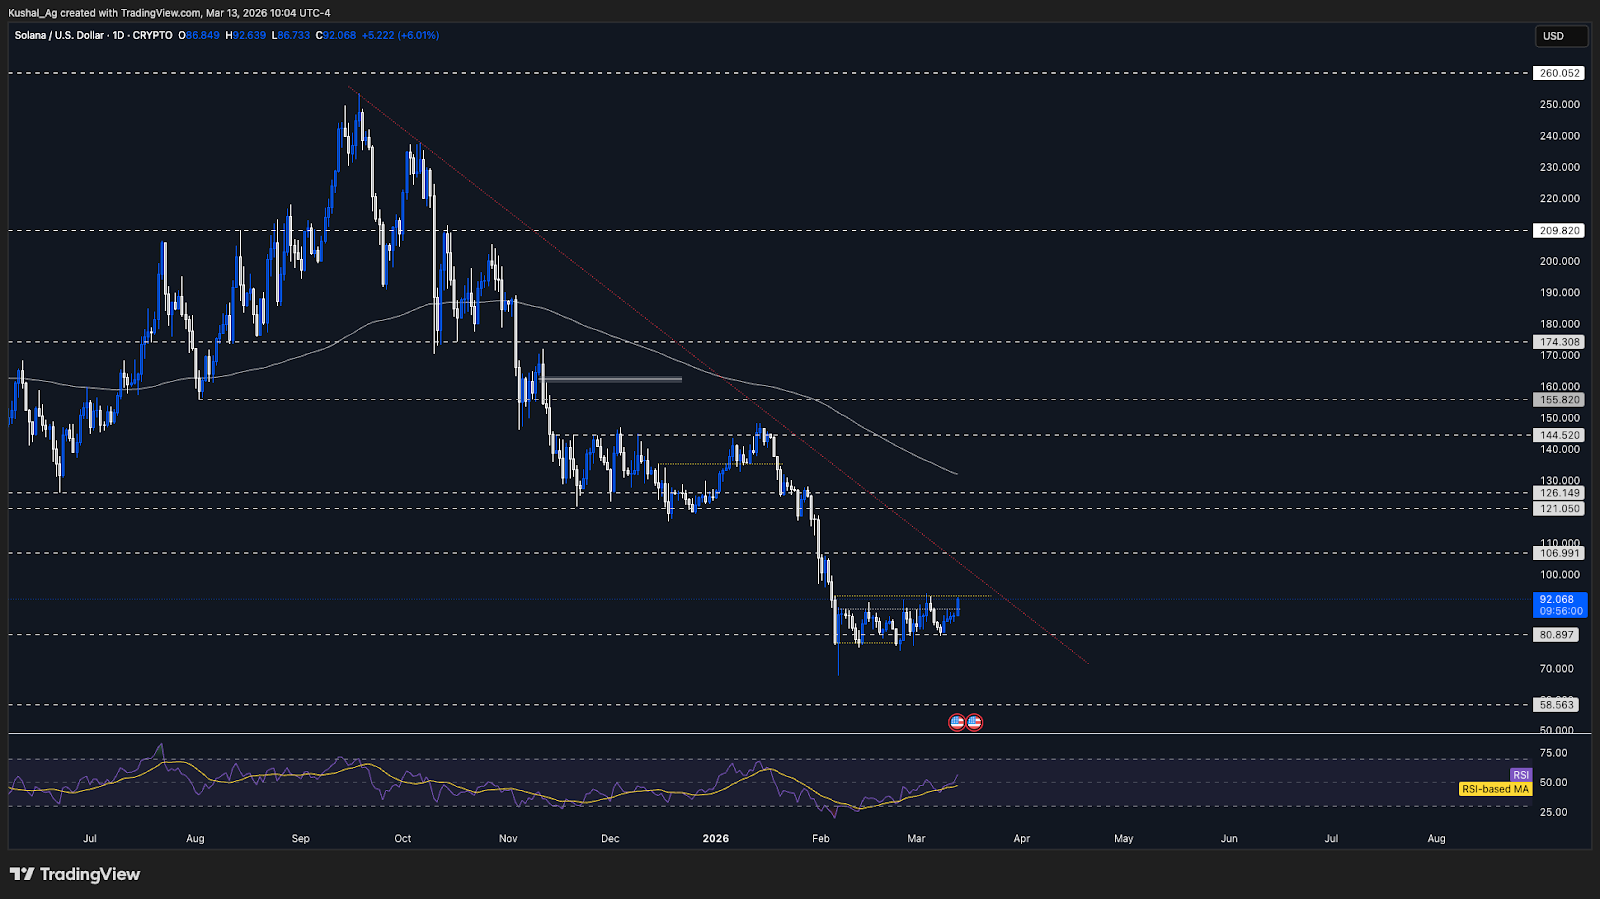
TASolana is now broken above the $89 resistance region, a level that had previously capped price within the broader range. We can see that price has now managed to move above that area and is currently trading in the band between $89 and $93, which marks the next immediate resistance zone for Solana.
The key level to watch in the near term is $93.18, which stands as the next resistance on the upside. A sustained close above this level would likely open the path toward the $100 region initially, with the broader upside target remaining around $106.9 should the breakout follow through.
Given this recent reclaim, we are pivoting our stance to neutral-bullish on Solana. However, the key confirmation will come from whether Solana is able to hold the $88-$89 region as support. If price is able to maintain above this level and begin forming a base, it would strengthen the case for continuation toward the next resistance at $93.18.
If Solana manages to break and hold above $93.18, the market would likely begin targeting the $100 region, followed by the broader upside objective around $106.9 in the short to medium term.
On the downside, the broader structural support remains at $78, which continues to define the lower boundary of the current range. A loss of this level would weaken the setup and reopen the path toward the $67.7 downside target.
The 200 EMA on the daily timeframe continues to slope downward and is currently hovering around $132, meanwhile, RSI has recovered to around 55 with an average near 46, reflecting improving momentum as Solana pushes into the resistance zone.
Key Levels:
- Support: $89
- Resistance: $93.18
- Direction: Neutral Bullish
- Upside Target: $106.9
- Downside Target: $67.7-$78
Cryptonary’s Take:
Solana is beginning to show relative strength after reclaiming the $89 region, which previously acted as resistance. As long as this level continues to hold as support, the short-term structure remains constructive and allows price to challenge the $93.18 resistance, with a break above that opening the path toward the $100 region and potentially $106.9.From a relative performance perspective, we continue to monitor the SOL/ETH ratio, where the 0.042 level has been acting as a strong support. As long as this level continues to hold, we could see Solana potentially outperform Ethereum by around 8-10%, with the next upside level for the ratio sitting near 0.046.
Hyperliquid
TAHyperliquid has now delivered the breakout we had been tracking, with price clearing the $35.37 resistance level that had previously capped the structure. Following this breakout, HYPE has started to push higher and is now approaching the early February swing high region, which sits around $38.34.
This level represents the high made on the 3rd of February, before Hyperliquid rolled over toward the $25 region previously. As a result, it is natural for price to experience some resistance around this area, and we can already see the market reacting slightly as it tests this zone.
With the breakout above $35.37, we are now pivoting our stance from neutral to neutral-bullish for Hyperliquid, as previously outlined. The key factor going forward will be whether price is able to hold the $35.37 region as support, which has now flipped from resistance.
If Hyperliquid is able to sustain above $35.37, the next upside level we will be watching is $39.97, which stands as the next resistance in the structure. A clean break above that region would likely open the path toward the $43.27 level, which becomes the next upside target for HYPE.
On the downside, failure to hold the $35.37 support could lead to a short-term pullback toward the $33 region, with the broader structural support sitting near the $32.3-$32.4 zone, where the 200 EMA on the daily timeframe is currently positioned.
RSI is currently around 67 with an average near 59, which reflects strong momentum as Hyperliquid continues pushing toward the February highs.
Key Levels:
- Support: $35.37
- Resistance: $39.97
- Direction: Neutral-Bullish
- Upside Target: $43.27
- Downside Target: $33
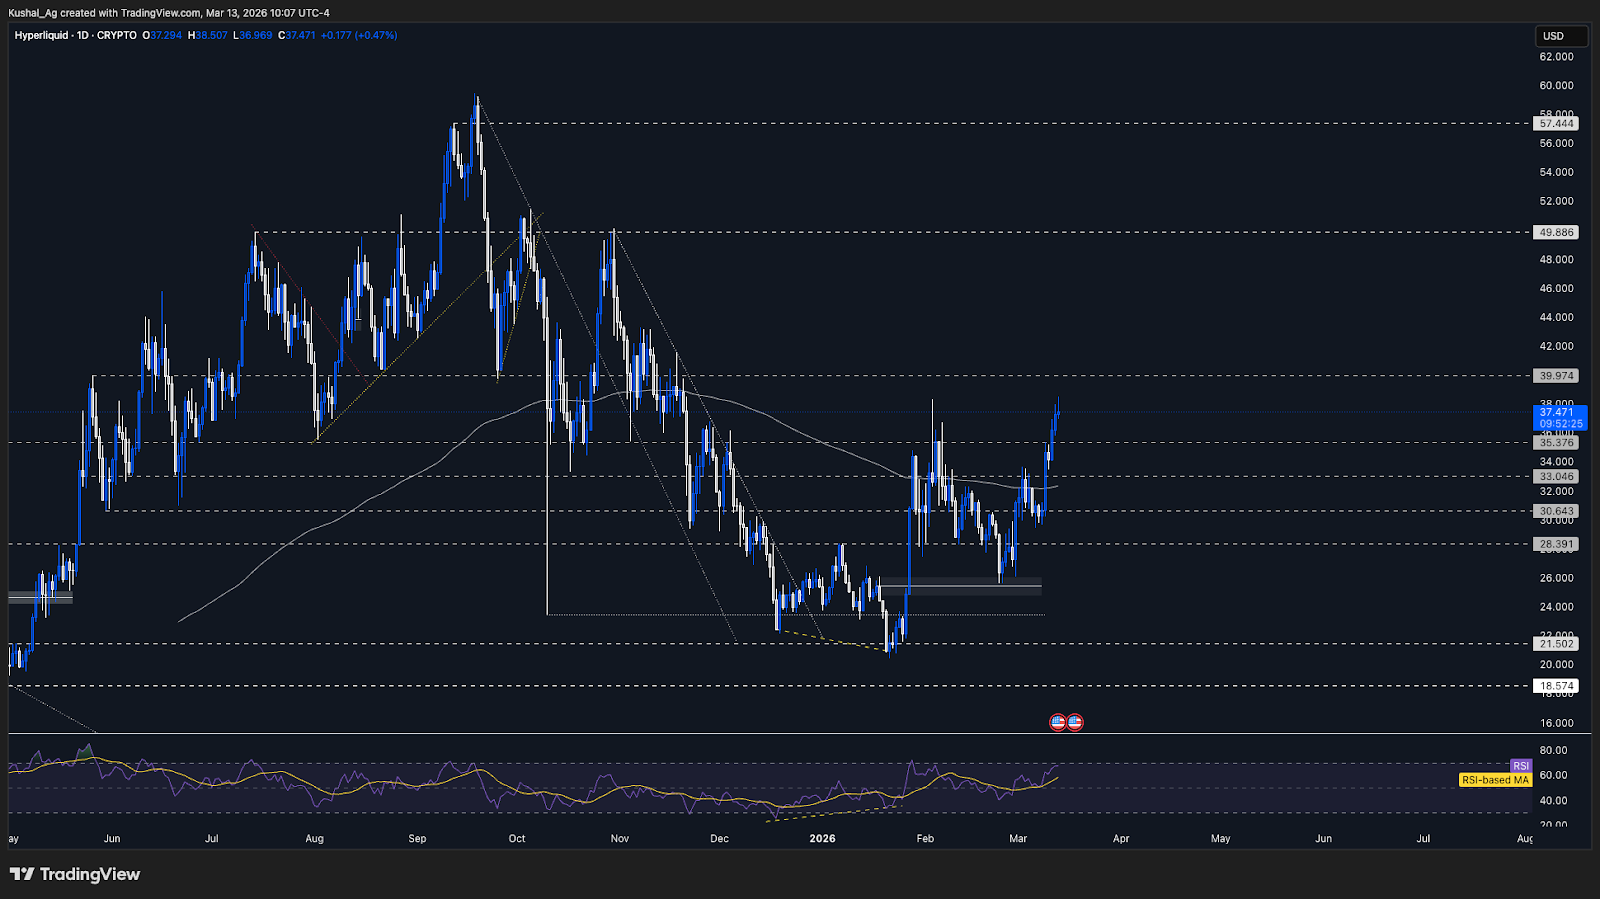
Cryptonary’s Take:
Hyperliquid has now confirmed the breakout above $35.37, which shifts the short-term structure into a more constructive position. The next key test now sits around the $38.34 swing high, where price is currently facing some resistance.If HYPE is able to clear this region and move toward $39.97, the market would likely begin targeting $43.27 next. For now, as long as $35.37 continues to hold as support, the stance remains neutral-bullish, with the market attempting to build continuation toward the next upside liquidity zones.
Aura
TAAura continues to see very limited structural development, with price largely consolidating around the same region over the past several sessions.
One factor to watch is the strength currently building in Solana, as improving momentum there could lead to spillover strength into higher-beta Solana ecosystem assets, including Aura.
The potential bullish divergence identified earlier continues to hold, although price has yet to confirm the move with a stronger recovery.
The 200 EMA continues to slope downward around 0.0408, while RSI is around 40 with an average near 36, showing momentum is still relatively weak but stabilizing.
Chart: Aura price consolidation
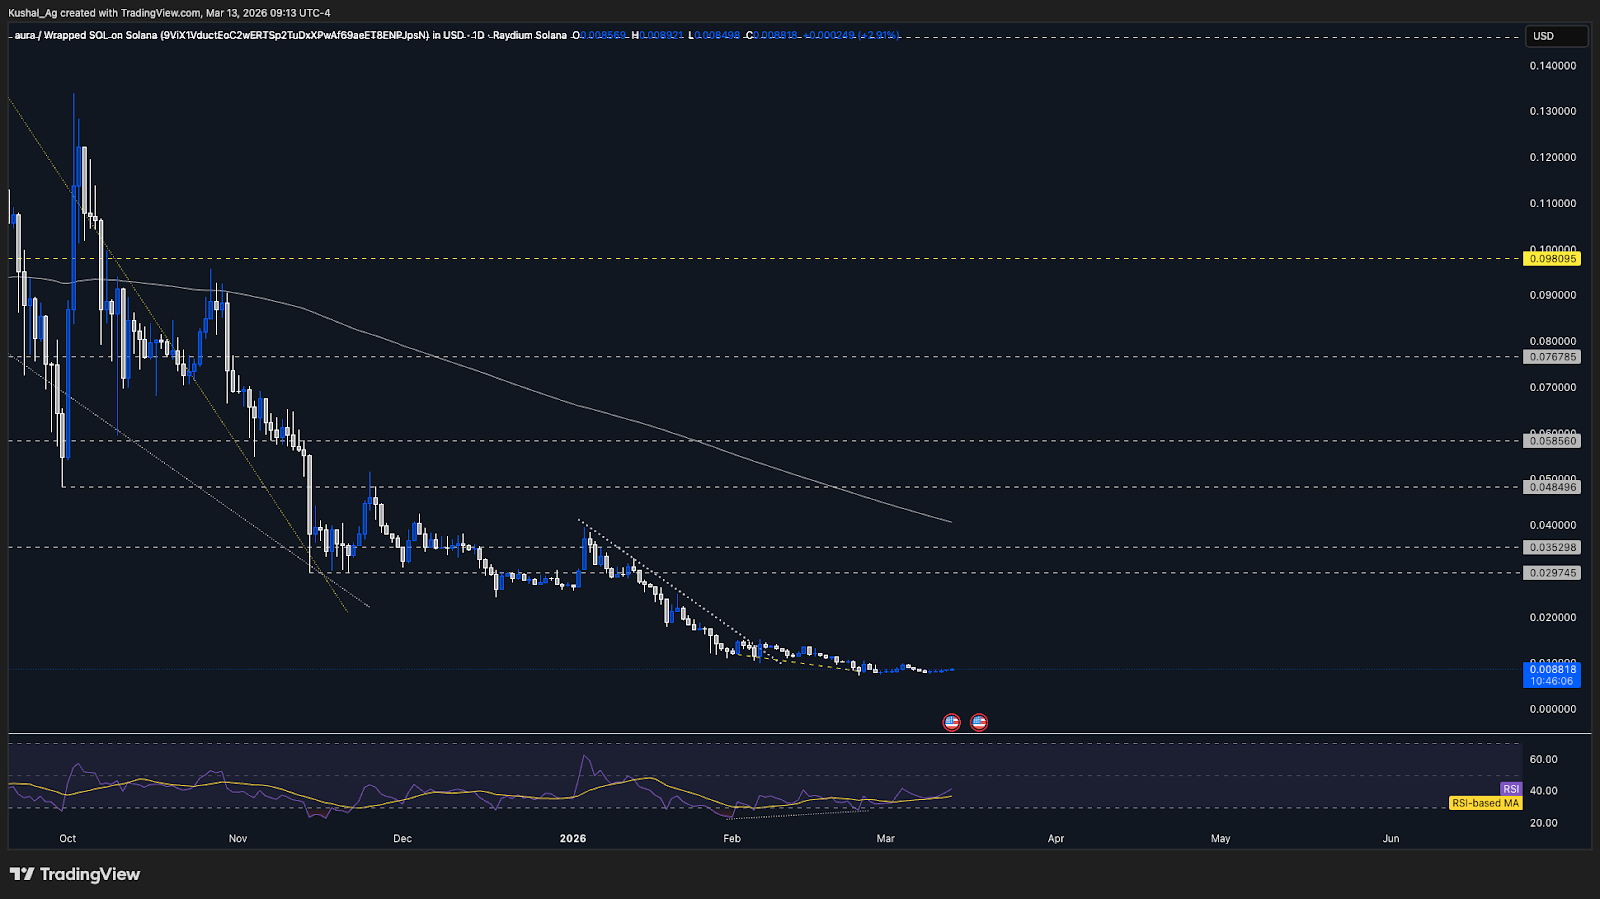
Cryptonary’s Take:
Aura continues to consolidate in a similar range, although we can see that Solana is beginning to show signs of strength. If Solana continues to outperform in the short term, it could trigger spillover momentum into higher-beta ecosystem assets like Aura, potentially allowing price to begin recovering as well.Closing Thoughts
We have pivoted our neutral stance to a neutral-bullish stance in Bitcoin, Solana, and Hyperliquid, as recent price action across these assets has started to show improving structure.In Hyperliquid, the breakout above $35.37 has already confirmed the shift in structure. While price is currently reacting to the early February swing high, this is a natural reaction around prior highs, and as long as $35.37 continues to hold as support, the setup remains constructive for higher targets.
Similarly, Bitcoin and Solana have begun reclaiming key levels, which supports the shift toward a neutral-bullish stance in both assets. Bitcoin is now pushing back toward the upper range resistance, while Solana has started to show relative strength, which could allow both assets to target higher upside liquidity if the current support regions continue to hold.
We continue to maintain a neutral stance on ETH for now. However, in today’s session, Ethereum has broken above the $2,116-$2,150 resistance region that we have been tracking. If price is able to secure a daily close above these levels, we will be looking to pivot our stance to neutral-bullish, as that would signal the range structure beginning to resolve to the upside.
Continue reading by joining Cryptonary Pro
$1,548 $1,197/year
Get everything you need to actively manage your portfolio and stay ahead. Ideal for investors seeking regular guidance and access to tools that help make informed decisions.
For your security, all orders are processed on a secured server.
As a Cryptonary Pro subscriber, you also get:
3X Value Guarantee - If cumulative documented upside does not reach 300% during your 12-month membership, you can request a full refund. Terms
24/7 access to experts with 50+ years’ experience
All of our top token picks for 2025
On hand technical analysis on any token of your choice
Weekly livestreams & ask us anything with the team
Daily insights on Macro, Mechanics, and On-chain
Curated list of top upcoming airdrops (free money)
3X Value Guarantee
If cumulative documented upside does not reach 300% during your 12-month membership, you can request a full refund.
Our track record speaks for itself
With over 2.4M tokens and widespread misinformation in crypto, we cut through the noise and consistently find winning assets.
Our track record speaks for itself
With over 2.4M tokens and widespread misinformation in crypto, we cut
through the noise and consistently find winning assets.


Frequently Asked Questions
Can I trust Cryptonary's calls?
Yes. We've consistently identified winners across multiple cycles. Bitcoin under $1,000, Ethereum under $70, Solana under $10, WIF from $0.003 to $5, PopCat from $0.004 to $2, SPX blasting past $1.70, and our latest pick has already 200X'd since June 2025. Everything is timestamped and public record.
Do I need to be an experienced trader or investor to benefit?
No. When we founded Cryptonary in 2017 the market was new to everyone. We intentionally created content that was easy to understand and actionable. That foundational principle is the crux of Cryptonary. Taking complex ideas and opportunities and presenting them in a way a 10 year old could understand.
What makes Cryptonary different from free crypto content on YouTube or Twitter?
Signal vs noise. We filter out 99.9% of garbage projects, provide data backed analysis, and have a proven track record of finding winners. Not to mention since Cryptonary's inception in 2017 we have never taken investment, sponsorship or partnership. Compare this to pretty much everyone else, no track record, and a long list of partnerships that cloud judgements.
Why is there no trial or refund policy?
We share highly sensitive, time-critical research. Once it's out, it can't be "returned." That's why membership is annual only. Crypto success takes time and commitment. If someone is not willing to invest 12 months into their future, there is no place for them at Cryptonary.
Do I get direct access to the Cryptonary team?
Yes. You will have 24/7 to the team that bought you BTC at $1,000, ETH at $70, and SOL at $10. Through our community chats, live Q&As, and member only channels, you can ask questions and interact directly with the team. Our team has over 50 years of combined experience which you can tap into every single day.
How often is content updated?
Daily. We provide real-time updates, weekly reports, emergency alerts, and live Q&As when the markets move fast. In crypto, the market moves fast, in Cryptonary, we move faster.
How does the 3X Value Guarantee work?
We stand behind the value of our research. If the documented upside from our published research during your 12-month membership does not exceed three times (3X) the annual subscription cost, you can request a full refund. Historical context: In every completed market cycle since 2017, cumulative documented upside has exceeded 10X this threshold.
TermsRecommended from Cryptonary


