Save 23% ($351) & Get a Free 1-1 Call with our Team ⏰ : 0d 2h 59m 43s
BTC, ETH and More: Market Remains Range Bound
The market has been busy this week, with sharp moves and plenty of noise along the way. But beneath the headlines, price action is starting to reveal a clearer structure. In this update, we focus on what actually matters right now, the key levels being defended, and how the market is positioning as we move forward...

Disclaimer: This is not financial or investment advice. You are responsible for any capital-related decisions you make, and only you are accountable for the results.
Quick bridge from earlier this week…
Earlier this week on Tuesday in our last Market Direction report, we leaned neutral bullish on Ethereum, highlighting its relative strength and the likelihood of outperformance. That thesis played out. ETH tapped the $3,436 level, making a local high near $3,446, and is now consolidating around the mid range, which continues to signal strength rather than a full retracement.We also noted that if ETH shows strength, Solana should follow, and that played out as well. SOL pushed from range mid and tapped the range top near $144-145, as outlined. While it has since pulled back, price action confirms that ETH leadership is still influencing high beta majors.
Bitcoin, however, has remained capped. While we expected $93,150 supply to thin eventually, BTC has not yet broken through and continues to range between $90,200 and $93,150. That said, price is compressing near the top of the range, Tuesday’s low was swept and quickly reclaimed, and supply is gradually weakening. As we move into today’s Market Direction, the focus is if BTC can finally clear overhead supply, and whether ETH and SOL can continue to hold their new developing structures.
TLDR
- BTC: Still range-bound between $90,200-$93,150, compressing near resistance. Supply is thinning, but a clean break is needed for continuation.
- ETH: Decent price action developing, holding above $3,055 after tagging $3,436. The structure remains neutral-bullish.
- SOL: Holding key support at $126 with demand around $132-133. Upside opens on a reclaim of $144.5.
BTC
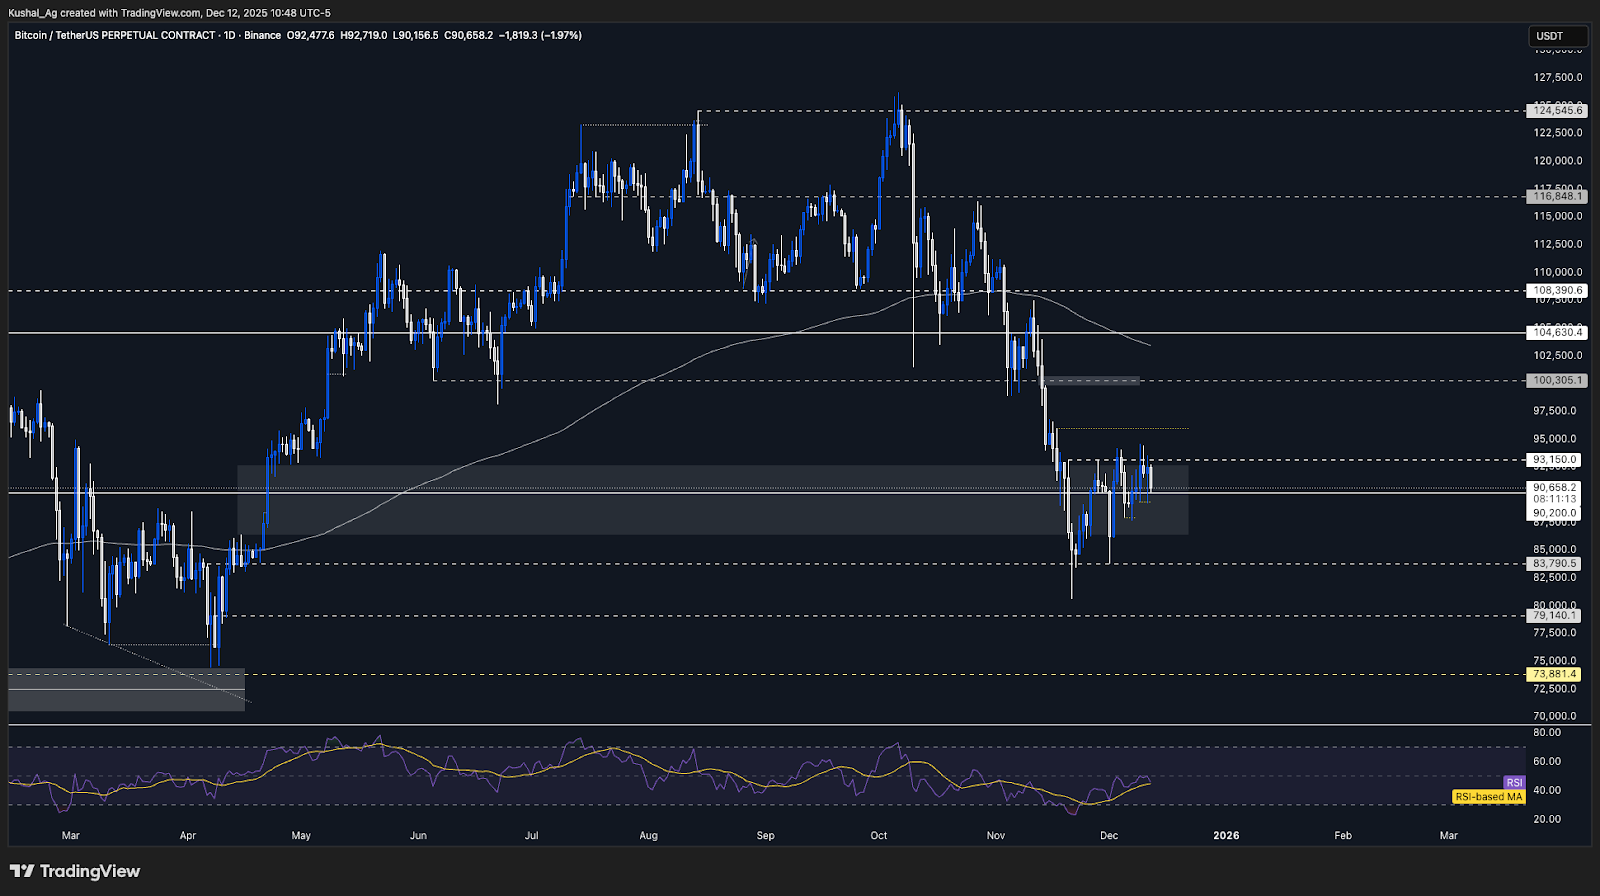
TA:BTC continues to trade within the same tight range that has been in place for the past several sessions, with price capped below the $93,150 resistance and supported above $90,200.
Despite multiple attempts, BTC has not been able to decisively reclaim $93,150. Supply at this level is still present, suggesting the market is not yet ready for a clean breakout.
On the higher timeframe, BTC remains inside the weekly FVG highlighted earlier, with price respecting both its upper and lower boundaries. This reinforces the idea of consolidation.
The 17th November weekly candle continues to define the broader structure, with BTC printing inside candles since then. The untested weekly high near $96,000 remains an area of interest if resistance is eventually cleared.
Momentum has stabilised but not expanded. RSI is hovering around 50 with avg around 45, indicating neutrality, while the 200 EMA near $103,600 remains well above price, keeping upside capped for now.
BTC Chart:
Key Levels:
- Next Support: $90,200
- Next Resistance: $93,150
- Direction: Neutral
- Upside Target: $96,000
- Downside Target: $86,450
Cryptonary’s Take:
Bitcoin remains range-bound and structurally neutral. While downside has been defended well above $90,200, repeated failures at $93,150 show that supply is still active and not yet absorbed.As long as BTC continues to trade within the weekly FVG, expectations should remain focused on consolidation rather than breakout. A clean daily close above $93,150 would be required to shift bias, while a loss of $90,200 would reopen downside risk toward $86,450.
For now, BTC is in wait and watch mode, acting more as a stabilising anchor for the market rather than a directional leader.
ETH
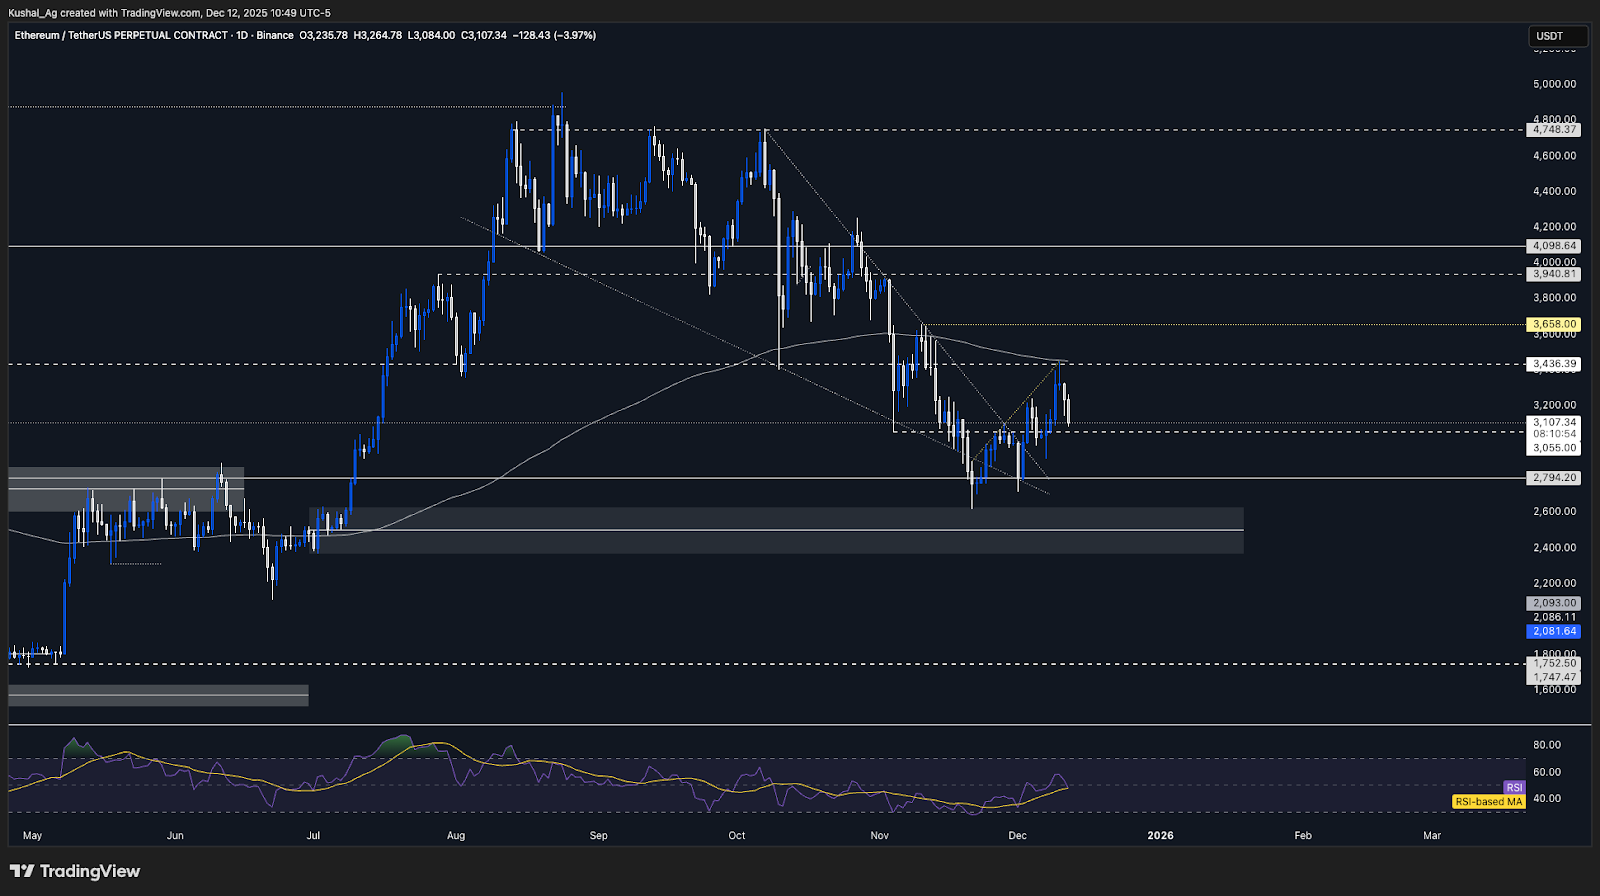
TA:Since the last update, ETH has played out the neutral-bullish thesis accurately, rallying into the $3,436 resistance zone that we had outlined as the next upside area.
Price topped just below the daily 200EMA, which is trading around $3,452, confirming this zone as a meaningful supply area where sellers remain active.
After taking rejection from $3,436, ETH has not broken down aggressively and is instead stabilising around the $3,200 region, which is acting as an intermediate mid range support.
As long as ETH continues to hold above $3,200 and, more importantly, $3,055, the broader structure remains constructive and pullbacks look corrective rather than impulsive.
RSI remains healthy, trading around 55 with avg at 48, reflecting improving momentum without signs of exhaustion.
ETH Chart:
Key Levels:
- Next Support: $3,055
- Next Resistance: $3,436
- Direction: Neutral-Bullish
- Upside Target: $3,658
- Downside Target: $2,794
Cryptonary’s Take:
ETH remains the stronger major in the current market environment. The rejection from $3,436 was expected given the confluence with the daily 200EMA, but the key positive is that ETH is holding mid range support near $3,200 for now rather than retracing sharply. This shows underlying demand and keeps the neutral bullish bias intact.As long as $3,055 holds, dips are likely to remain contained, with ETH consolidating before making another attempt at the $3,436-$3,452 supply zone. A clean reclaim of $3,658 would confirm a broader bullish structural shift but that doesn't come anytime soon. Until then, ETH remains in a constructive consolidation phase, outperforming most other majors.
SOL
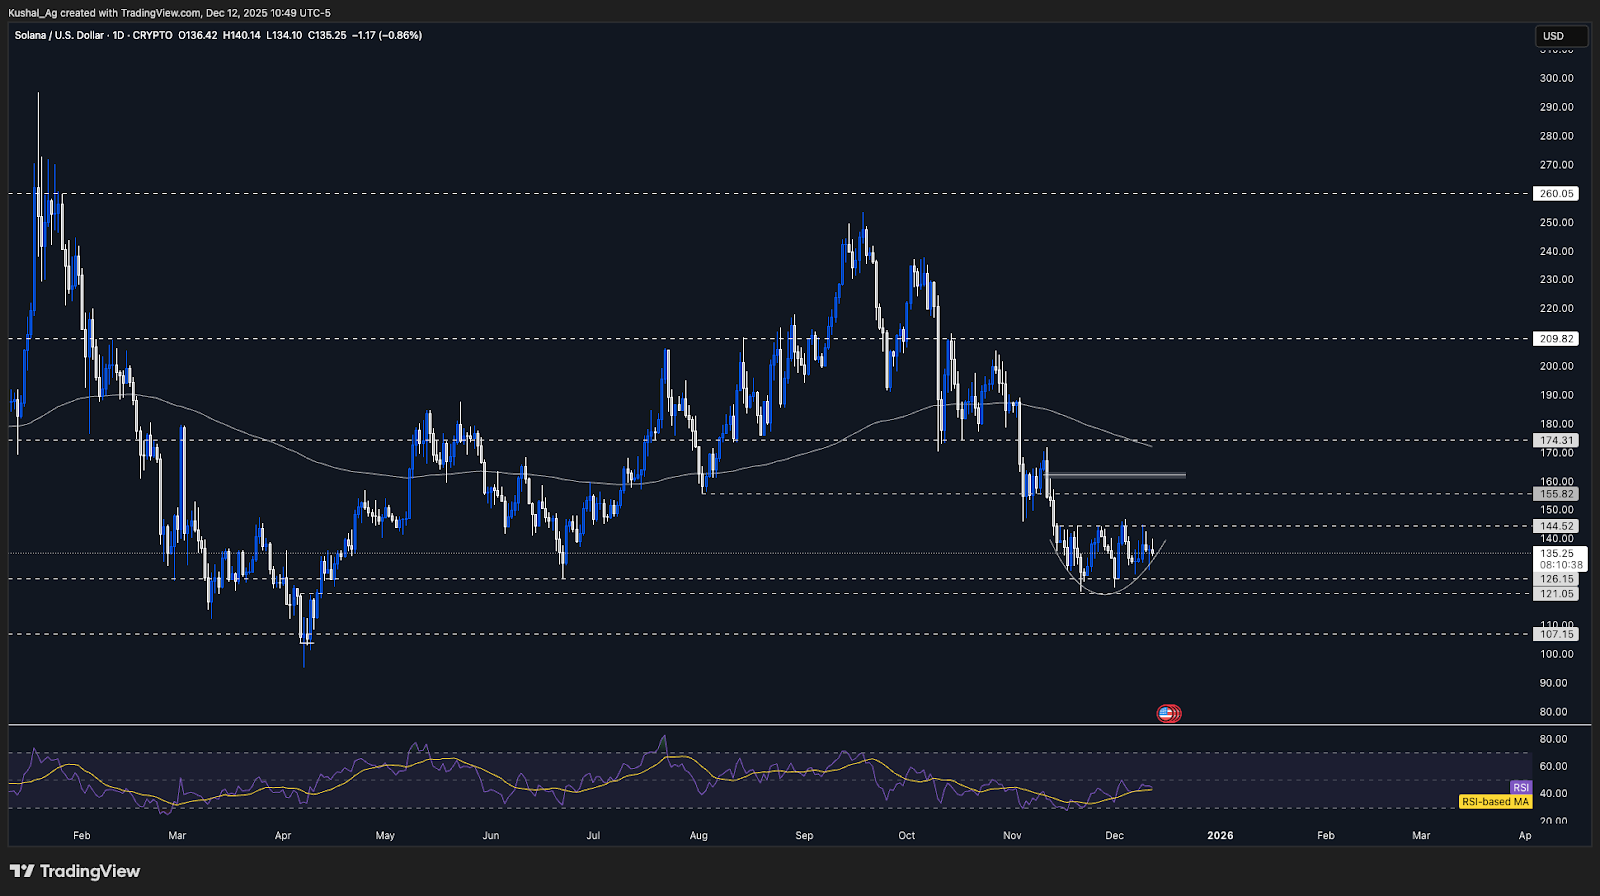
TA:SOL continues to hold its key structural support on the daily timeframe around $126, a level that has repeatedly acted as a demand zone during the past month of consolidation.
On the higher timeframe, the weekly 200 EMA sits near $123.4, reinforcing this entire region as a major structural support area for SOL. As long as this zone holds, downside risk remains contained.
SOL has spent nearly 25-30 days consolidating between $126 and $144, forming a rounded base/rounding bottom type structure, which typically reflects accumulation rather than distribution when formed at key supports.
As discussed previously, strength in ETH has translated into SOL testing the range high near $144, where price was rejected but still managed to close well within the range, leaving long wicks to range bottom, a sign of active demand in the mid to lower range.
RSI has recovered back into neutral territory, trading around 49 with avg around 43. A decisive close above $144.5 would likely push RSI into expansion territory, supporting a breakout attempt.
A break below $121 would invalidate the current structure and open a move toward $107-$110, implying roughly 10-11% downside from support
Key Levels:
- Next Support: $126.15
- Next Resistance: $144.50
- Direction: Neutral-Bullish
- Upside Target: $155.80
- Downside Target: $121.05
Cryptonary’s Take:
SOL continues to differentiate itself structurally from BTC and ETH by holding firm at a major higher timeframe support cluster. The confluence of daily demand at $126 and the weekly 200 EMA near $123 keeps the broader structure constructive, despite repeated rejections at the range high.The ongoing rounded base formation might suggest accumulation. Each rejection from $144 has failed to produce follow-through to the downside, and buyers continue to step in aggressively within the range, keeping the structure intact.
A clean daily close above $144.5, followed by consolidation, would confirm a breakout from this month long base and open the door toward $155.8, with $162 (daily FVG) as a secondary target. On the contrary, a close below $121 sends Sol to sum $110 eventually. Until confirmation arrives, SOL remains neutral-bullish and range-bound, but structurally well-positioned if the broader market shows strength.
HYPE
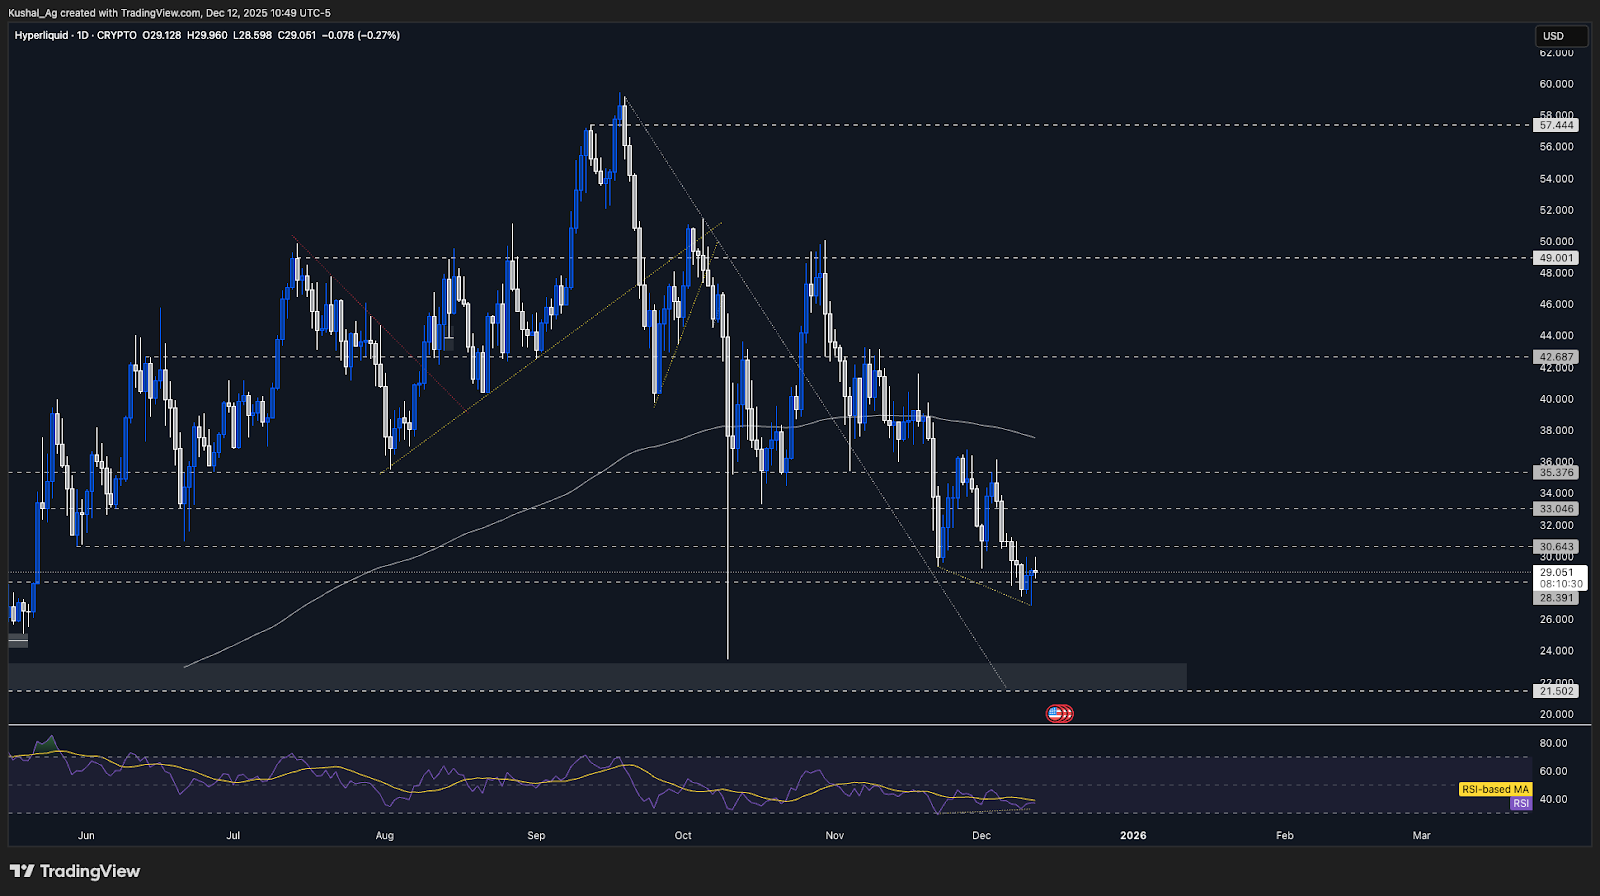
TA:Since the last update, HYPE has respected the $27-$28.3 support zone we highlighted, with price bottoming near $26.9 before quickly reclaiming back above support.
Price is now holding above $28.39, confirming that buyers are stepping in around this region and defending the lower boundary of the range.
A bullish divergence is in formation as well, marked by higher lows on RSI while price made marginally lower lows, highlighted on both price and RSI with yellow dotted lines.
If the wider market remains intact and HYPE continues to hold above $28.3, the next upside target is $30.64, followed by $33.04.
The daily 20EMA sits around $27.6, reinforcing this zone as a strong higher timeframe support area. RSI has bounced from oversold levels, now trading near 39 with at avg 40, supporting the divergence thesis.
Key Levels:
- Next Support: $28.30
- Next Resistance: $30.64
- Direction: Neutral-Bullish
- Upside Target: $33.04
- Downside Target: $23.50
Cryptonary’s Take:
HYPE is showing early signs of stabilisation after a sharp drawdown, with price holding the $27-$28.3 support band and forming a bullish divergence. This combination suggests downside momentum is slowing and that sellers are losing control at current levels.While HYPE has underperformed relative to the broader market in the past few weeks, the presence of divergence opens the door for a catch up move if overall market conditions remain supportive. A reclaim of $30.64 would be the first confirmation that momentum is shifting back in favour of buyers.
For now, the stance moves to neutral-bullish, with risk clearly defined below $27. As long as this support holds, upside extensions toward $30.64 and $33.04 remain in play over the coming sessions.
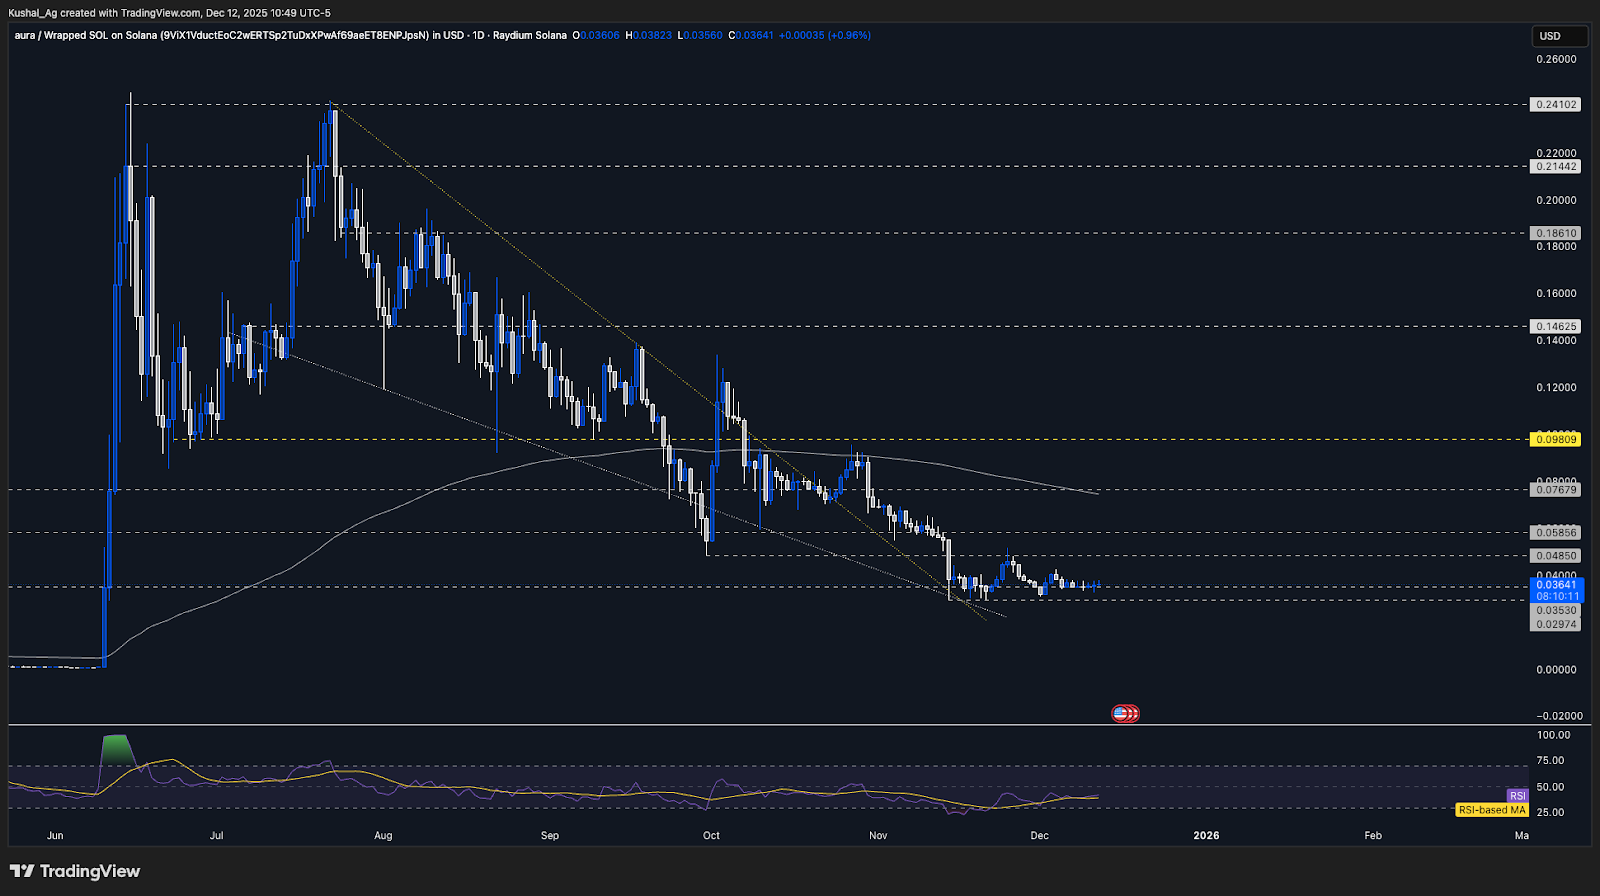
AURA
TA:AURA has spent the past week compressing tightly around the $0.035 support, building a clear base as volatility continued to contract near this level.
Price is now attempting to push away from this consolidation, signalling the early stages of a potential squeeze if broader market conditions remain supportive.
RSI has recovered meaningfully, now trading around 44 with avg around 40, showing improving momentum after an extended muted phase which is generally a constructive shift for price.
The daily 200EMA remains near $0.0748, unchanged from last week, reinforcing that AURA is still in an accumulation.
- Direction: Neutral/Bullish
- Action Plan: DCA and Raid
Cryptonary’s Take:
AURA continues to solidify its base around $0.035, with price now starting to lean away from the lower band after days of tight consolidation. This behaviour typically precedes expansion, especially when momentum begins to recover alongside price.A daily close above $0.04 would be the first confirmation that the squeeze is resolving higher, opening a move toward the range top at $0.0485. A clean break beyond that level would unlock further upside toward $0.0585. As long as $0.035 holds, the neutral-bullish bias remains intact.
Closing Thoughts
Market structure looks more organised than it did a few weeks ago, with Solana’s rounding bottom and Hyperliquid’s bullish divergence standing out as the clearest individual setups. If these structures continue to hold, upside objectives around $155 for SOL and $33 for HYPE remain valid over the coming days to weeks.Ethereum continues to anchor broader market strength. Holding above the middle of its range and consolidating at current levels keeps the neutral-bullish path open, while sustained stability here would remain supportive for selective upside continuation across assets already showing structure.
Bitcoin remains neutral and range bound. While repeated tests suggest overhead supply near the $93,000 area is thinning, BTC still needs a decisive close above this zone to unlock clearer continuation. The Fed delivered the expected 25bp rate cut, with Powell’s tone leaning slightly dovish, providing a modest supportive backdrop, but price confirmation at key technical levels remains the primary trigger.
Cryptonary Out!
Continue reading by joining Cryptonary Pro
$1,548 $1,197/year
Get everything you need to actively manage your portfolio and stay ahead. Ideal for investors seeking regular guidance and access to tools that help make informed decisions.
For your security, all orders are processed on a secured server.
As a Cryptonary Pro subscriber, you also get:
3X Value Guarantee - If cumulative documented upside does not reach 300% during your 12-month membership, you can request a full refund. Terms
24/7 access to experts with 50+ years’ experience
All of our top token picks for 2025
On hand technical analysis on any token of your choice
Weekly livestreams & ask us anything with the team
Daily insights on Macro, Mechanics, and On-chain
Curated list of top upcoming airdrops (free money)
3X Value Guarantee
If cumulative documented upside does not reach 300% during your 12-month membership, you can request a full refund.
Our track record speaks for itself
With over 2.4M tokens and widespread misinformation in crypto, we cut through the noise and consistently find winning assets.
Our track record speaks for itself
With over 2.4M tokens and widespread misinformation in crypto, we cut
through the noise and consistently find winning assets.


Frequently Asked Questions
Can I trust Cryptonary's calls?
Yes. We've consistently identified winners across multiple cycles. Bitcoin under $1,000, Ethereum under $70, Solana under $10, WIF from $0.003 to $5, PopCat from $0.004 to $2, SPX blasting past $1.70, and our latest pick has already 200X'd since June 2025. Everything is timestamped and public record.
Do I need to be an experienced trader or investor to benefit?
No. When we founded Cryptonary in 2017 the market was new to everyone. We intentionally created content that was easy to understand and actionable. That foundational principle is the crux of Cryptonary. Taking complex ideas and opportunities and presenting them in a way a 10 year old could understand.
What makes Cryptonary different from free crypto content on YouTube or Twitter?
Signal vs noise. We filter out 99.9% of garbage projects, provide data backed analysis, and have a proven track record of finding winners. Not to mention since Cryptonary's inception in 2017 we have never taken investment, sponsorship or partnership. Compare this to pretty much everyone else, no track record, and a long list of partnerships that cloud judgements.
Why is there no trial or refund policy?
We share highly sensitive, time-critical research. Once it's out, it can't be "returned." That's why membership is annual only. Crypto success takes time and commitment. If someone is not willing to invest 12 months into their future, there is no place for them at Cryptonary.
Do I get direct access to the Cryptonary team?
Yes. You will have 24/7 to the team that bought you BTC at $1,000, ETH at $70, and SOL at $10. Through our community chats, live Q&As, and member only channels, you can ask questions and interact directly with the team. Our team has over 50 years of combined experience which you can tap into every single day.
How often is content updated?
Daily. We provide real-time updates, weekly reports, emergency alerts, and live Q&As when the markets move fast. In crypto, the market moves fast, in Cryptonary, we move faster.
How does the 3X Value Guarantee work?
We stand behind the value of our research. If the documented upside from our published research during your 12-month membership does not exceed three times (3X) the annual subscription cost, you can request a full refund. Historical context: In every completed market cycle since 2017, cumulative documented upside has exceeded 10X this threshold.
TermsRecommended from Cryptonary


